樣本量估計及其在nQuery和SAS軟件上的實現(xiàn)*——均數(shù)比較(十一)
2019-07-10 07:01:46南方醫(yī)科大學生物統(tǒng)計學系510515
中國衛(wèi)生統(tǒng)計 2019年3期
關鍵詞:設計
南方醫(yī)科大學生物統(tǒng)計學系(510515)
徐 瑩 高培純 徐笑寒 陳平雁△
1.2.2.11 基于比值高階交叉設計的非劣效性檢驗
Chen(1997)[1]和Chow and Liu(2009)[2]給出的高階交叉設計的樣本量估計方法是建立在近似服從自由度為vk的t分布上,當指標為高優(yōu)指標時,其檢驗效能計算公式為:
(1-59)
當指標為低優(yōu)指標時,對應的檢驗效能計算公式為:
(1-60)

在計算樣本量時,一般先設定樣本量初始值,然后迭代樣本量直到所得的檢驗效能滿足條件為止。此時的樣本量,即研究所需的樣本量。
【例1-32】某公司欲驗證一種治療風濕病的仿制藥非劣于標準藥。擬采用2×4設計。研究者決定將非劣界值設置為0.2。根據(jù)以往研究,已知標準藥CV為0.4。假設仿制藥與標準藥真實比值為1。檢驗水準為0.05,試估計檢驗效能為90%所需的樣本量。
nQuery Advanced 8.2實現(xiàn):設定檢驗水準為α=0.05,檢驗效能取90%。由題意知,μ2/μ1=1,NIM=0.2,CV=0.4。在nQuery Advanced 8.2主菜單選擇:
方法框中選擇:Higher-order Cross-Over Design for Two Means- Non-Inferiority-using Ratios
在彈出的樣本量計算窗口將各參數(shù)鍵入,如圖1-75所示,結果為N=29。

圖1-75 nQuery Advanced 8.2 關于例1-32樣本量估計的參數(shù)設置與計算結果
SAS9.4軟件實現(xiàn):
proc IML;
start MTE91(Designtype,Better,a,Ratio,NIM,CV,power);
error=0;
if(Designtype=1|Designtype=2|Designtype=3|Designtype=4)then do;
error=0;end;
else do;error=1;print"error" "Designtype must be 1 or 2 or 3 or 4";end;
if(Better=1 | Better=0)then do;
error=0;end;
else do;
error=1;print"error" "Higher means better(1)/worse(0)";end;
if(a>0.2 | a<0) then do;
error=1;print"error" "Test significance level must be in 0-0.2";end;
if(Ratio<0) then do;
error=1;print"error" "True Ratio of means must be>0";end;
if(NIM<0) then do;
error=1;print"error" "Non-Inferiority margin must be>0";end;
if(Better=1) then do;
if(Ratio<= 1-NIM)then do;
error=1;print"error" "True Ratio should be>1 - Non-Inferiority margin if higher means better";end;
end;
if(Better=0) then do;
if(Ratio>= 1+NIM)then do;
error=1;print"error" "True Ratio should be<1+Non-Inferiority margin if higher means worse";end;
end;
if(CV<0) then do;
error=1;print"error" "Coefficient of variance must be>= 0";end;
if(power>100 | power<1) then do;
error=1;print"error" "Power(%) must be in 1-100";end;
if(error=1) then stop;
if(error=0) then do;
if(Designtype=1) then do;n=1;b=2;end;
if(Designtype=2) then do;n=2;b=3/4;end;
if(Designtype=3) then do;n=1;b=11/20;end;
if(Designtype=4) then do;n=1;b=1/4;end;
Sw=sqrt(log(CV**2+1));
if(Better=1) then do;
do until(pw>=power/100);
if(Designtype=1) then do;df=4*n-3;end;
if(Designtype=2) then do;df=4*n-4;end;
if(Designtype=3) then do;df=6*n-5;end;
if(Designtype=4) then do;df=12*n-5;end;
t=(-log(Ratio)-log(1-NIM))/(Sw*sqrt(b/n))-tinv(1-a,df);
pw=probt(t,df);n=n+0.01;
end;
end;
if(Better=0) then do;
do until(pw>=power/100);
if(Designtype=1) then do;df=4*n-3;end;
if(Designtype=2) then do;df=4*n-4;end;
if(Designtype=3) then do;df=6*n-5;end;
if(Designtype=4) then do;df=12*n-5;end;
t=tinv(1-a,df)-(log(Ratio)+log(1+NIM))/(Sw*sqrt(b/n));
pw=probt(t,df);n=n+0.01;
end;
end;
if(Designtype=1) then do;N=ceil((n-0.01)*4);end;
if(Designtype=2) then do;N=ceil((n-0.01)*2);end;
if(Designtype=3) then do;N=ceil((n-0.01)*2);end;
if(Designtype=4) then do;N=ceil((n-0.01)*4);end;
if(Designtype=1) then do;Design_type="1. 4*2";end;
if(Designtype=2) then do;Design_type="2. 2*3";end;
if(Designtype=3) then do;Design_type="3. 2*4";end;
if(Designtype=4) then do;Design_type="4. 4*4";end;
if better=1 then Better_="better";else Better_="worse";
Design_type
Better_[label="Higher Mean Values are"]
a[label="Test Significance Level"]
Ratio[label="True Ratio of Means,u2/u1"]
NIM[label="Non-Inferiority Margin"]
CV[label="Coefficient of Variance,CV"]
power[label="Power(%)"]
N[label="N"];
end;
finish MTE91;
run MTE91(3,1,0.05,1,0.2,0.4,90);
quit;
SAS運行結果:

圖1-76 SAS 9.4 關于例1-32樣本量估計的參數(shù)設置與計算結果
1.2.2.12 基于均差高階交叉設計的優(yōu)效性檢驗
Chen(1997)[1]和Chow and Liu(2009)[2]給出的高階交叉設計的樣本量估計方法是建立在近似服從自由度為vk的t分布上,當指標為高優(yōu)指標時,其檢驗效能計算公式為:
(1-61)
當指標為低優(yōu)指標時,對應的檢驗效能計算公式為:
(1-62)

在計算樣本量時,一般先設定樣本量初始值,然后迭代樣本量直到所得的檢驗效能滿足條件為止。此時的樣本量,即研究所需的樣本量。
【例1-33】某公司欲驗證一種治療風濕病的仿制藥非劣于標準藥,擬采用2×3設計。研究者決定將優(yōu)效界值設置為5。根據(jù)以往類似研究,已知均方誤為100。假設仿制藥于標準藥真實差值為15。檢驗水準設置為0.05,試估計檢驗效能為90%所需的樣本量。
nQuery Advanced 8.2 實現(xiàn):設定檢驗水準為α=0.05,檢驗效能取90%。由題意知,μ2-μ1=15,SM=5,=10。在nQuery Advanced 8.2主菜單選擇:
方法框中選擇:Higher-order Cross-Over Design for Two Means- Superiority by Margin-using Differences
在彈出的樣本量計算窗口將各參數(shù)鍵入,如圖1-77所示,結果為N=14。

圖1-77 nQuery Advisor 8.2 關于例1-33樣本量估計的參數(shù)設置與計算結果
SAS 9.4軟件實現(xiàn):
proc IML;
start MTE71(Designtype,Better,a,Delta,SM,Sw,power);
error=0;
if(Designtype=1|Designtype=2|Designtype=3|Designtype=4)then do;
error=0;end;
elsedo;error=1;print"error" "Designtype must be 1 or 2 or 3 or 4";end;
if(Better=1 | Better=0)then do;
error=0;end;
else do;
error=1;print"error" "Higher means better(1)/worse(0)";end;
if(a>0.2 | a<0) then do;
error=1;print"error" "Test significance level must be in 0-0.2";end;
if(Better=1) then do;
if(Delta<= abs(SM))then do;
error=1;print"error" "True difference in means must>superiority margin if higher means better";end;
end;
if(Better=0) then do;
if(Delta>= -abs(SM))then do;
error=1;print"error" "True difference in means must end; if(Sw<0) then do; error=1;print"error" "Within standard error must be>=0";end; if(power>100 | power<1) then do; error=1;print"error" "Power(%) must be in 1-100";end; if(error=1) then stop; if(error=0) then do; if(Designtype=1) then do;n=1;b=2;end; if(Designtype=2) then do;n=2;b=3/4;end; if(Designtype=3) then do;n=1;b=11/20;end; if(Designtype=4) then do;n=1;b=1/4;end; if(Better=1) then do; do until(pw>=power/100); if(Designtype=1) then do;df=4*n-3;end; if(Designtype=2) then do;df=4*n-4;end; if(Designtype=3) then do;df=6*n-5;end; if(Designtype=4) then do;df=12*n-5;end; t=(Delta-abs(SM))/(Sw*sqrt(b/n))-tinv(1-a,df); pw=probt(t,df);n=n+0.01; end; end; if(Better=0) then do; do until(pw>=power/100); if(Designtype=1) then do;df=4*n-3;end; if(Designtype=2) then do;df=4*n-4;end; if(Designtype=3) then do;df=6*n-5;end; if(Designtype=4) then do;df=12*n-5;end; t=tinv(1-a,df)-(-Delta-abs(SM))/(Sw*sqrt(b/n)); pw=probt(t,df);n=n+0.01; end; end; if(Designtype=1) then do;N=ceil((n-0.01)*4);end; if(Designtype=2) then do;N=ceil((n-0.01)*2);end; if(Designtype=3) then do;N=ceil((n-0.01)*2);end; if(Designtype=4) then do;N=ceil((n-0.01)*4);end; if(Designtype=1) then do;Design_type="1. 4*2";end; if(Designtype=2) then do;Design_type="2. 2*3";end; if(Designtype=3) then do;Design_type="3. 2*4";end; if(Designtype=4) then do;Design_type="4. 4*4";end; if better=1 then Better_="better";else Better_="worse"; print Design_type Better_[label="Higher Mean Values are"] a[label="Test Significance Level"] Delta[label="True Difference in Means.u2-u1"] SM[label="Superiority Margin"] Sw[label="Within Standard Error"] power[label="Power(%)"] N[label="N"]; end; finish MTE71; run MTE71(2,1,0.05,15,5,10,90); quit; SAS運行結果: 圖1-78 SAS 9.4 關于例1-33樣本量估計的參數(shù)設置與計算結果 1.2.2.13 基于比值高階交叉設計的優(yōu)效性檢驗 Chen(1997)[1]和Chow(2009)[2]給出的高階交叉設計的樣本量估計方法是建立在近似服從自由度為vk的t分布上,當指標為高優(yōu)指標時,其檢驗效能計算公式為: (1-63) 當指標為低優(yōu)指標時對應的檢驗效能計算公式為: (1-64) 在計算樣本量時,一般先設定樣本量初始值,然后迭代樣本量直到所得的檢驗效能滿足條件為止。此時的樣本量,即研究所需的樣本量。 【例1-34】某公司欲驗證一種治療風濕病的仿制藥非劣于標準藥,擬采用2×4設計。研究者決定將優(yōu)效界值設置為0.2。根據(jù)以往研究,已知標準藥CV為0.4。假設仿制藥與標準藥真實比值為1.4。檢驗水準設置為0.05,試估計檢驗效能為90%所需的樣本量。 nQuery Advanced 8.2 實現(xiàn):設定檢驗水準為α=0.05,檢驗效能取90%。由題意知,μ2/μ1=1.4,SM=0.2,CV=0.4。在nQuery Advanced 8.2主菜單選擇: 方法框中選擇:Higher-order Cross-Over Design for Two Means- Superiority by Margin- using Ratios 在彈出的樣本量計算窗口將各參數(shù)鍵入,如圖1-79所示,結果為N=60。 圖1-79 nQuery Advanced 8.2 關于例1-34樣本量估計的參數(shù)設置與計算結果 SAS 9.4軟件實現(xiàn): proc IML; start MTE101(Designtype,Better,a,Ratio,SM,CV,power); error=0; if(Designtype=1|Designtype=2|Designtype=3|Designtype=4)then do; error=0;end; elsedo;error=1;print"error" "Designtype must be 1 or 2 or 3 or 4";end; if(Better=1 | Better=0)then do; error=0;end; else do; error=1;print"error" "Higher means better(1)/worse(0)";end; if(a>0.2 | a<0) then do; error=1;print"error" "Test significance level must be in 0-0.2";end; if(Ratio<= 0) then do; error=1;print"error" "True Ratio of means must be>0";end; if(SM<0) then do; error=1;print"error" "Superiority margin must be>0";end; if(Better=1) then do; if(Ratio<= 1+SM)then do; error=1;print"error" "True difference in means must>1+superiority margin if higher means better";end; end; if(Better=0) then do; if(Ratio>= 1-SM)then do; error=1;print"error" "True difference in means must<1 - superiority margin if higher means worse";end; end; if(CV<0) then do; error=1;print"error" "Coefficient of variance must be>= 0";end; if(power>100 | power<1) then do; error=1;print"error" "Power(%) must be in 1-100";end; if(error=1) then stop; if(error=0) then do; if(Designtype=1) then do;n=1;b=2;end; if(Designtype=2) then do;n=2;b=3/4;end; if(Designtype=3) then do;n=1;b=11/20;end; if(Designtype=4) then do;n=1;b=1/4;end; Sw=sqrt(log(CV**2+1)); if(Better=1) then do; do until(pw>=power/100); if(Designtype=1) then do;df=4*n-3;end; if(Designtype=2) then do;df=4*n-4;end; if(Designtype=3) then do;df=6*n-5;end; if(Designtype=4) then do;df=12*n-5;end; t=(abs(log(Ratio))-log(1+SM))/(Sw*sqrt(b/n))-tinv(1-a,df); pw=probt(t,df);n=n+0.01; end; end; if(Better=0) then do; do until(pw>=power/100); if(Designtype=1) then do;df=4*n-3;end; if(Designtype=2) then do;df=4*n-4;end; if(Designtype=3) then do;df=6*n-5;end; if(Designtype=4) then do;df=12*n-5;end; t=-(abs(log(Ratio))+log(1-SM))/(Sw*sqrt(b/n))+tinv(1-a,df); pw=probt(t,df);n=n+0.01; end; end; if(Designtype=1) then do;N=ceil((n-0.01)*4);end; if(Designtype=2) then do;N=ceil((n-0.01)*2);end; if(Designtype=3) then do;N=ceil((n-0.01)*2);end; if(Designtype=4) then do;N=ceil((n-0.01)*4);end; if(Designtype=1) then do;Design_Type="1. 4*2";end; if(Designtype=2) then do;Design_Type="2. 2*3";end; if(Designtype=3) then do;Design_Type="3. 2*4";end; if(Designtype=4) then do;Design_Type="4. 4*4";end; print Design_Type a[label="Test Significance Level"] Ratio[label="True Ratio of Means,u2/u1"] SM[label="Superiority margin"] CV[label="Coefficient of Variance(non-logarithmic),CV"] power[label="Power(%)"] N[label="N"]; end; finish MTE101; run MTE101(3,1,0.05,1.4,0.2,0.4,90); quit; SAS運行結果: 圖1-80 SAS 9.4 關于例1-34樣本量估計的參數(shù)設置與計算結果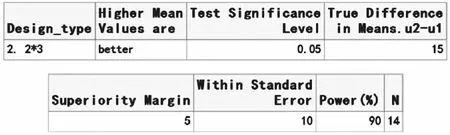


猜你喜歡
河北畫報(2020年8期)2020-10-27 02:54:06
現(xiàn)代裝飾(2020年7期)2020-07-27 01:27:42
流行色(2020年1期)2020-04-28 11:16:38
電子制作(2019年19期)2019-11-23 08:41:36
電子制作(2019年15期)2019-08-27 01:11:50
電子制作(2019年7期)2019-04-25 13:18:16
藝術啟蒙(2018年7期)2018-08-23 09:14:18
海峽姐妹(2017年7期)2017-07-31 19:08:17
Coco薇(2017年5期)2017-06-05 08:53:16
商周刊(2017年26期)2017-04-25 08:13:04