Freshening biases in the freshwater flux of CORE data
2016-11-23 04:47:19JINJingBoZENGQingCunLIUHiLongnWULin
關鍵詞:區(qū)域
JIN Jing-Bo, ZENG Qing-Cun, LIU Hi-Longn WU Lin
aInternational Center for Climate and Environment Sciences (ICCES), Institute of Atmospheric Physics (IAP), Chinese Academy of Sciences (CAS),Beijing, China;bCollege of Earth Science, University of Chinese Academy of Sciences, Beijing, China;cState Key Laboratory of Numerical Modeling for Atmospheric Science and Geophysical Fluid Dynamics (LASG), IAP, CAS, Beijing, China;dState Key Laboratory of Atmospheric Boundary Layer physics and Atmospheric chemistry (LAPC), IAP, CAS, Beijing, China
Freshening biases in the freshwater flux of CORE data
JIN Jiang-Boa,b, ZENG Qing-Cuna, LIU Hai-Longcand WU Lind
aInternational Center for Climate and Environment Sciences (ICCES), Institute of Atmospheric Physics (IAP), Chinese Academy of Sciences (CAS),Beijing, China;bCollege of Earth Science, University of Chinese Academy of Sciences, Beijing, China;cState Key Laboratory of Numerical Modeling for Atmospheric Science and Geophysical Fluid Dynamics (LASG), IAP, CAS, Beijing, China;dState Key Laboratory of Atmospheric Boundary Layer physics and Atmospheric chemistry (LAPC), IAP, CAS, Beijing, China
The authors investigate biases in the freshwater fux (FWF) of CORE.v2-a common data-set for stand-alone ocean models-based on the results of a set of experiments using an OGCM. The authors identify freshening biases in the FWF in the subtropical regions of the North Pacifc, South Pacifc, and South Atlantic, which may be caused by the weak surface wind, high specifc humidity,or high precipitation in the CORE.v2 data. The authors also fnd biases in sea surface salinity that are caused by ocean dynamics, such as in the North Atlantic, and that cannot be corrected by correcting surface forcing.
ARTICLE HISTORY
Revised 10 April 2016
Accepted 27 April 2016
Freshwater fux; CORE.v2;LICOM2.0
CORE.v2是單獨海洋環(huán)流模式常用的強迫場,其微弱的偏差會造成模擬結果巨大的差異。因此,本文使用單獨的海洋環(huán)流模式LICOM2.0對CORE.v2的強迫場進行了驗證。結果表明,在北大西洋和太平洋的副熱帶區(qū)域的淡水通量有使海表鹽度變淡的偏差的作用,這可能是由于CORE.v2中的弱的表面風,強的比濕或者過多的降水所造成的。另外,在北大西洋高緯度區(qū)域的海表鹽度變淡的偏差主要是與海洋動力學過程有關而非強迫場所造成的。
1. Introduction
Stand-alone OGCMs are driven by the observed surface momentum fux (or wind stress), heat fux, and freshwater fux (FWF), which usually include precipitation, evaporation, and river runof. Many studies have identifed the important efects of surface wind stress and heat fux on OGCMs (e.g. Yu et al. 2001; Chen, Zhang, and Li 2011). FWF forcing also has signifcant efects on OGCM simulations. Grifes et al. (2009) reported that errors in the FWF directly forced a large drift in ocean salinity in an OGCM. Ocean salinity modulates the oceanic density and mixed layer depth, both of which can further modify surface currents and the SST (e.g. Thompson, Gnanaseelan, and Salvekar 2006; Wu et al. 2010; Zhang, Wang et al. 2010; Zhang,Zheng et al. 2012; Ma, Wu, and Li 2013; Zhi et al. 2015). The FWF is also a very crucial factor in maintaining and altering thermohaline circulation (Bryan 1986; Sévellec and Fedorov 2011). Huang and Mehta (2005) presented related changes in salinity-associated FWF forcing as playing a crucial role in maintaining the Pacifc climate and low-frequency variability. However, because there is no direct feedback to the boundary conditions of the surface FWF in ocean models, the accumulation of errors in FWF data may lead to serious drift in models. This drift occurs not only in salinity, but also in circulation. Therefore, it is worth evaluating the uncertainty of the forcing data-set with respect to the surface FWF. Because of the lack of observational reference data, a direct evaluation of these uncertainties is difcult. An alternative is to evaluate FWF data by evaluating OGCM results. For this purpose, we expect the FWF data to yield more accurate sea surface salinity (SSS) values and less drift in global mean salinity.
CORE.v2 (Grifes et al. 2009; Large and Yeager 2009)contains normal-year forcing datasets that are widely used by the OGCM development community. CORE.v2 data are based on NCEP Reanalysis-1 and other in situ and satellite observation datasets. In these datasets, precipitation is based on the combined monthly data from 1979 to 2006,the details of which can be found in Large and Yeager(2009). Evaporation is computed using atmospheric state variables (prescribed specifc humidity and vector winds from NCEP Reanalysis-1) and SST values predicted by OGCMs. Therefore, any bias in evaporation may be attributable to errors in not only the atmospheric state variables,but also the simulated SST. Another important component of the FWF is runof, which is distributed only around ocean coastal regions and adjacent to river mouths.
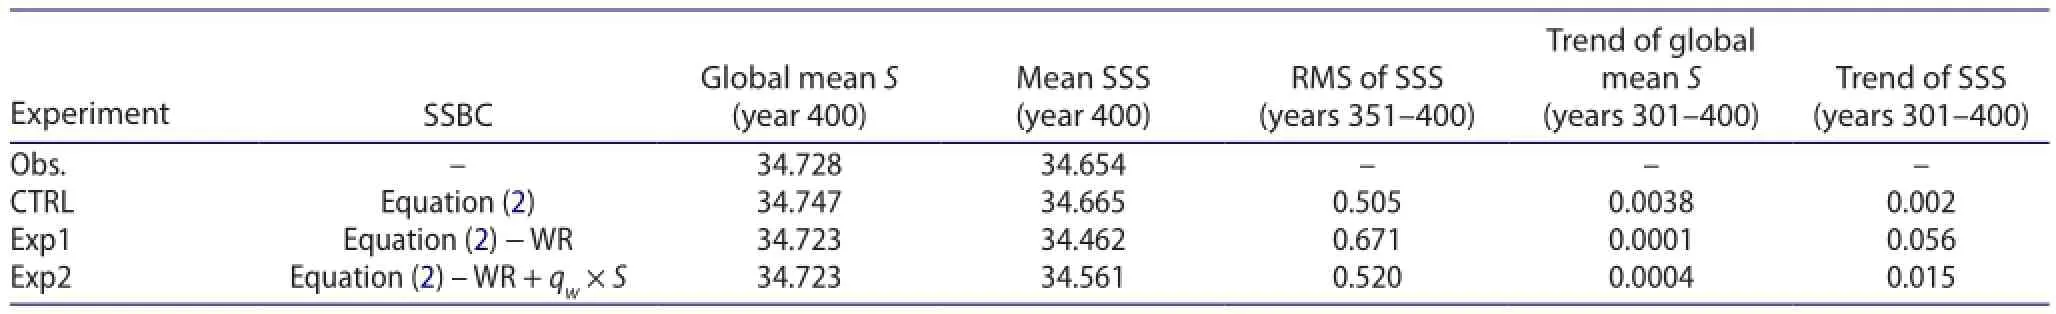
Table 1.Formulas for the SSBC of the three experiments, and the statistically simulated salinity values from the diferent experiments.
The purpose of this study is to use results from an ocean model to evaluate FWF data errors in CORE.v2. In Section 2, we briefy introduce the model and the experiments. In Section 3, we present the results from the three experiments. And in Section 4, we provide a brief summary of the study’s fndings.
2. Model and experiment design
The OGCM used in the study was LICOM2.0 (Liu et al. 2012). LICOM2.0 has 30 levels in the vertical direction, with 10 m per layer in the upper 150 m. The model domain ranges from 78° S to 87° N, with a 1° zonal resolution. The nominal meridional resolution is refned to 0.5° between 10° S and 10° N, and increases gradually from 0.5° to 1° between 10° and 20°. More details on LICOM2.0 can be found in Liu et al. (2012).

The surface salinity boundary condition (SSBC) in LICOM2.0 is a combination of the virtual salinity fux and two restoring terms. The formula is where E, P, and R are evaporation precipitation, and river runof, respectively. S0is the reference salinity, which is assigned as 34.7 psu. WR is the weak restoring salinity condition, with a piston velocity of 12.5 m yr-1in the open ocean. In addition to the observational constraint of the SSS, WR may also be partially considered as a correction of the surface forcing. SR stands for the strong restoring term under sea ice, with a piston velocity of 120 m yr-1, or a restoration time scale of 30 days.
A new well-posed formulation of the SSBC was made prior to this study, as follows:

The predicted SSS, S, is adopted in this SSBC. μS is the upward or exiting salt fux resulting from wind, which may cancel out globally integrated ocean salt from the correlation between the FWF and the predicted SSS. μ is parameterized as a function of the 10-m wind speed. Because μS is relatively small, the pattern of the frst two terms of Equation (2) is actually dominated by (E - P - R) (fgure not shown). The magnitudes of μS are only signifcant in the Southern Ocean and midlatitudes where the surface winds are strong.
We carried out three experiments in this study, including a control and two sensitivity experiments, called CTRL,Exp1, and Exp2, respectively. The SSBC formulas for the three runs are listed in Table 1. Our objective in the experiments was to evaluate the uncertainty of the FWF data forcing in CORE.v2 by comparing the diferent model biases in salinity among the three experiments. Exp1 used no WR term, in order to show the uncertainty efects in the FWF data for CORE.v2 in the simulation. Exp2 was the same as Exp1, but we added the term qw(= WR / S) in the surface FWF to correct for biases in the observational data. The term qwwas calculated from the annual-mean WR term for CTRL during years 461-500. The spatial pattern of WR was close to the biases in SSS in Exp1 (fgure not shown). Because a sea-ice model is not included in LICOM2.0, we used SR in each experiment. All other settings for the three experiments were the same. We initialized the experiments from the climatic mean temperature and salinity with no motion, and integrated them for a period of 400 years.
3. Results
Figure 1(a) shows the time series of the global mean SSS for the three experiments. The global mean SSS for CTRL and Exp2 reached quasi-equilibrium after the 400-year integration. The linear trends were 0.002 and 0.015 psu/100 yr during the last 100-year period (Table 1),respectively. However, Exp1 showed a much stronger trend,0.056 psu/100 yr, during the last 100-year period. Because the restoring term was included in CTRL, the results from the CTRL experiment were closer to the observational value. Figure 1(b) shows the global volume-mean salinity from the three experiments. The weak freshening trends were about 0.0001 and 0.0004 psu psu/100 yr for the Exp1 and Exp2 runs in the last 100-year period, respectively. The annual global mean salinities for Exp1 and Exp2 during the 400th year were the same-about 34.723 psu-which difered less than 0.005 psu from that in the World OceanAtlas (WOA09; Antonov et al. 2010), i.e. the climatological felds during 1890-2008. However, the CTRL run exhibited a signature trend of about 0.0038 psu psu/100 yr. This indicates that the surface conditions of Exp1 and Exp2 were balanced, while they were imbalanced in the CTRL run.
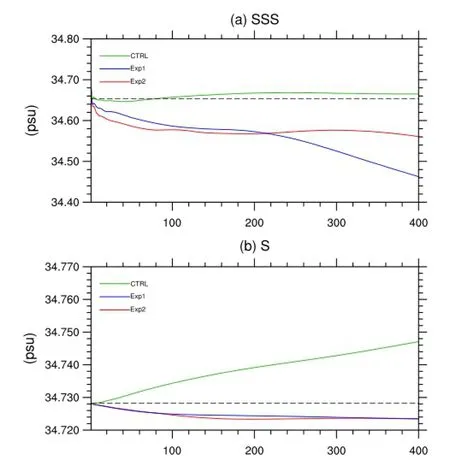
Figure 1.The (a) global mean SSS and (b) volume-mean global ocean salinity (units: psu) for the CTRL (green), EXP1 (blue), and EXP2 (red) runs with LICOM2.0.
In summary, for both the global mean SSS and salinity results, we found that although Exp1 obtained results nearing equilibrium, like those of Exp2, the biases and trends of the global mean SSS were relatively bigger than in the other two experiments. Because the restoring term was omitted in Exp1 without making any correction, the freshening drift may be related to biases in the forcing data. To identify the specifc reasons for this drift, the spatial patterns of the SSS biases in SSS must be further investigated.
Figures 2(a)-(c) compare the biases of the annual-mean SSS that were simulated in the three experiments with those from WOA09 (Antonov et al. 2010). The RMSs of the SSS for CTRL, Exp1, and Exp2 were 0.505, 0.671, and 0.520 psu (Table 1), respectively. That is, Exp1 generally yielded a relatively larger SSS bias than did the other two experiments. In the CTRL run, large SSS biases occurred both in the North Atlantic along the Gulf Stream and in the northern coast of the Eurasian continent in the Arctic Ocean. The former was a freshening bias and the latter was salty. However, the biases in Exp1 had the same pattern as in the CTRL experiment, but with larger magnitudes. Freshening biases (less than -0.6 psu) were found in the subtropical regions of the North Pacifc, South Pacifc, and South Atlantic. The same kind of bias pattern can also be found in some other models forced by CORE.v2 data (Figure 8 in Grifes et al. 2009); for instance, the models of the MPI and KNMI, which use very weak salinity restoration. This also indicates that the freshening biases may be caused by the data-set itself, not the biases of the model processes. After introducing the correction term in Exp2, the freshening biases poleward of the subtropical regions almostdisappeared, except in the North Atlantic. The diferences between Exp2 and Exp1 can be clearly seen in Figure 2(d). A comparison between the two experiments indicates that there is much more freshwater entering the subtropical regions for CORE v2. That is, less water has evaporated or more precipitation has fallen over these regions.
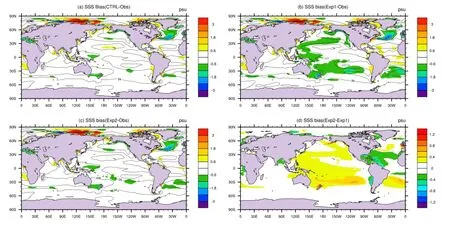
Figure 2.Annual-mean SSS (contours) and their biases (color-shaded) for (a) CTRL, (b) Exp1, and (c) Exp2, with respect to WOA09(Antonov et al. 2010). (d) Diference in SSS between Exp2 and Exp1. The model output is taken from the last 50 years (years 351-400).
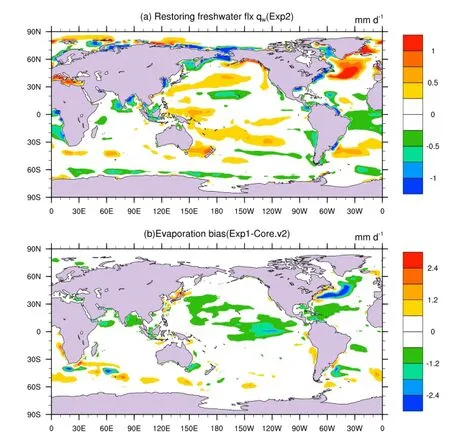
Figure 3.The (a) annual-mean restoring FWF, qw, from the CTRL run during years 461-500, and (b) diference (units: mm d-1) in annualmean evaporation simulated in Exp1 relative to that of CORE.v2 (Large and Yeager 2009).
Figure 3(a) shows the value of the correction term,qw. The positive (negative) values stand for water exiting(entering) the ocean. Large positive centers are located close to the freshening biases in Figure 2(b). This further confrms that the biases in the subtropical regions in the North Pacifc, South Pacifc, and South Atlantic are mainly due to errors in the forcing datasets. But without in situ observational data, we cannot determine if the errors are caused by evaporation or precipitation.
Because the evaporation values in LICOM2.0 are computed using both observed atmospheric state variables(vector winds at 10 m and specifc humidity at 10 m) and simulated SST by LICOM2.0, it is also possible that the biases in the simulated SST caused the freshening biases in these regions. We further investigated the diferences in the evaporation between Exp1 and the CORE.v2 data,using the observational SST (Figure 3(b)) for our computations. We found that the spatial pattern in the subtropics difered from the SSS bias and the correction term, but was the same as the SST bias (not shown). That is, the evaporation biases in the subtropics are not caused by biases in the simulated SST, but rather by the data-set itself, such as the weak vector winds at 10 m and/or the high specifc humidity at 10 m.
It is interesting that the spatial pattern of the SSS biases for Exp2 was the same as that for CTRL. Two large bias centers remained in the North Atlantic along the Gulf Stream and in the northern coast of the Eurasian continent in the Arctic Ocean. This suggests that these biases may not be caused by errors in the forcing data, but by dynamic ocean processes in LICOM2.0. For instance, the freshening biases in the North Atlantic may be related to the biases of the Gulf Stream simulated in LICOM2.0, and the salinity errors in the Arctic Ocean may be associated with sea-ice processes. Some of the SSS errors in the North Atlantic were caused by biases in the SST (Figure 3(b)).
4. Summary and discussion
We investigated biases in the FWF of CORE.v2 via a set of experiments using an OGCM. We found that the freshening biases in the subtropical regions in the North Pacifc, South Pacifc and South Atlantic for Exp1 could be corrected by using a correction term for the surface forcing. We are certain that these biases are caused by freshening biases in CORE.v2, since the SST biases cannot afect evaporation in these regions. However, without further investigation,we cannot determine if the errors are caused by evaporation or precipitation. The freshening biases may be caused by the weak surface wind, high specifc humidity, or high precipitation in the CORE.v2 data. To further clarify these biases, in situ observations must be used for observational reference.
We also found SSS biases caused by ocean dynamics,such as in the North Atlantic. These biases cannot be corrected by correcting the surface forcing. These processes include salinity advection, vertical mixing and entrainment of the mixed layer. The causes of these kinds of biases will also require further investigation.
Acknowledgements
Discussions with Dr LIN Pengfei and Mr YU Yi were very helpful during the course of this work.
Disclosure statement
No potential confict of interest was reported by the authors.
Funding
This work was supported by the National Basic Research Program of China (grant number 2013CB956204); and the Strategic Priority Research Program of the Chinese Academy of Sciences(grant numbers XDA11010403 and XDA11010304).
References
Antonov, J. I., D. Seidov, T. P. Boyer, R. A. Locarnini, A. V. Mishonov,H. E. Garcia, O. K. Baranova, M. M. Zweng, and D. R. Johnson. 2010. “World Ocean Atlas 2009.” In Vol. 2 of Salinity, edited by S. Levitus, 184. Washington, DC: NOAA Atlas NESDIS 69, U.S. Government Printing Ofce.
Bryan, F. 1986. “High-latitude Salinity Efects and Interhemispheric Thermohaline Circulations.” Nature 323: 301-304.
Chen, G. Z., M. Zhang, and C. Y. Li. 2011. “Simulation Studies on the Response Sensitivity of Sea Surface Flow to External Forcing.” Transactions of Atmospheric Sciences 34 (2): 199-208(in Chinese).
Grifes, S. M., A. Biastoch, C. B?ning, F. Bryan, G. Danabasoglu,E. P. Chassignet, M. H. England, et al. 2009. “Coordinated Ocean-ice Reference Experiments (COREs).” Ocean Modelling 26: 1-46.
Huang, B. Y., and V. M. Mehta. 2005. “Response of the Pacifc and Atlantic Oceans to Interannual Variations in Net Atmospheric Freshwater.” Journal of Geophysical Research 110: C08008. doi:10.1029/2004JC002830.
Large, W., and S. Yeager. 2009. “The Global Climatology of an Interannually Varying Air-Sea Flux Data Set.” Climate Dynamics 33: 341-364.
Liu, H. L., P. F. Lin, Y. Q. Yu, and X. H. Zhang. 2012. “The Baseline Evaluation of LASG/IAP Climate System Ocean Model (LICOM)Version 2.” Acta Meteorologica Sinica 26: 318-329.
Ma, H., L. X. Wu, and Z. Q. Li. 2013. “Impact of Freshening over the Southern Ocean on ENSO.” Atmospheric Science Letters 14(1): 28-33.
Sévellec, F., and A. V. Fedorov. 2011. “Stability of the Atlantic Meridional Overturning Circulation and Stratifcation in a Zonally Averaged Ocean Model: Efects of Freshwater Flux,Southern Ocean Winds, and Diapycnal Difusion.” Deep Sea Research Part II: Topical Studies in Oceanography 58: 1927-1943.
Thompson, B., C. Gnanaseelan, and P. S. Salvekar. 2006.“Variability in the Indian Ocean Circulation and Salinity and Its Impact on SST Anomalies during Dipole Events.” Journal of Marine Research 64: 853-880.
Wu, L. X., Y. Sun, J. X. Zhang, L. P. Zhang, and S. Minobe. 2010.“Coupled Ocean-Atmosphere Response to Idealized Freshwater Forcing over the Western Tropical Pacifc.” Journal of Climate 23 (7): 1945-1954.
Yu, Y. Q., X. H. Zhang, Y. F. Guo, and A. Izard. 2001. “A Response of IAP/LASG Oceanic General Circulation Model to the Observed Wind Stress.” Chinese Journal of Atmospheric Sciences 25 (6): 721-739 (in Chinese).
Zhang, R. H., G. H. Wang, D. K. Chen, A. J. Busalacchi, and E. C. Hackert. 2010. “Interannual Biases Induced by Freshwater Flux and Coupled Feedback in the Tropical Pacifc.” Monthly Weather Review 138: 1715-1737.
Zhang, R. H., F. Zheng, J. S. Zhu, Y. H. Pei, Q. A. Zheng, and Z. G. Wang. 2012. “Modulation of El Ni?o-Southern Oscillation by Freshwater Flux and Salinity Variability in the Tropical Pacifc.” Advances in Atmospheric Sciences 29: 647-660. doi:10.1007/s00376-012-1235-4.
Zhi, H., R. H. Zhang, P. F. Lin, and L. N. Wang. 2015. “Simulation of Salinity Variability and the Related Freshwater Flux Forcing in the Tropical Pacifc: An Evaluation Using the Beijing Normal University Earth System Model (BNU-ESM).” Advances in Atmospheric Sciences 32 (11): 1551-1564. doi:10.1007/ s00376-015-4240-6.
9 March 2016
CONTACT LIU Hai-Long lhl@lasg.iap.ac.cn
? 2016 The Author(s). Published by Informa UK Limited, trading as Taylor & Francis Group.
This is an Open Access article distributed under the terms of the Creative Commons Attribution License (http://creativecommons.org/licenses/by/4.0/), which permits unrestricted use, distribution, and reproduction in any medium, provided the original work is properly cited.
猜你喜歡
發(fā)明與創(chuàng)新·小學生(2021年3期)2021-03-25 11:48:49
科學(2020年5期)2020-11-26 08:19:22
軟件(2020年3期)2020-04-20 01:45:18
商周刊(2018年15期)2018-07-27 01:41:20
敦煌學輯刊(2018年1期)2018-07-09 05:46:42
北京教育·普教版(2017年1期)2017-02-05 13:26:23
新疆農(nóng)墾科技(2016年2期)2016-08-21 13:50:16
中國科技博覽(2016年2期)2016-04-25 20:32:39
小學生導刊(2016年34期)2016-04-11 00:49:44
新疆財經(jīng)大學學報(2015年3期)2015-12-10 03:49:15
 Atmospheric and Oceanic Science Letters2016年5期
- Atmospheric and Oceanic Science Letters的其它文章
- Real-time simulation and mechanistic analysis of a squall line case in East China
- MJO potential predictability and predictive skill in IAP AGCM 4.1
- Applicability of an eddy covariance system based on a close-path quantumcascade laser spectrometer for measuring nitrous oxide fluxes from subtropical vegetable fields
- Pathways of intraseasonal Kelvin waves in the Indonesian Throughflow regions derived from satellite altimeter observation
- Delving into the relationship between autumn Arctic sea ice and central-eastern Eurasian winter climate
- A weakly coupled data assimilation system of a coupled physical-biological model for the northeastern South China Sea