Real-time simulation and mechanistic analysis of a squall line case in East China
2016-11-23 04:47:24SUYngPINGFnSHENXinYongndMIAOChunSheng
SU Yng, PING Fn, SHEN Xin-Yongnd MIAO Chun-Sheng
aCollaborative Innovation Center on Forecast and Evaluation of Meteorological Disasters, Key Laboratory of Meteorological Disaster of Ministry of Education, Nanjing University of Information Science and Technology, Nanjing, China;bLaboratory of Cloud-Precipitation Physics and Severe Storms (LACS), Institute of Atmospheric Physics, Chinese Academy of Sciences, Beijing, China
Real-time simulation and mechanistic analysis of a squall line case in East China
SU Yanga,b, PING Fanb, SHEN Xin-Yonga,band MIAO Chun-Shenga
aCollaborative Innovation Center on Forecast and Evaluation of Meteorological Disasters, Key Laboratory of Meteorological Disaster of Ministry of Education, Nanjing University of Information Science and Technology, Nanjing, China;bLaboratory of Cloud-Precipitation Physics and Severe Storms (LACS), Institute of Atmospheric Physics, Chinese Academy of Sciences, Beijing, China
The characteristics and infuence of the dynamical, thermal, and microphysical processes of a squall line are studied using the WRF model. This squall line occurred in the Yangtze and Huaihe river basins in Anhui Province on 5 July 2013. The active cold pool and the downdraft caused by the rear infow contribute to the development of the squall line. The cold pool develops strongly, moves ahead of the storm, and then cuts of the supply of the warm air to the updraft, leading to the storm’s demise. Analysis of the microphysics budget shows that snow crystals contribute to the rainfall rate most during the evolution of the squall line. The heating efect is predominant at the high level,whereas cooling plays an important role at the low level. A typical stratifed ‘seeder-feeder’ structure of the cloud exists primarily in the convective region of the squall line. The heights of the cloud ice and snow layers decrease continuously with time, and both the seeder and feeder cloud decrease dramatically in the dissipation stage, which leads to the reduced rainfall rate.
ARTICLE HISTORY
Revised 6 April 2016
Accepted 16 May 2016
Cold pool; microphysics;physical mechanism; squall line
颮線是一種活躍的中尺度強對流系統。通過使用WRF模式模擬再現颮線過程,研究發現冷池與后向入流的相互作用在颮線成熟時期和衰亡時期很關鍵。云微物理過程在這次颮線發生發展過程也起到了重要的作用,雪粒子對颮線過程的降雨率貢獻最大。凝結潛熱加熱作用主要發生在高層,由水汽凝華成雪,水汽凝華成冰晶主導;凝結潛熱冷卻作用集中在低層,主要包括云滴蒸發,雨水蒸發和霰的融化過程。研究還發現了在颮線中也存在“播種-供給”云,云內存在著冰、雪粒子從高層向下的“播種”過程,而云水提供“供給”增長條件。
1. Introduction
A squall line is a linear or quasi-linear convective system consisting of active thunderstorms that bring disastrous weather, such as strong wind, hail, heavy rain, and sometimes even tornadoes. In addition, its horizontal scale can extend to several hundreds of kilometers. Thus, the infuence of severe weather caused by squall lines cannot be ignored. For example, a squall line oriented in the northeast-southwest direction propagated eastward during 29-30 April 2005 across Texas, Missouri, Arkansas,Louisiana, Kentucky, Tennessee, Mississippi, Alabama, and Georgia, causing large hailstones, wind damage, and 12 tornadoes, mostly in Mississippi and Alabama (Karan et al. 2010). In China, a squall line that occurred over the Yellow and Huaihe river basins on 3 June 2009 brought strong winds (around 29.1 m s-1), hail, and short-term rainstorms in many provinces; the event resulted in 27 deaths and economic losses of around 2 billion yuan (Zhang, Ding, and Huang 2012). Given the severity of the convective weather that they bring, as well as the resulting socioeconomic impacts, research on squall lines is an important topic in meteorology.
It has been found that interaction between the lowlevel ambient shear and surface cold-air pool of squall lines is a basic mechanism for squall-line enhancement and evolution (Robe and Emanuel 2001; Takemi 2007,2014). Rotunno, Klemp, and Weisman (1988, 2004) proposed the famous Rotunno-Klemp-Weisman theory,which describes the deepest leading edge lifting and most efective convective retriggering occurring when the circulation associated with the storm-generated cold pool and the circulation associated with the ambient shear are in near balance. Bryan, Knievel, and Parker (2006) indicated that the intensity of a squall line’s cold pool and the low- to mid-level environmental vertical wind shear are the two primary factors afecting squall-line structure. Thecold pool plays a very important role in the life cycle and dynamics of a severe storm. However, if the cold pool is strong enough, it may quickly move ahead of the thunderstorm and cut of the supply of warm air to the updraft,leading to the thunderstorm’s demise (Engerer, Stensrud,and Coniglio 2008).
The rear infow jet is another essential factor in the evolution of a squall line. Weisman (1992) indicated that an elevated rear-infow jet promotes the regeneration of strong, upright convective cells along the leading edge of the cold pool, whereas a lower rear-infow jet trend to weaken the system. The rear infow can be induced or enhanced by bookend vortices- a pair of midlevel counter rotating vortices that usually appear at each end of the bow-shaped line segment behind the leading edge of active convection, with a dimension of tens of kilometers at mid-level (3-7 km) (Weisman 1993; Atkins et al. 2004).
Recent studies show that cloud microphysical processes are signifcant for the development and evolution of squall lines. A faster falling speed means less time for melting and evaporation, and thus reduced cooling rates and a weaker cold pool, and a correspondingly slower system (Adams-Selin, van den Heever, and Johnson 2013). Yang, Xiao, and Guo (2015) presented conceptual models of the distribution of the airfow feld, cloud microphysical structure, and precipitation area, during various development stages.
In summary, observation- and simulation-based studies on the development and evolution of squall lines have brought about remarkable scientifc progress and understanding. However, studies of squall lines in China have tended to focus more on the large-scale circulation situation and mesoscale structure characteristics of the squall line (Ding et al. 1982; Cai, Li, and Li 1988; He, Lu, and Zhang 1992; Lu and Yang 2004; Ma et al. 2010), as compared with similar research conducted by scientists in other countries. Furthermore, owing to their short life span, small scale,rapid development and irregular distribution characteristics, a number of difculties remain for the real-time simulation and prediction of squall lines.
In the present study, high resolution data are assimilated in the three-dimensional variational (3DVAR) assimilation system of the nonhydrostatic mesoscale WRF model to simulate and analyze the characteristics of a squall line that occurred over the Yangtze and Huaihe river basins in Anhui Province on 5 July 2013. The squall line brought strong thunder and lightning, wind and heavy rainstorms,causing extensive economic losses. The aim of this paper is to reveal the characteristics of the squall line’s evolution in East China, as well as explore the mechanisms of infuence of the dynamical, thermal, and microphysical processes during its development. Our hope in conducting this study is that the fndings will make a signifcant contribution to the scientifc understanding of squall lines in East China.
2. Data and simulation design
The data used in this study include conventional aerological sounding data and ground data of the China Meteorological Administration, hourly rainfall combined from Chinese automatic station and CMORPH rainfall products, NCEP GFS reanalysis data, and empirical observation data (radar, wind profle etc.) of the National Basic Research Program of China.
The model employed is the WRF model, version 3.1.1,developed by NCEP-NCAR. The initial and lateral boundary conditions are from the NCEP GFS reanalysis and forecast felds on a 0.5 × 0.5 grid and at a temporal resolution of every 3 h. Two-way nesting is used for all the simulations conducted in this study. The horizontal grid resolution of the outer domain (Domain 1) is 9 km (187 × 100 grid points), while that of the inner domain (Domain 2)is 3 km (481 × 223 grid points). The domain is centered at (31°N, 117°E) and there are a total of 28 vertical levels with variable grid spacing employed in the simulation. The Morrison two-moment scheme is chosen as the microphysics scheme; the Kain-Fritsch scheme is chosen as the cumulus parameterization in Domain 1 only; the Yonsei University scheme is applied as the planetary boundary layer parameterization; and the model also includes the Dudhia shortwave radiation scheme. The simulation period is 15 h from 1200 UTC 5 July 2013 to 0300 UTC 6 July 2013. Using hourly circulation assimilation, the radar data from Anqing, Nanjing, and Hefei are assimilated using WRF-3DVAR, which begins at 1400 UTC 5 July 2013. The data come from the National Basic Research Program of China. The simulated result of Domain 2 is analyzed in this study.
3. Results
3.1. Observation and simulation of the squall line
At 0000 UTC 5 July, the squall line was located in front of a long trough at 500 hPa (fgure omitted). The warm air and adequate moisture were supplied by the low-level jet stream, with wind speed greater than 15 m s-1, and the high level jet moved southwards concurrently. The cold air moved southeast and met with the warm and moist air over the Yangtze and Huaihe river basins, ofering favorable thermodynamic and dynamically unstable conditions for the development of the squall line. The lowlevel wind shear generated gradually, which ofered the dynamic conditions necessary for convection. The case canbe categorized as a ‘pre-long-trough pattern’ (Meng, Yan,and Zhang 2013). A quasi-stationary front extended from central Hubei Province to the south of Jiangsu Province stably. The relative humidity in the warm region ahead of the front reached 90% and above. During 1200-1800 UTC 5 July 2013, there was a low pressure center moving along the quasi-stationary front, and the convergence strengthened gradually, favorable for triggering the squall line.
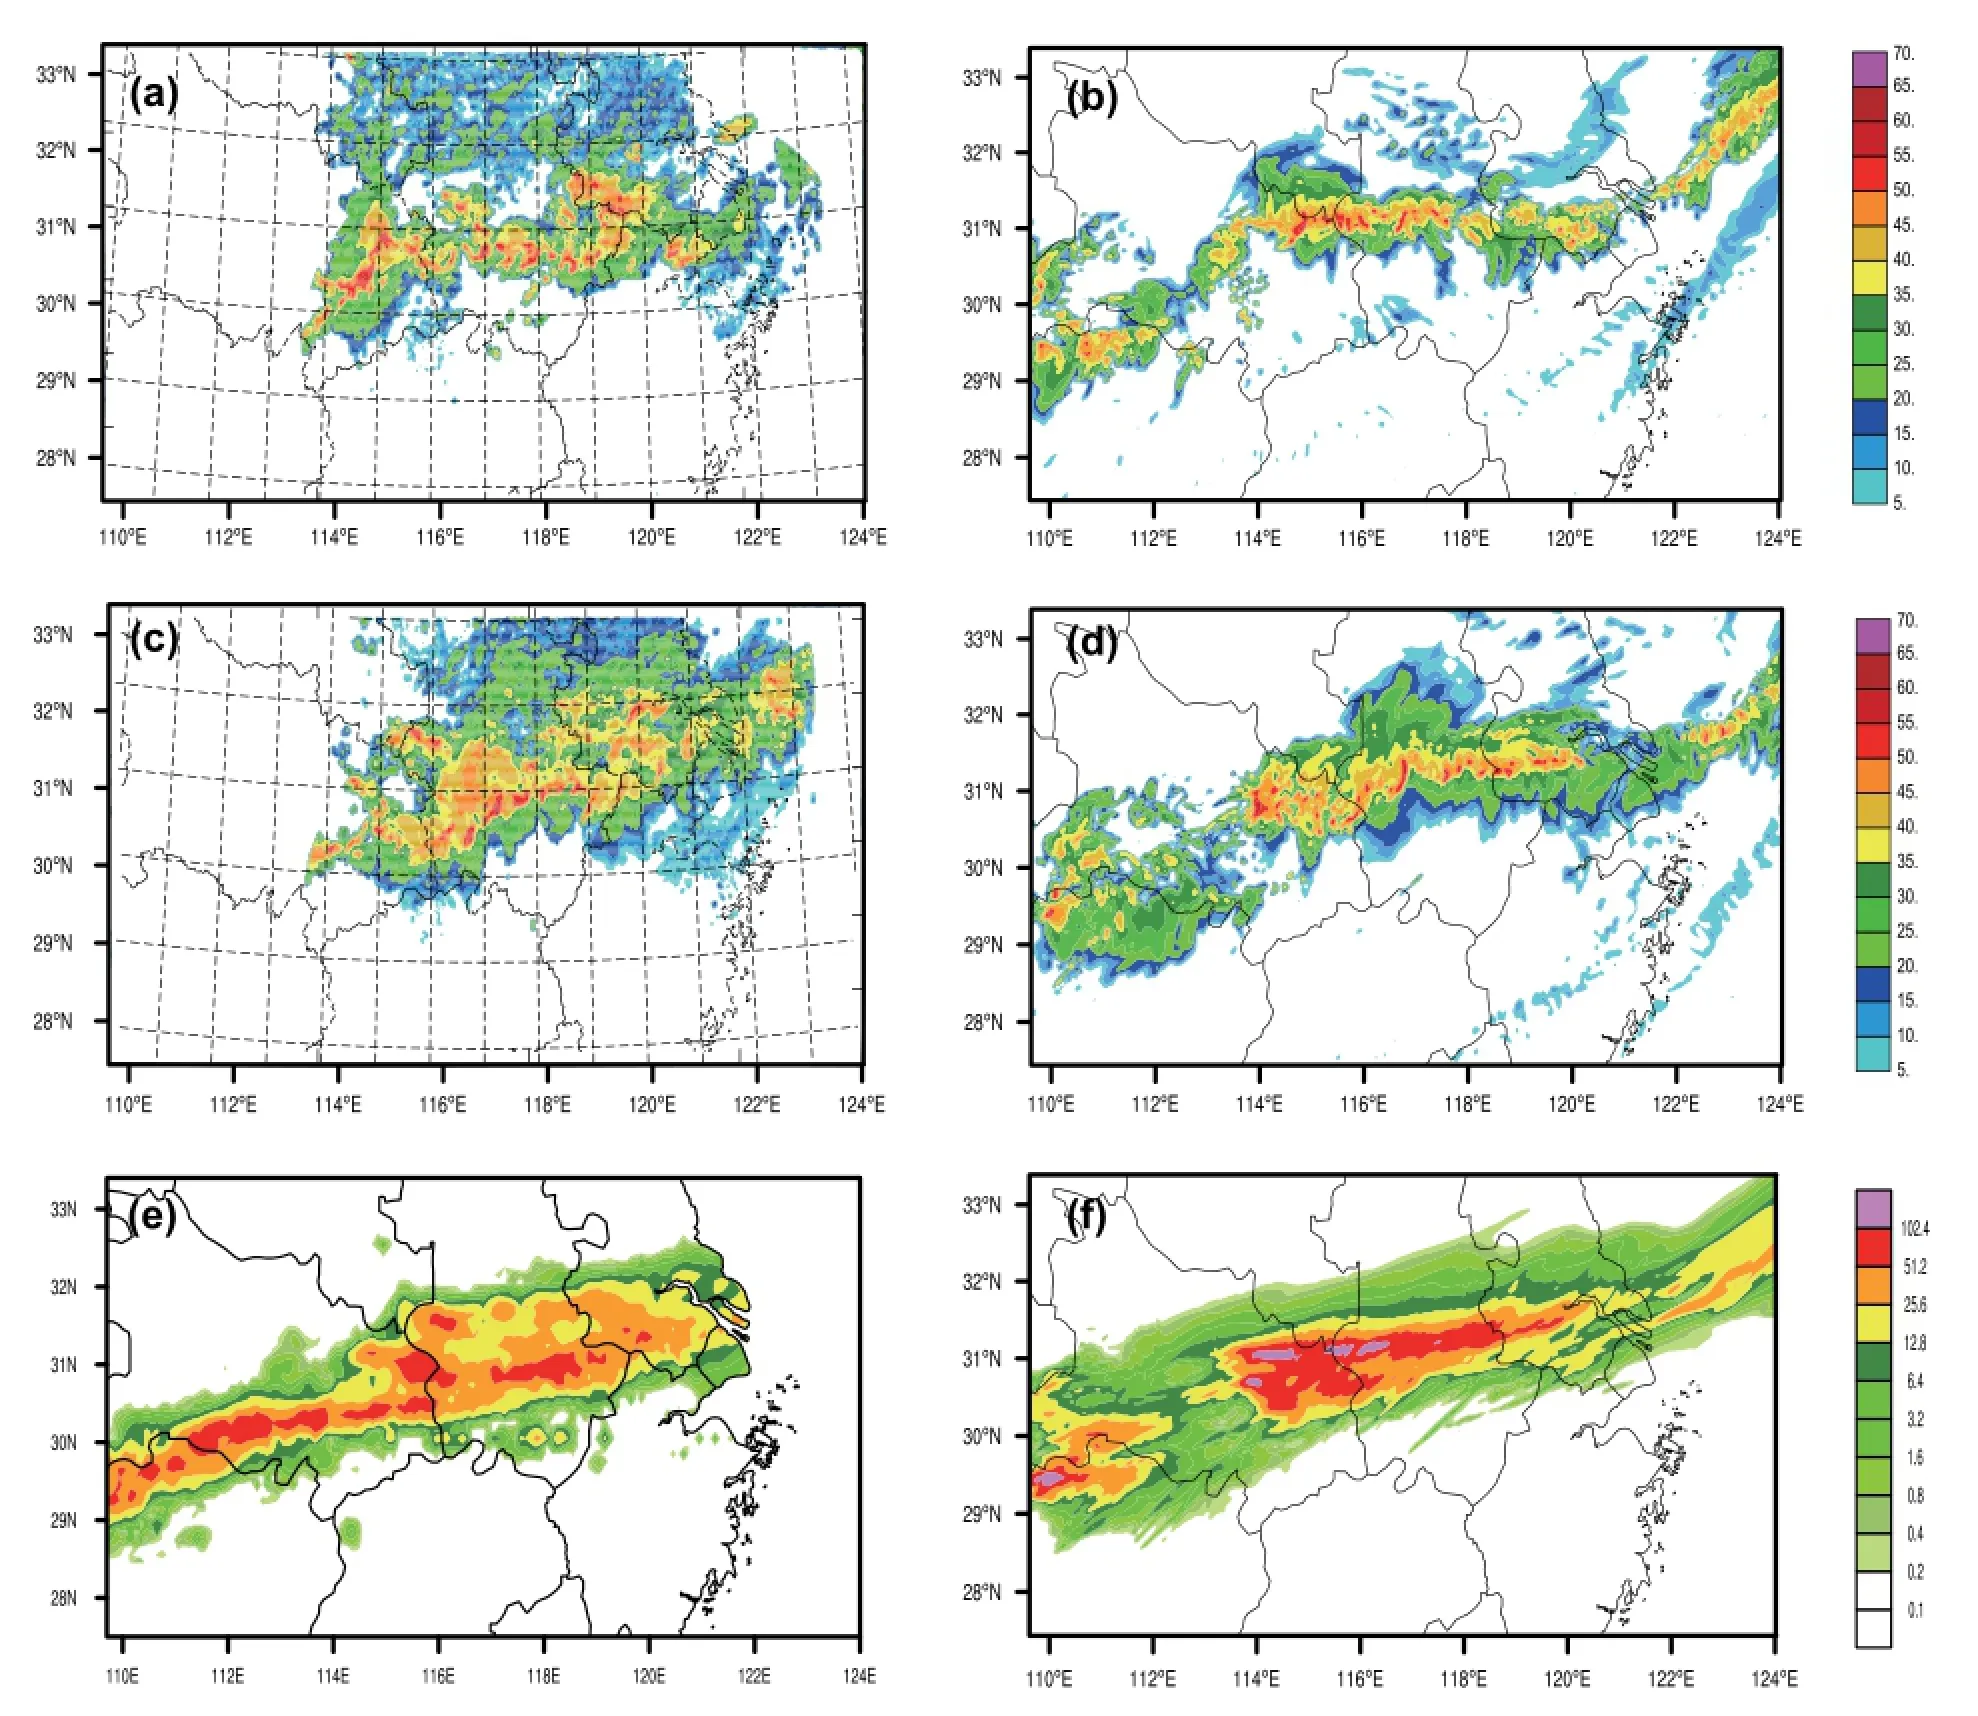
Figure 1.Observed radar refectivity (units: dBZ) at (a) 1624 UTC 5 July 2013 and (c) 2000 UTC 5 July 2013. Simulated radar refectivity(units: dBZ) at (b) 1720 UTC 5 July 2013 and (d) 2010 UTC 5 July 2013 (e) Observed and (f) simulated six-hour (1800-0000 UTC5 July 2013)accumulated precipitation (units: mm).
Based on the mosaic of radar refectivity composited by several S- and C-band Doppler radars, the squall line originated from scattered clouds in southwestern Anhui Province along a quasi-stationary front. Individual convective cells merged into a linear structure at around 1536 UTC 5 July 2013, with the moving direction of the squall line towards the east. The squall line moved from southwest to northeast at around 1912 UTC 5 July 2013, before moving from northwest to southeast at around 2036 UTC 5 July 2013. The maximum radar refectivity of the mature squall line was greater than 55 dBZ at 2010 UTC 5 July 2013. The squall line started to dissipate at around 2224 UTC 5 July 2013.
The distribution of simulated radar refectivity is consistent with the observed radar refectivity (Figure 1). The simulated refectivity is more than 55 dBZ in the mature stage, and the location is somewhat northwest compared with the observed radar refectivity. This squall line belongs to the ‘trailing strigiform’ type. Analogously, the direction of the simulated rainband is parallel to the observed rainband in spite of the northward location. Although there is a time-lag, our main interest in this study is the characteristics of the squall line’s evolution, rather than achieving an exact prediction; therefore, such timing and positioning errors are considered tolerable. The simulation results are suitable for further research.
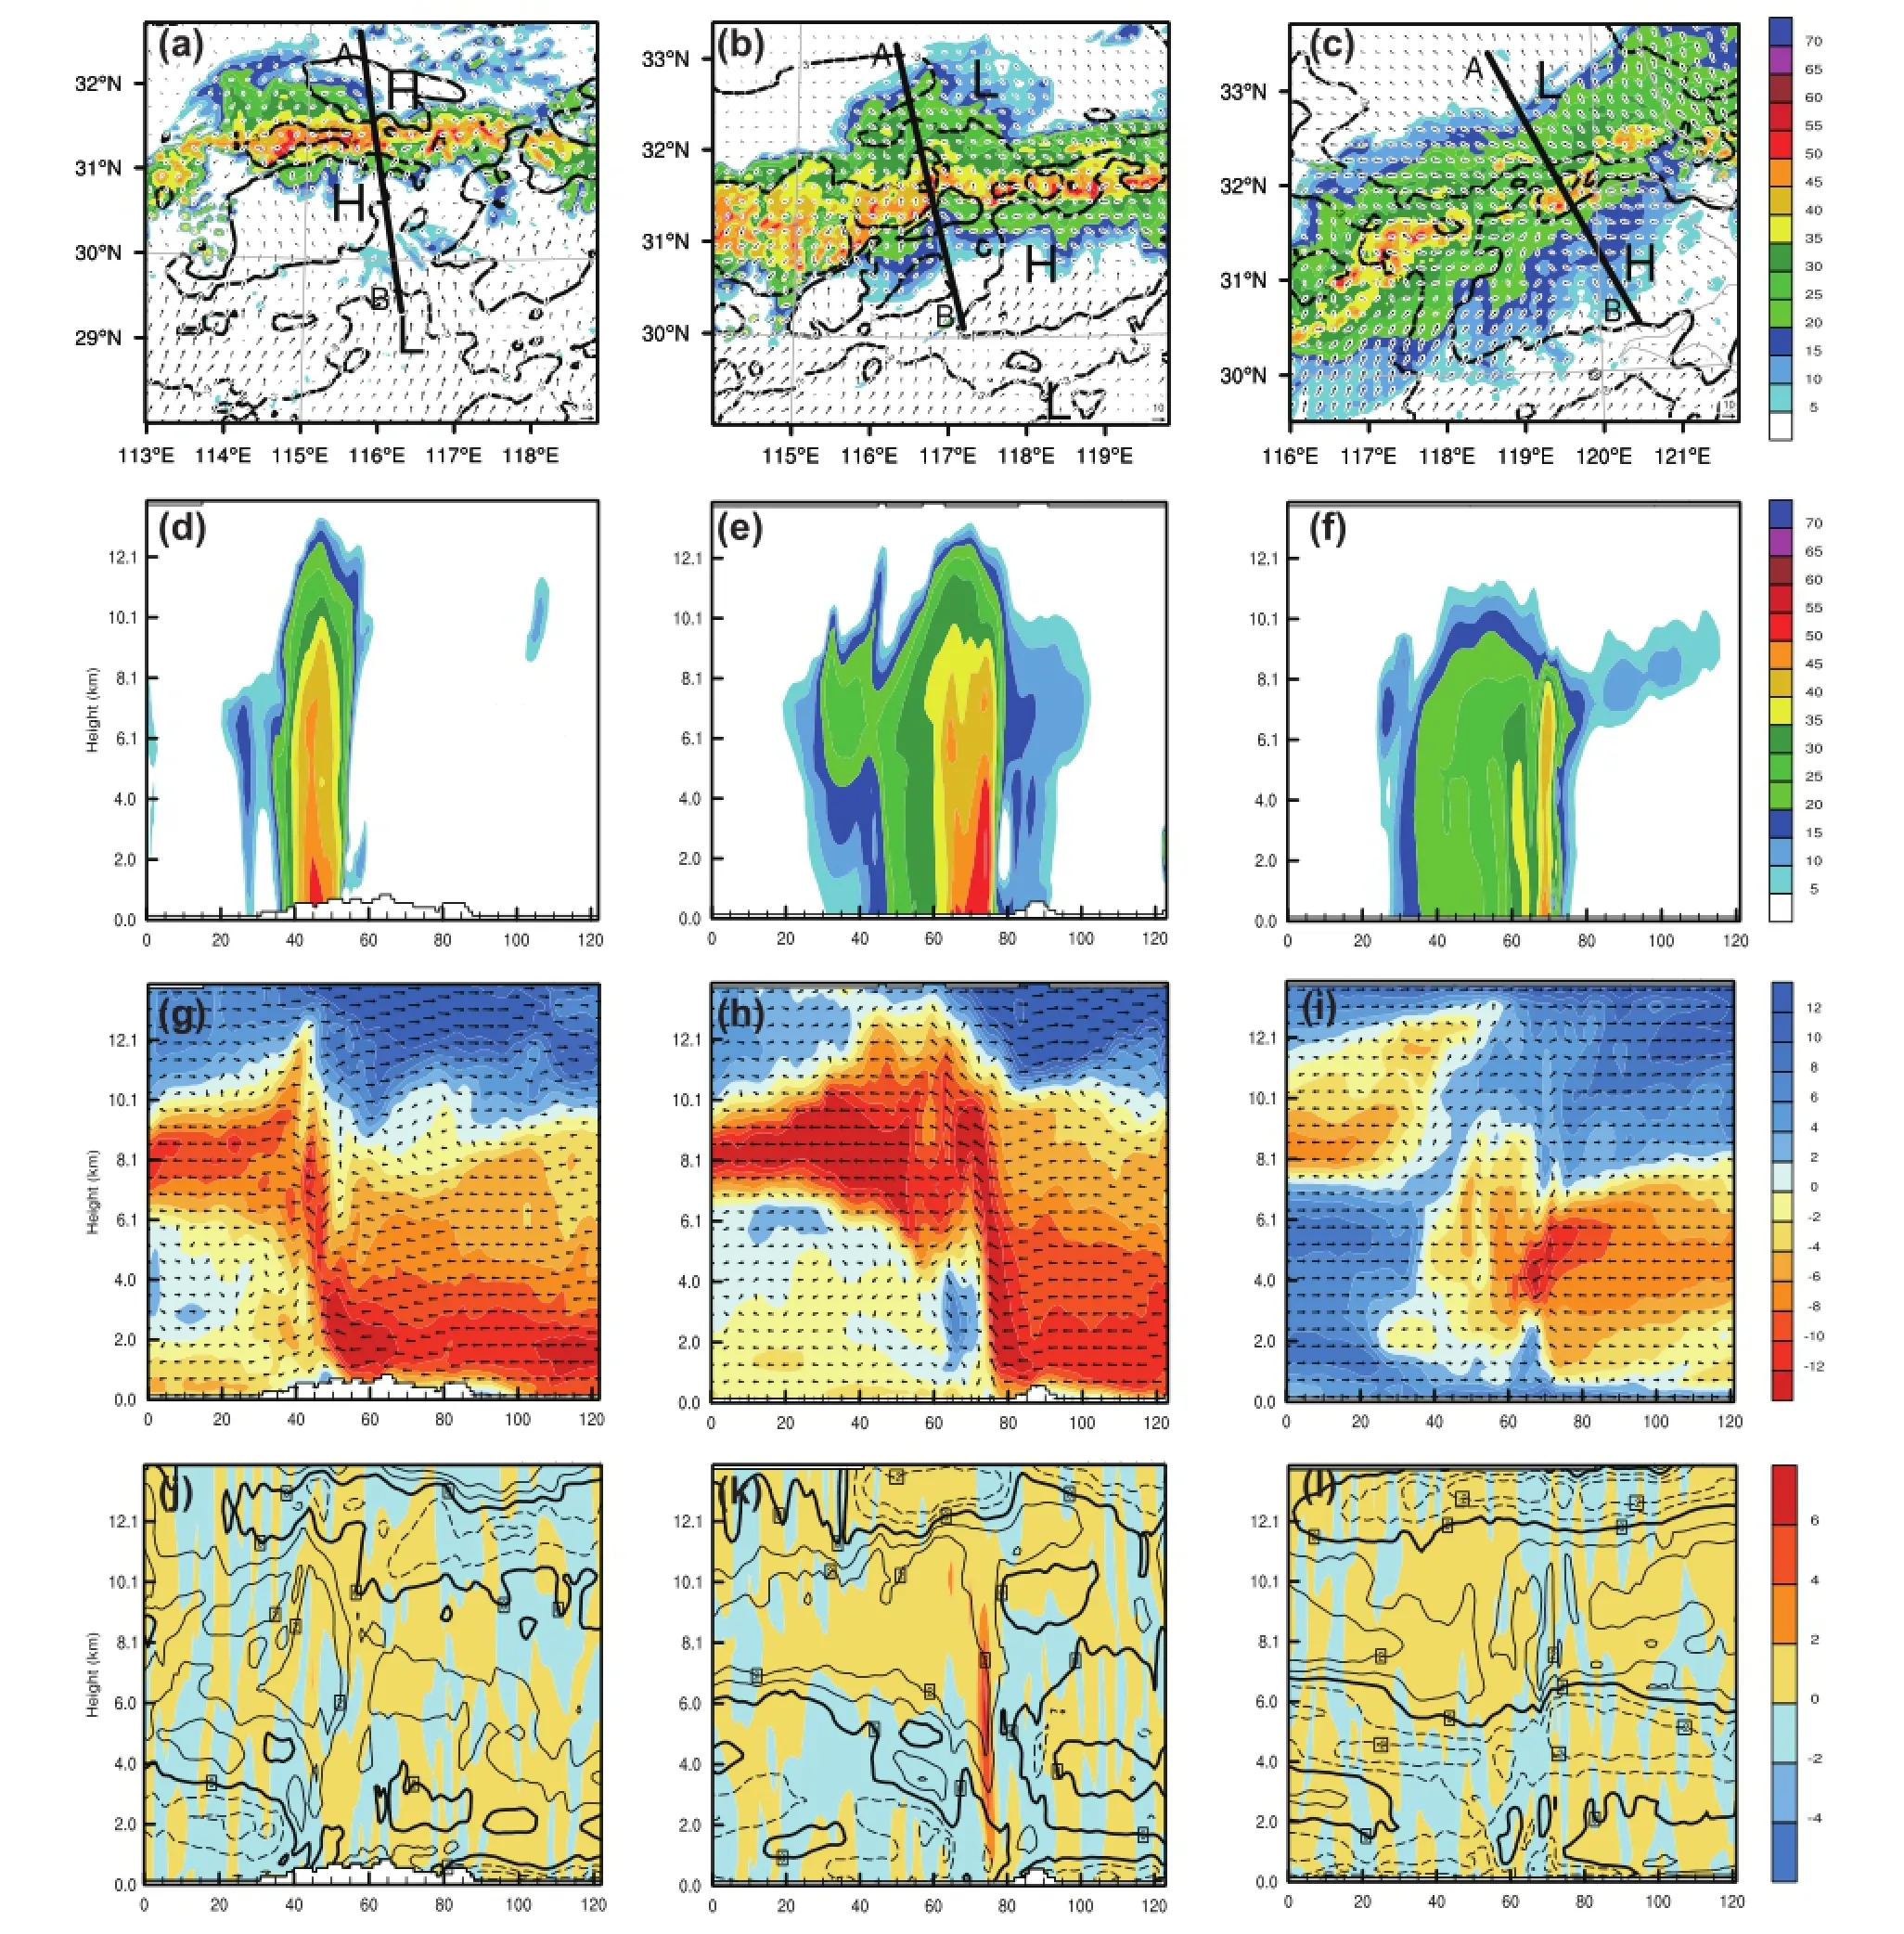
Figure 2.Radar refectivity (units: dBZ), perturbation pressure (units: hPa) at 850 hPa, and the surface wind feld (units: m s-1) (shading shows the radar refectivity; contours indicate the perturbation pressure (solid for 1 hPa and dashed for -3 hPa); and the arrows represent the surface wind feld) at (a) 1720 UTC 5 July 2013 (b) 2010 UTC 5 July 2013 and (c) 0220 UTC 5 July 2013. Vertical cross sections along the line AB, shown in panels (a-c), for (d-f) radar refectivity (units: dBZ), (g-i) the airfow feld (shading shows the horizontal wind speed (units: m s-1), and arrows represent the airfow speed feld (wind vectors projected onto the cross section, units: m s-1)), and(j-l) perturbation potential temperature (units: °C) and vertical velocity (units: m s-1) (shading shows the vertical velocity, and contours indicate the perturbation potential temperature (solid for positive and dashed for negative, every 1 °C)).
3.2. Dynamical and thermal characteristics of the squall line
The dynamical and thermal characteristics of the squall line during diferent stages are analyzed in this section(Figure 2). In the developing stage (see Figure 2(a), (d), (g),and (j) for 1720 UTC), a low pressure system develops in front of the leading edge of the storm, and a high pressure system moves around the leading edge of the storm at the low level. The height of maximum radar refectivity is about 2.0 km. A cold pool appears behind the leading edge of the storm, and the depth of the cold pool is approximately 4.0 km. The maximum lower-middle-level (2-6 km) rearinfow is around 4.0 km in the middle level behind the storm. The low-level rear infow is interrupted by the front infow, and the front infow rises in the convective region,which diverges in the high level, becoming the outfow forward and backward.
In the mature stage (see Figure 2(b), (e), (h), and (k) for 2010 UTC), the low pressure system and the meso-high continue to develop, and a wake low appears behind the leading edge of the storm. This is a typical structure of a mature squall line. The converging updraft is situated mainly at 850 hPa, whereas the divergent airfow occurs in the high level of the troposphere in the mature stage. This confguration is likely conducive to the occurrence of new convection. There are two strong cyclonic vorticity centers, which are consistent with the strong converging updraft at 850 hPa. They are also benefcial to the upward motion and strong convective activities (fgure omitted). The intensive rear infow becomes a downdraft gradually,and then diverges in the leading edge of the storm near the surface; the forward rear infow part converges with the low-level front infow and rise together in the storm. This process promotes the convective activities of the cells. The height of maximum radar refectivity becomes 4.8 km, and maximum velocity appears at heights of around 5.0-7.0 km. The cold pool strengthens too, and has a vertical depth of 6.0 km. Then, a distinct strigiform region appears. With the development of the squall line,the updraft zone above the front of the cold pool tends to tilt rearward. The rearward-tilted updraft results in a mid-level pressure defcit above the negatively buoyant cold pool and beneath the positively buoyant updraft. The mid-level pressure defcit results in a forward acceleration of air from the rear of the convective system, resulting in the intensive rear infow (Weisman 1992; Yang, Xiao, and Guo 2015). Then, the stronger rear infow transports the dry air to the downdraft, which leads to an improvement in the evaporation, ultimately causing the stronger cold pool.
In the dissipation stage (see Figure 2(c), (f), (i), and (l)for 0220 UTC), the meso-high develops before the leading edge of the storm, and the wake low moves behind the meso-high. The strigiform region dominates in the squall line, and the convection weakens signifcantly. Conversely,the cold pool strengthens considerably, with a vertical depth of about 7.0 km. The cold pool is so strong that it moves ahead of the storm and cuts of the supply of warm air to the updraft, leading to the storm’s demise (Engerer,Stensrud, and Coniglio 2008).
3.3. Microphysical characteristics of the squall line The latent heat of the phase transition between the cloud microphysical particles can heat and cool the air, thus afecting the dynamic processes of the squall line. Heating processes generally include condensation, freezing, and desublimation; while cooling processes incorporate evaporation, melting, and sublimation. Using the heating and cooling rate calculations in Hjelmfelt et al. (1989) as a reference, it is found that both increase to a maximum and then decrease with time. In general, cooling plays an important role in the low level, while heating is the predominant efect in the high level. Several microphysical processes contribute most to the cooling efect, including the evaporation of cloud water, the evaporation of rain,the melting of graupel into rainwater, and the sublimation of snow into water vapor. Meanwhile, the heating efect mainly comes from the condensation of water vapor into snow, and the condensation of water vapor into cloud ice(Figure 3(b)).
Figure 3(a) shows the mixing ratios of hydrometeors during diferent stages, demonstrating that the variation of the mixing ratio of snow is consistent with the intensity change of the rainfall rate. The mixing rates of cloud and cloud ice increase rapidly during the initial stage. In the developing stage, the mixing of snow, graupel, and rain maintain a rapid growth rate. The maximum mixing ratio of cloud ice has a vertical height of 12 km, while snow concentrates at 7.5 km and graupel is in the layer beneath the snow. The snow and graupel particles mainly come from the transformation of cloud ice, and it is cold cloud processes that dominate in the developing stage (Figure 3(a) and (c)).
During the mature stage, the mixing ratio of rain increases to a maximum of about 0.9 g kg-1at 2100 UTC,and the maximum mixing ratio of snow is 1.3 g kg-1at 2300 UTC. However, the mixing ratio of the cloud changes little with time. It is clear that the ice crystal layer decreases in height with time, as do the heights of the snow and graupel. The cloud ice continues to transform into snow and graupel. Rainwater comes from both the transformation of cloud and the melting of snow, and graupel falls to the warm sector. The low-level water vapor is transported to higher levels by the strong updraft; moreover, the energy of upward motion is provided by the latent heat of the condensation of water vapor (Figure 3(a) and (d)).
During the dissipation stage, the mixing ratios of snow and graupel decrease dramatically, and cloud water reduces slowly. However, the cloud ice increases continuously with time. The total quantity of both seeder and feeder cloud decreases relative to those in the mature stage. The heights of the cloud ice layer and snow layer continue to decrease (Figure 3(a) and (e)). The maximum descending rate appears in the cloud ice layer (Figure 2(l)),the dragging force of which leads to the strong downdraft.
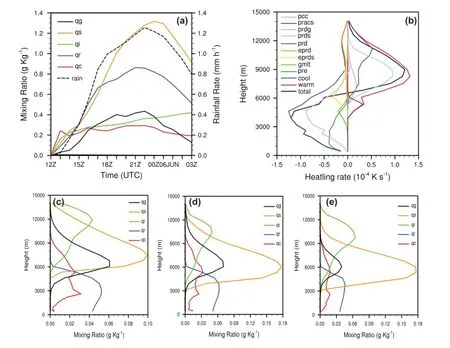
Figure 3.(a) Temporal evolution of area-averaged hydrometeor mixing ratio (solid lines; units: g kg-1) and rainfall rate (dashed line; units: mm h-1). (b) Vertical distribution of the time-averaged latent heating rate (units: 10-4K s-1), the variable ‘pcc’ is the evaporation of cloud water, ‘pracs’ is the collection of rainwater by graupel, ‘prdg’ is the desublimation of graupel, ‘prds’ is the condensation of water vapor into snow, ‘prd’ is the condensation of water vapor into cloud ice, ‘pre’ is the evaporation of rainwater, ‘eprd’ is the sublimation of cloud ice, ‘eprds’ is the sublimation of snow into water vapor, ‘gmlt’ is the melting of graupel into rainwater, ‘cool’ is the total cooling rate, ‘warm’is the total warming rate, and ‘total’ is the net heating rate. (c-e) Vertical distribution of area-averaged hydrometeor mixing ratio (units: g kg-1) at 1720 UTC 5 July 2013 (d) 2010 UTC 5 July 2013, and (e) 0220 UTC 5 July 2013 respectively.
In short, this case features a typical stratifed ‘seederfeeder’ structure of the cloud. The ice crystal layer is located in the high level; there is a snow layer beneath the ice crystal layer and above the mixed ice-water layer consisting of graupel and supercooled water; and the liquid water consisting of cloud water and rainwater is situated in the warm region beneath 0 °C. During the dissipation stage,the rainfall rate starts to decrease with the reduction of seeder and feeder cloud.
4. Summary
This study utilizes the WRF model to simulate a squall line that occurred in the Yangtze and Huaihe river basins in Anhui Province on 5 July 2013. The main conclusions can be summarized as follows:
The model-simulated results capture the observed characteristics of the squall line’s evolution well. The confguration of the divergence and vertical vorticities is likely benefcial to the strong convective activities. The cold pool plays a very important role in the development and evolution of the squall line. The intensive cold pool and the downdraft caused by the rear infow contribute to the development of the squall line. However, the cold pool is so strong that it moves ahead of the storm and cuts of the supply of warm air to the updraft in the dissipation stage,leading to the storm’s demise.
A typical stratified ‘seeder-feeder’ structure of the cloud is found. The height of the ice crystal layer and snow crystal layer continue to decrease with time. The snow and graupel particles mainly come from the transformation of cloud ice, and it is cold cloud processes that dominate in the developing stage. Rainwater comes from both the transformation of cloud and the melting of snow, and graupel falls to the warm sector,in the mature stage. The rainfall rate starts to decrease with the reduction of feeder and seeder cloud in the dissipation stage, and the dragging force of increased cloud ice leads to the strong downdraft.
Cooling plays an important role in the low level, while heating is the predominant efect in the high level. The evaporation of cloud water, the evaporation of rain, the melting of graupel into rainwater, and the sublimation of snow into water vapor contribute most to the cooling efect. The heating efect, meanwhile, mainly comes from the condensation of water vapor into snow, and the condensation of water vapor into cloud ice.
This paper represents a preliminary study of the spatiotemporal characteristics and mechanisms of infuence of the dynamical, thermal, and microphysical processes during the evolution of a squall line that occurred in East China. One of the limitations of the present results is the lack of ambient wind shear infuence, and the results should be validated using more study cases. Future work will establish more clearly and comprehensively the mechanisms of infuence of these processes in the evolution of such convective systems.
Acknowledgements
We appreciate the valuable comments provided by the anonymous reviewers.
Disclosure statement
No potential confict of interest was reported by the authors.
Funding
This study was supported by the National Basic Research Program of China [grant numbers 2013CB430100, 2015CB453201];the National Natural Science Foundation of China [grant numbers 41375058, 41530427].
References
Adams-Selin, R. D., S. C. van den Heever, and R. H. Johnson. 2013.“Impact of Graupel Parameterization Schemes on Idealized Bow Echo Simulations.” Monthly Weather Review 141: 1241-1262.
Atkins, N. T., J. M. Arnott, R. W. Przybylinski, R. A. Wolf, and B. D. Ketcham. 2004. “Vortex Structure and Evolution within Bow Echoes. Part I: Single-Doppler and Damage Analysis of the 29 June 1998 Derecho.” Monthly Weather Review 132: 2224-2242.
Bryan, G. H., J. C. Knievel, and M. D. Parker. 2006. “A Multimodel Assessment of RKW Theory’s Relevance to Squall-line Characteristics.” Monthly Weather Review 134: 2772-2792.
Cai, Z., H. Li, and H. Li. 1988. “The Structure and Evolution Characteristics of Squall Line in North China.” Journal of the Atmospheric Sciences 12 (2): 191-199.
Ding, Y., H. Li, M. Zhang, J. Li, and Z. Cai. 1982. “A Study on the Genesis Conditions of Squall-line in China.” Journal of the Atmospheric Sciences 6 (1): 18-27.
Engerer, N. A., D. J. Stensrud, and M. C. Coniglio. 2008. “Surface Characteristics of Observed Cold Pools.” Monthly Weather Review 136: 4839-4849.
He, Q., H. Lu, and M. Zhang. 1992. “A Mesoscale Study of Squall Line in Warm Sector of Jiang-Huai Area.” Acta Meteorologica Sinica 50 (3): 290-300.
Hjelmfelt, M. R., R. D. Roberts, H. D. Orville, J. P. Chen, and F. J. Kopp. 1989. “Observational and Numerical Study of a Microburst Line-producing Storm.” Journal of the Atmospheric Sciences 46: 2731-2744.
Karan, H., P. J. Fitzpatrick, C. M. Hill, Y. Li, Q. Xiao, and E. Lim. 2010.“The Formation of Multiple Squall Lines and the Impacts of WSR-88D Radial Winds in a WRF Simulation.” Weather and Forecasting 25: 242-262.
Lu, H., and G. Yang. 2004. The Mesoscale Synoptic Principle and Forecast[M], 106. Beijing: China Meteorological Press.
Ma, H, Y. Hu, X. Zheng, and Y. Han. 2010. “The Mesoscale Confguration Characteristics of a Squall Line Happened in the Northeast of Yunnan Province.” Scientia Meteorologica Sinica. 30 (6): 874-880.
Meng, Z., D. Yan, and Y. Zhang. 2013. “General Features of Squall Lines in East China.” Monthly Weather Review 141: 1629-1647. Robe, F. R., and K. A. Emanuel. 2001. “The Efect of Vertical Wind Shear on Radiative-Convective Equilibrium States.” Journal of the Atmospheric Sciences 58: 1427-1445.
Rotunno, R., J. B. Klemp, and M. L. Weisman. 1988. “A Theory for Strong, Long-lived Squall Lines.” Journal of the Atmospheric Sciences 45: 463-485.
Rotunno, R., J. B. Klemp, and M. L. Weisman. 2004. “A Theory for Strong, Long-lived Squall Lines.” Journal of the Atmospheric Sciences 61: 361-382.
Takemi, T. 2007. “A Sensitivity of Squall Line Intensity to Environmental Static Stability under Various Shear and Moisture Conditions.” Atmospheric Research 84: 374-389.
Takemi, T. 2014. “Convection and Precipitation under Various Stability and Shear Conditions: Squall Lines in Tropical versus Midlatitude Environment.” Atmospheric Research 142: 111-123.
Weisman, M. L. 1992. “The Role of Convectively Generated Rear-inflow Jets in the Evolution of Long-lived Mesoconvective Systems.” Journal of the Atmospheric Sciences 49: 1826-1847.
Weisman, M. L. 1993. “The Genesis of Severe, Long-lived Bow Echoes.” Journal of the Atmospheric Sciences 50: 645-670.
Yang, H., H. Xiao, and C.-W. Guo. 2015. “Structure and Evolution of a Squall Line in Northern China: A Case Study.” Atmospheric Research 158: 139-157.
Zhang, Y., Z. Ding, and X. Huang. 2012. “Analysis on Formation Reason of a Squall Line Weather in the Yellow River and Huaihe River Basins.” [in Chinese.] Journal of Anhui Agricultural Sciences 40: 10981-10983.
Erratum
Li, F.-N., J.-B. Song, H.-L. He, S. Li, X. Li, and S.-D. Guan. 2016. “Assessment of surface drag coefcient parametrizations based on observations and simulations using the Weather Research and Forecasting model”. Atmospheric and Oceanic Science Letters 9 (4): 327-336. http://dx.doi.org/10.1080/16742834.2016.1196105.
When the above article was frst published, the symbol ‘π’ was incorrectly replaced by the letter ‘n’ in equations 4c, 6c and within the paragraph containing equation 11.
Taylor & Francis apologises for this error.
? 2016 The Author(s). Published by Informa UK Limited, trading as Taylor & Francis Group.
This is an Open Access article distributed under the terms of the Creative Commons Attribution License (http://creativecommons.org/licenses/by/4.0/), which permits unrestricted use, distribution, and reproduction in any medium, provided the original work is properly cited.
8 December 2015
CONTACT Chun-Sheng Miao csmiao@nuist.edu.cn
? 2016 The Author(s). Published by Informa UK Limited, trading as Taylor & Francis Group.
This is an Open Access article distributed under the terms of the Creative Commons Attribution License (http://creativecommons.org/licenses/by/4.0/), which permits unrestricted use, distribution, and reproduction in any medium, provided the original work is properly cited.
 Atmospheric and Oceanic Science Letters2016年5期
- Atmospheric and Oceanic Science Letters的其它文章
- MJO potential predictability and predictive skill in IAP AGCM 4.1
- Applicability of an eddy covariance system based on a close-path quantumcascade laser spectrometer for measuring nitrous oxide fluxes from subtropical vegetable fields
- Pathways of intraseasonal Kelvin waves in the Indonesian Throughflow regions derived from satellite altimeter observation
- Delving into the relationship between autumn Arctic sea ice and central-eastern Eurasian winter climate
- Freshening biases in the freshwater flux of CORE data
- A weakly coupled data assimilation system of a coupled physical-biological model for the northeastern South China Sea