
Loss prediction of three-level amplified spontaneous emission sources in radiation environment
2022-06-29 08:54:44ShenTan譚深YanLi李彥HaoShiZhang張浩石XiaoWeiWang王曉偉andJingJin金靖
Chinese Physics B 2022年6期
Shen Tan(譚深), Yan Li(李彥), Hao-Shi Zhang(張浩石), Xiao-Wei Wang(王曉偉), and Jing Jin(金靖)
School of Instrument Science and Opto-electronics Engineering,BeiHang University,Beijing 100191,China
Keywords: amplified spontaneous emission (ASE) sources, irradiation effects, model extrapolation, performance prediction
1. Introduction
Amplified spontaneous emission (ASE) sources exhibit excellent properties such as high output power, low thermal sensitivity and broadband spectrum,showing particular advantages on application of high precision fiber-optic gyroscopes(FOGs)and optical fiber sensing systems.[1,2]However,application of ASE sources in space will inevitably suffer from radiation environment.[3,4]These ionizing radiations cause degradation of gain and signal transmission in erbium doped fibers(EDFs), consequently degradation of ASE sources.[5,6]Generally,it is believed that the degradation mainly caused by the creation of color centers (CCs) that are responsible for a socalled radiation-induced attenuation(RIA).[7,8]And there coexist two combined effects:a)pump absorption by CCs which indirectly causes reduction of gain,and b)gain absorption by CCs. Besides, pump-induced bleaching in EDFs should also be in consideration.
A large body of researches have contributed to predict performance of EDFs in harsh environment, either in ASE source or in Er-doped fiber amplifiers (EDFAs).[9]Nevertheless, as suggested earlier the simple passive measurement of RIAs for loss prediction is insufficient,for a big deviation between calculation and measured loss occurred when extrapolating to low dose rate.[10,11]On one hand, RIA difference among the gain band should be taken into consideration for the gain bandwidth of ASE sources is about 40 nm, which means the experiment will be more complicated. On the other hand, passive measurements of RIA are not always adequate for gain prediction of three-level pump system as a result of photon bleaching effects at 980 nm. Then some other approaches were adopted for loss prediction of EDFs. Authors in Refs. [12,13] used RIA at 1310 nm to extrapolate RIA at other wavelengths with a simplified Lorentz tail absorption formula. This method avoids the measurement deviation of RIA induced by photon bleaching of 980 nm. Unfortunately,extrapolation of RIA from 1310 nm to 980 nm may introduce a huge error as color-center absorption coefficient at 1310 nm is three times smaller compared with absorption at 980 nm.
Therefore, we present an active measurement method to evaluate radiation induced power loss at 980 nm and gain band based on three-level ASE sources. It is well known that the RIA is a consequence of the generation and decay of CCs whose absorption bands generally located in the ultraviolet(UV) region. The kinetic response to irradiation dose for a given interrogating wavelength is usually the sum of different contributions from the underlying absorption bands kinetics.It can be described by saturating exponential model, which is powerful for its scalability, flexibility and effectiveness on modeling the dose and dose rate influence on attenuation.[14]A model based on spectrum dependency of RIA is introduced to obtain the spectrum response,reducing the extrapolation error from long wavelength. Then it is possible to predict the losses at pump and signal wavelengths. Besides, there is no report on modeling the radiation induced gain degradation of three-level ASE sources. This paper firstly models the radiation induced loss of gain for three-level ASE sources with the new measurement method.
2. Theory
Radiation creates numbers of CCs in the EDF,which increases the absorption of 980 nm pump and 1550 nm signal.The loss prediction model of three-level ASE sources under irradiation environment can be derived by substitutingα(ν,t)into the original three-level ASE sources output model[15]
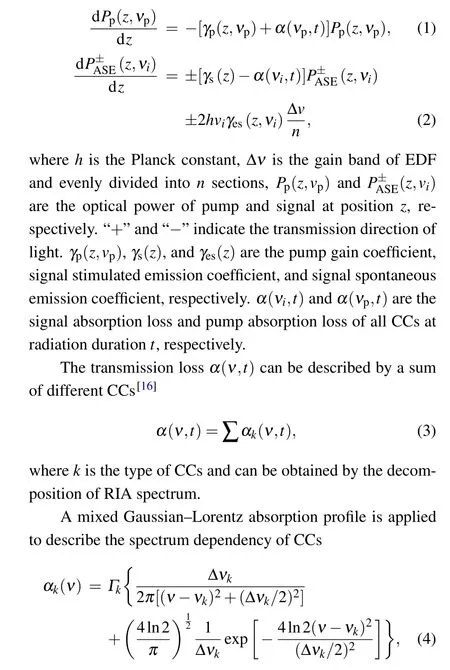
wherevkand Δvkare the characteristic parameters, representing the peak position and full width at half-maximum(FWHW) of thekth color center, respectively, andΓkis the number of thekth color center.
Under irradiation,CCs concentration can be described by differential equation, which takes into account both generation and annealing. Similarly, thekth color center induced absorptionαkcan be described by the following differential equation:[17]

After irradiation,αkrepresents the annealing process,which is proportional to the number of CCs recovery. Therefore,the number ofkth color center recovery can be expressed as
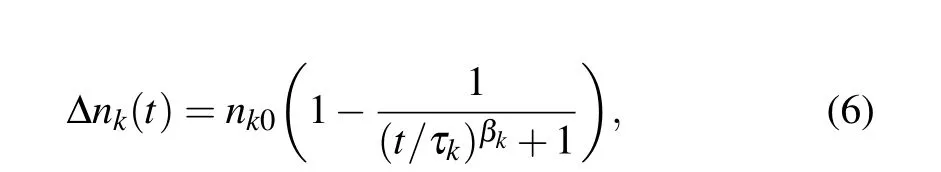
wherenk0and Δnkare the quantity of thekth color center at initial time and timet, respectively. These values ofβkandτkcan be acquired by the fitting of the color center recovery process of the EDF.
Hence,ASE source loss prediction model can be obtained by solving types of CCs in Eq.(3)and every color center generation and annealing parameters in Eq.(5).
3. Experiment
The EDF used in the experiment is doped with aluminum(Al)to avoid concentration quenching due to clustering of the erbium ions,and the main parameters is given in Table 1.
The experiment setup used to measure the loss of gain is shown in Fig. 1. All the testing devices are positioned outside the60Co chamber except for EDF under test,betweenwhich are 16 m single mode (SM) fiber connected by fusion splice. Two groups of the same EDF with a length of 3 m are tested and named as EDF 1 and EDF 2,respectively. The EDF was concentrically spooled into a flat annular geometry with diameter of~20 cm and mounted to a sheet of cardboard,which was placed inside the60Co chamber. EDF 1 was with a dose rate of 30 Gy/min to total dose of 220 Gy. Due to EDF 2 far away from radiation source, it was with a dose rate of 0.8 Gy/min to total dose of 120 Gy.
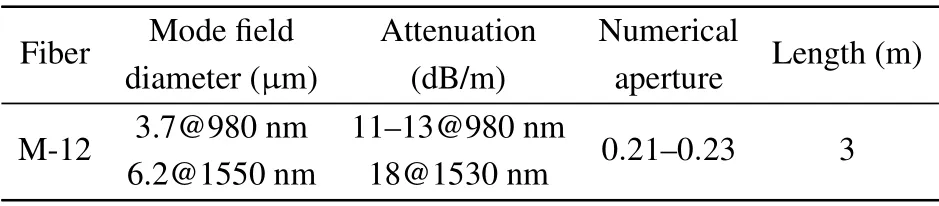
Table 1. The fabricated parameters of EDF.
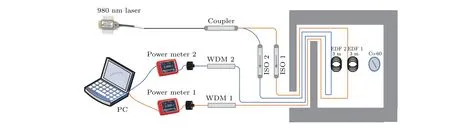
Fig.1. Experimental setup designed for online measurements of the RIA at gain band in EDFs.
The 980 nm laser with a pump power of 50 mW is equally split into two paths by coupler to pump EDF 1 and EDF 2.Isolators (ISO) are used to prevent backward signal light for enhancing the stability of 980 nm laser. Wavelength division multiplexers (WDM) are used to separate the pump and signal. Two power meters connected to computer simultaneously record the power at gain band. EDF 1 is used for modeling.EDF 2 is used for predicting.
4. Results and discussion
4.1. Resolve of radiation induced absorption spectrum
Post-irradiation spectrums of EDF are continuously recorded for seven hours and the measured spectrum is illustrated in Fig.2 and marked by red circles. RIA spectrum and recovery spectrum are decomposed into different components to confirm the species of CCs. Researches have investigated the kind of CCs in EDF, indicating that Al- and Si-related CCs are responsible for RIA in Er–Al doped fibers.[19]And the profile of CCs are assumed to be Gaussian shapes. The fitting result with Gaussian shape shows a good consistence with measurement absorption at high energy band but lager errors do exist in low energy bands such as NIR and IR.In this paper,a solution combining the Gaussian and Lorentzian line shapes are acquired to resolve RIA and recovery spectrum.
And then the RIA spectrum is well reproduced by three kinds of CCs. The results and fitted parameters of CCs are shown in Fig.2 and Table 2,respectively.
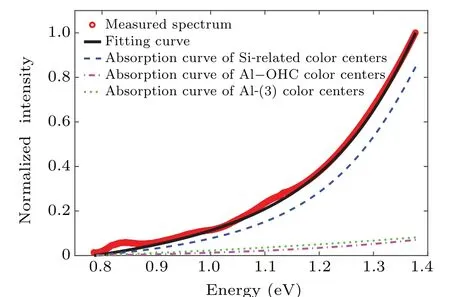
Fig.2.The Gaussian and Lorentz reproduction of RIA absorption bands of EDF at the dose rate of 30 Gy/min in the near-infrared region.
As the peak position parametersvkand FWHW Δvkof CCs had been determined,the spectrum dependency parameterak(v)of CCs could be figured out by Eq.(4).The gain band(1520–1570 nm)is divided into 11 intervals and the values ofak(v)relative to 980 nm are given in Table 3.
It seems the difference over the gain band is not remarkable, and this RIA difference is no more than 0.3 dB in the experiment.
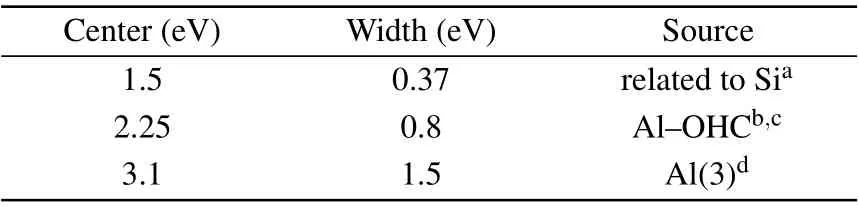
Table 2. Kinds of CCs resolved from RIA spectrum.
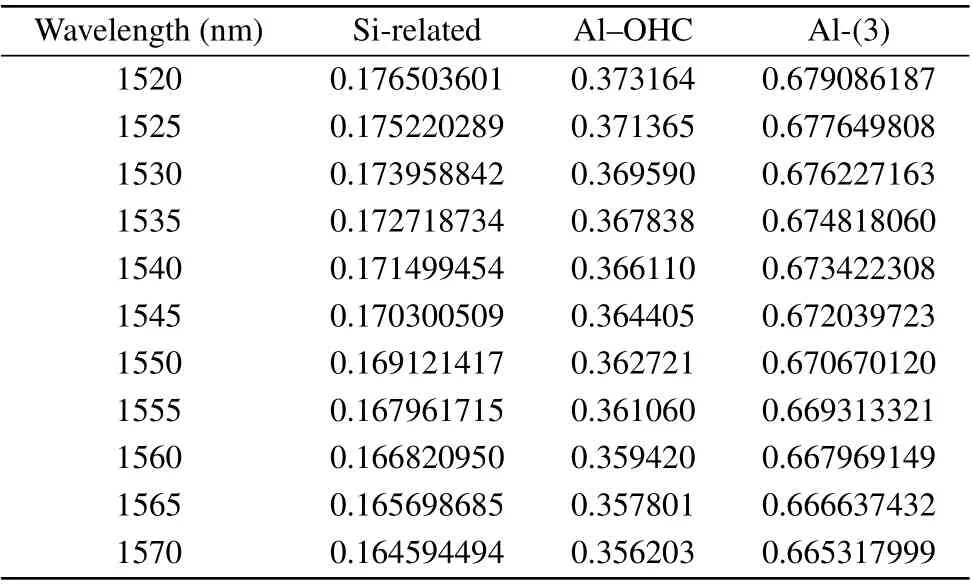
Table 3. The absorption ration between gain band and pump wavelength of Si-related,Al–OHC and Al-(3)CCs.
4.2. The model of recovery processes
Measurements of recovery spectrums are recorded for seven hours after irradiation and given in Fig.3.
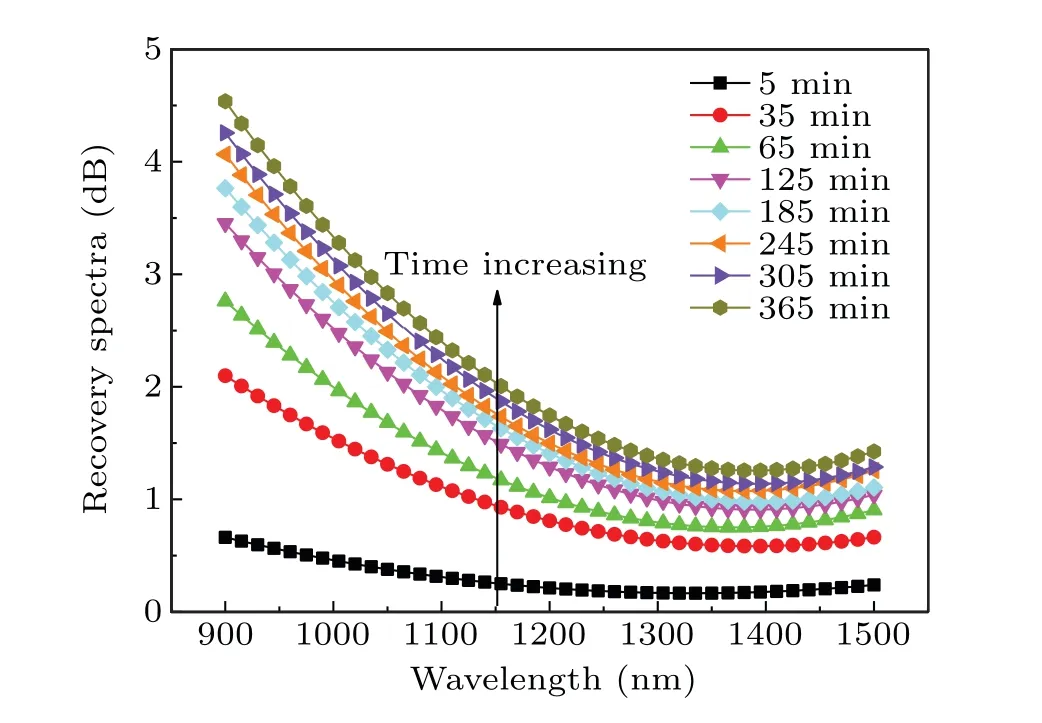
Fig. 3. Continuous spectrum measurements between 900–1500 nm in seven hours.
Then recovery spectrums at different time are resolved respectively,from which recovery process of three kinds CCs are obtained. Then,τkis figured out by fitting the recovery processes of thekth color center with Eq.(6).For comparison,the recovery of CCs is normalized. But the recovery process of Al-(3) color center is failed to model due to its large time constant(τis greater than 109min). And the fitting results of the Si-related and Al–OHC CCs are shown in Fig.4.
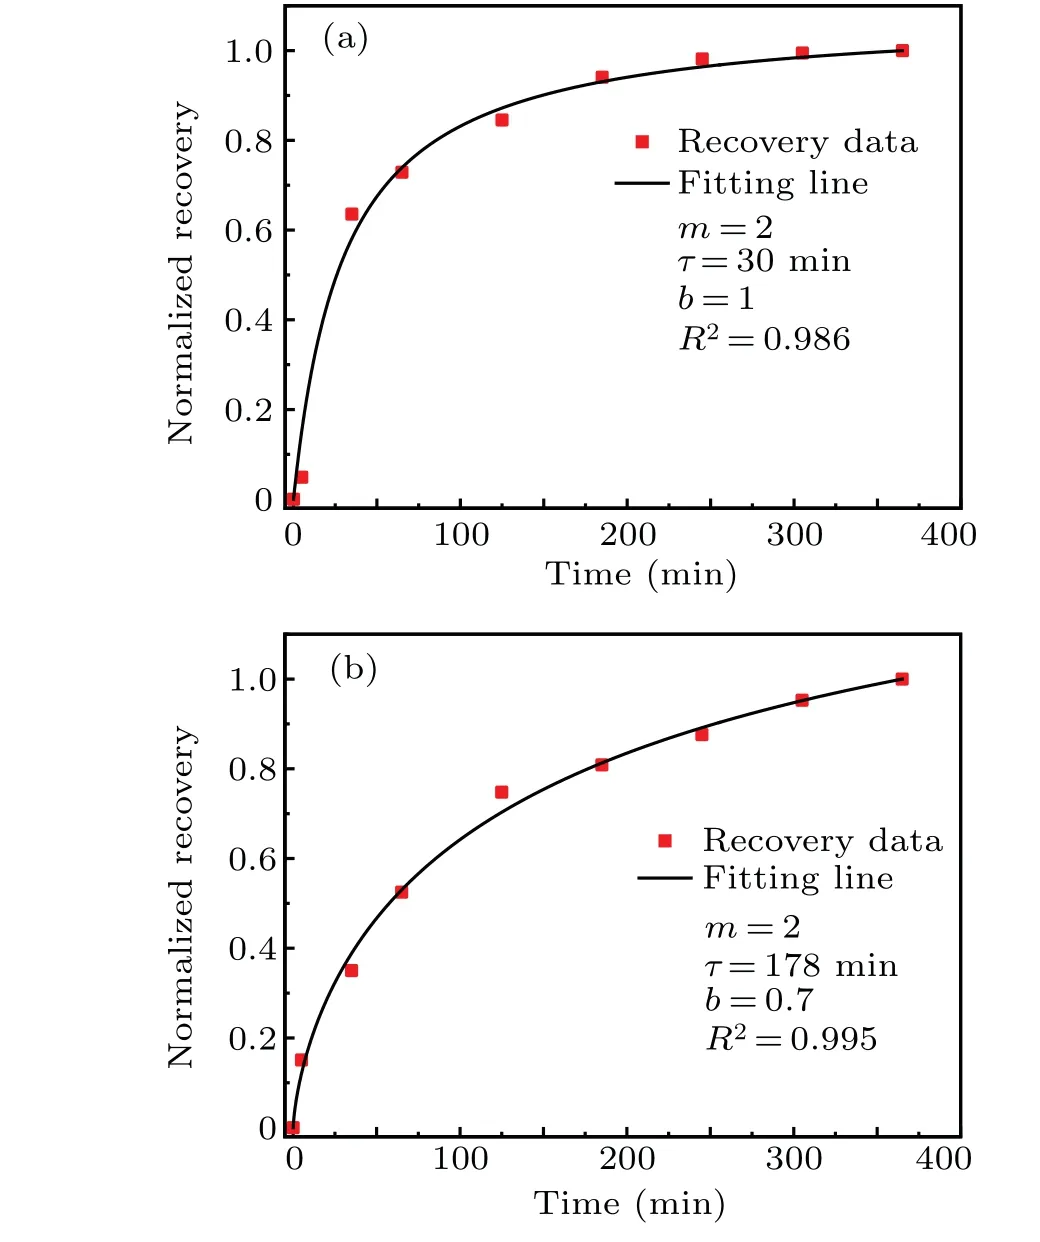
Fig.4. Fitted recovery processes of CCs with the second-order kinetics model: (a)Si-related CCs(b)Al–OHC CCs.
The fitted parameters related to recovery process of Sirelated and Al-OHC CCs are 30 min and 178 min,respectively.
4.3. Calculation of RIA at 980 nm with CCs model
RIA of different CCs is given in Eq.(5). While time constantτkis determined in section 4.2,gk f(˙D) for Si-related,Al–OHC and Al-(3)CCs are still uncertain. They can be computed by fitting RIA at any wavelength. However, the measured loss at 980 nm in our experiment are the total effects of RIA and pump absorption. So the actual RIA at 980 nm is determined by developed three-level ASE model(Eqs.(1)and(2))with measured loss at 980 nm. However,before calculating the RIA at 980 nm,the accuracy of three-level ASE source model is confirmed and it is shown in Fig.5.
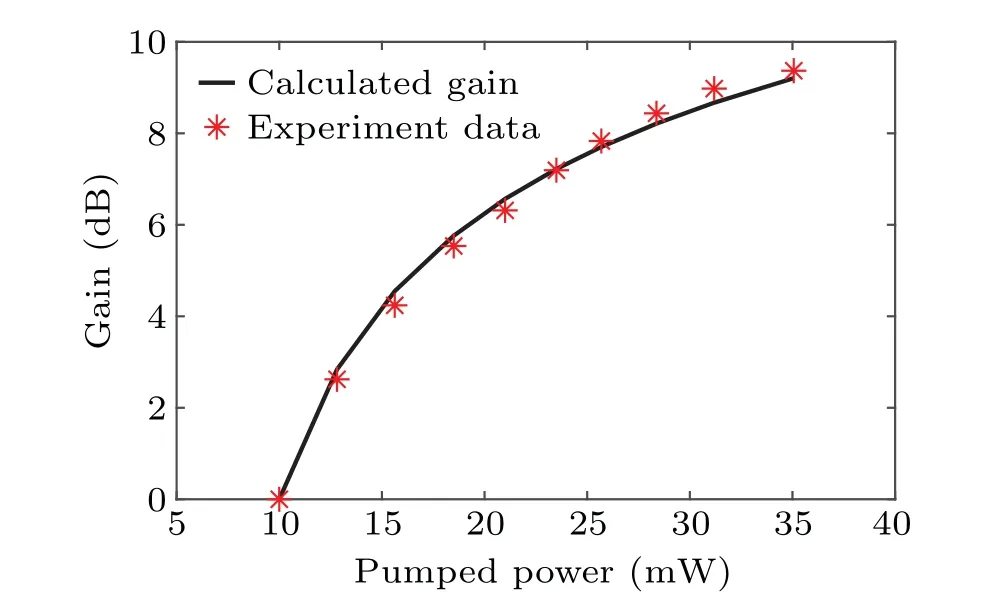
Fig.5. Calculated and measured gain at 980 nm with different pump power.
4.4. The prediction of ASE degradation
All these results above can be used in Eqs. (1) and (2),and once solved, these equations give the gain evolution as a function of irradiation dose and dose rate. The loss prediction model is established by using the gain loss at the dose rate of 30 Gy/min with the dose range from 0 to 155 Gy. By solving Eqs.(1)and(2)by using parameters in Tables 3 and 4,all the model parameters can be obtained.The gain loss with the dose range from 155 Gy to 220 Gy is used for self-validating.Then,we use this model extrapolating to high dose with the same dose rate of 30 Gy/min. And Fig. 6 gives the self-validating result.
The color center generation only relates to the fiber material and radiation dose rate.The greater the dose rate,the faster the color center is produced. In the experiment,the same kind of EDF was used at different dose rate. Therefore, when extrapolating to low dose rate as low as 0.8 Gy/min, the only thing need to do is dividing these dose rate related parametersgk f(˙D) with a constant, which is about 40.1. Figure 7 displayed the extrapolation result and experiment data,and it fits well.
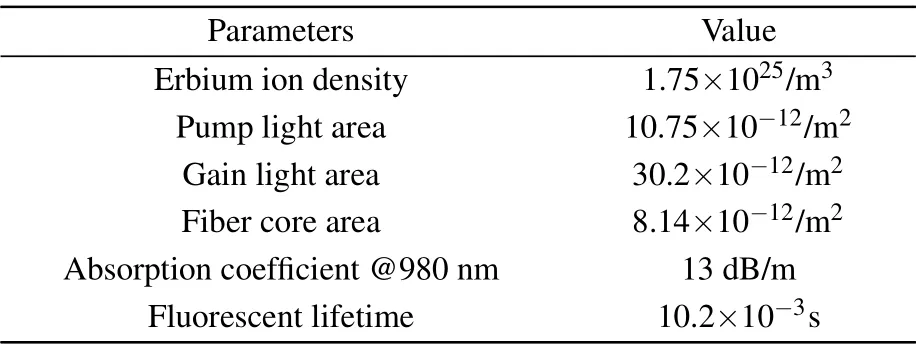
Table 4. Parameters used for ASE model calculation.

Fig.6. Fitting of gain loss and self-validation.
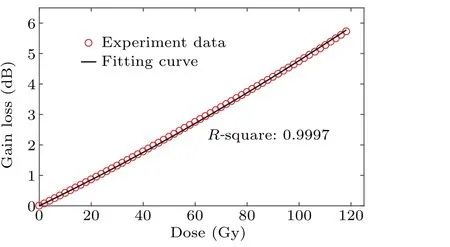
Fig.7. Gain loss extrapolation to low dose rate.
5. Conclusion
This paper has modeled the three-level ASE sources degradation when exposed to radiation. Combing RIA spectrum response based on CCs and saturating exponential model,a good fitting result of measured gain degradation data is achieved by a simple measurement method. It means the method is accurate enough in ASE degradation prediction.What’s more, the new model shows great advantages, as the measurement processes are simple. In addition,the color center model is flexible and powerful when considering the photon bleaching effect. And extrapolating to other dose and dose rate is also satisfied. The result shows that the model makes it possible to evaluate the performance of ASE source under lower dose rate and different service life of satellite in space environment. This research will contribute to the applications of ASE source in radiation environments.
Acknowledgement
Project supported by the Aeronautical Science Foundation of China(Grant No.20170851007).
- Chinese Physics B的其它文章
- Switchable terahertz polarization converter based on VO2 metamaterial
- Data-driven parity-time-symmetric vector rogue wave solutions of multi-component nonlinear Schr¨odinger equation
- Neutron activation cross section data library
- Multi-phase field simulation of competitive grain growth for directional solidification
- A novel similarity measure for mining missing links in long-path networks
- Effects of electrical stress on the characteristics and defect behaviors in GaN-based near-ultraviolet light emitting diodes