effects of Inhibitory Signal on Criticality in Excitatory-Inhibitory Networks?
2019-07-16 12:29:48FanWang王帆andShengJunWang王圣軍
Fan Wang(王帆)and Sheng-Jun Wang(王圣軍)
Physics and Information Technology,Shaanxinormal University,Xi’an 710119,China
AbstractWe study the criticality in excitatory-inhibitory networks consisting of excitable elements.We investigate the effects of the inhibitory strength using both numerical simulations and theoretical analysis.We show that the inhibitory strength cannot a ffect the critical point.The dynamic range is decreased as the inhibitory strength increases.To simulate of decreasing the efficacy of excitation and inhibition which was studied in experiments,we remove excitatory or inhibitory nodes,delete excitatory or inhibitory links,and weaken excitatory or inhibitory coupling strength in critical excitatory-inhibitory network.Decreasing the excitation,the change of the dynamic range is most dramatic as the same as previous experimental results.However,decreasing inhibition has no effect on the criticality in excitatory-inhibitory network.
Key words:criticality,excitable network,dynamic range
1 Introduction
Self-organized critical states are found for many complex systems in nature,[1?2]from earthquakes to neuronal avalanches.[3?10]Several lines of evidence point to the existence of such critical states in brain activity.[11?22]The critical avalanches were observed by in vitro and in vivo experiments.[23?30]It was shown that neuronal avalanches may play an important role in cortical information processing and storage.[28,31?32]It was suggested that cortical networks that generate neuronal avalanches bene fit from a maximized dynamic range.[33?37]
The excitable networks can be used as a simpli fi ed model to study the criticality in neural networks.[38?39]A model of an excitable network on Erd?s-R′enyi(ER)random graphs was proposed by Kinouchi and Copelli(KC model).[40]It is based on the branching process,which was used to understand the mean- field behavior of selforganized criticality.[41]It was shown that the criticality occurs at branching ratio is one and the dynamic range is maximized at critical point.
In realistic neural systems,the excitatory and inhibitory neurons coexist in networks.[42?44]The behavior of excitatory-inhibitory(EI)network is critical for understanding how neural circuits produce cognitive function,[45]and inhibition is always included in neural models.[19,39,46]The balance of excitation and inhibition has been shown that it plays an important role in the neuron discharge rate,[47]dynamic range of response,[48]and temporal structure of the spontaneous avalanche activity.[19,49]Prominent examples of balance include the intracellular recordings performed by Ferster[50]in simple and complex cells of the visual cortex in the cat.The inhibitory elements can be studied in the framework of KC model.In Ref.[51]network consists of the excitatory layer and the inhibitory layer which have the same coupling strength.The critical point is determined by the fraction of the excitatory elements.
The strength of inhibitory couplings is an attractive feature of neural networks.The inhibitory strength is several times larger than the excitatory strength.This is physiologically realistic,since inhibitory synapses are often closer to the cell body of postsynaptic neurons.[46]In Ref.[35]the criticality is changed dramatically by using antagonists to change the efficacy of synaptic couplings in experiment.It was shown that balanced excitation and inhibition establishes criticality,which maximizes the dynamic range.The change of the couplings was modeled by adjusting the branching ratio in an excitatory excitable network.However,little is known about the impact of changing the excitation and inhibition in Einetwork.
In this paper,we consider a model of Einetwork on the ER graphs using the KC model.We investigate the effect of inhibitory signal’s strength on criticality and dynamic range.We show that the critical point is not affected by inhibitory signal’s strength,and stronger inhibitory signal decreases the dynamic range.Moreover,to simulate the efficacy of antagonists,we change the network in three ways:removing excitatory/inhibitory nodes,deleting excitatory/inhibitory links,and weakening excitatory/inhibitory coupling strength.We show that the inhibition does not a ffect network criticality and sensitivity.We also conduct an analytic study of Einetwork to explain the effect of inhibition.
2 The Excitatory-Inhibitory Network Model
The EI excitable network model includes both inhibitory elements and excitatory elements.[48]The signal transferred from an excitatory node increases the probability that the neighbors of this node are excited,while the signal from an inhibitory node decreases this probability.
Each excitable element i=1,...,N has n states:si=0 is the resting state,si=1 corresponds to excitation and the remaining si=2,...,n?1 are refractory states.To be precise,at discrete times t=0,1,...(?t=1 ms)the states of the nodes siare updated as follows:
(i)If node i is in the resting state,si=0,it can be respectively inhibited by inhibitory neighbor j with probability,when node j is in excited state sj=1.In this case,the state of node i will remain 0 in the next time step.Otherwise,it can be excited with probabilityby excitatory neighbor l which is in excited states,or independently by an external stimulus with probability λ(λ =1?exp(?η)).The maximum transfer probabilities of excitatory and inhibitory nodes are denoted by pemaxandThe probabilityoris a random variable with uniform distribution in the interval[0,pimax]or[0,pemax].Each element receives external signals independently,that is,we have a Poisson process for each element.
(ii)After excitation the dynamics of nodes are deterministic:if si=1,then in the next time step its state changes to si=2,and so on until the state si=n?1 leads to the resting state si=0.So the node is a cyclic cellular automaton.
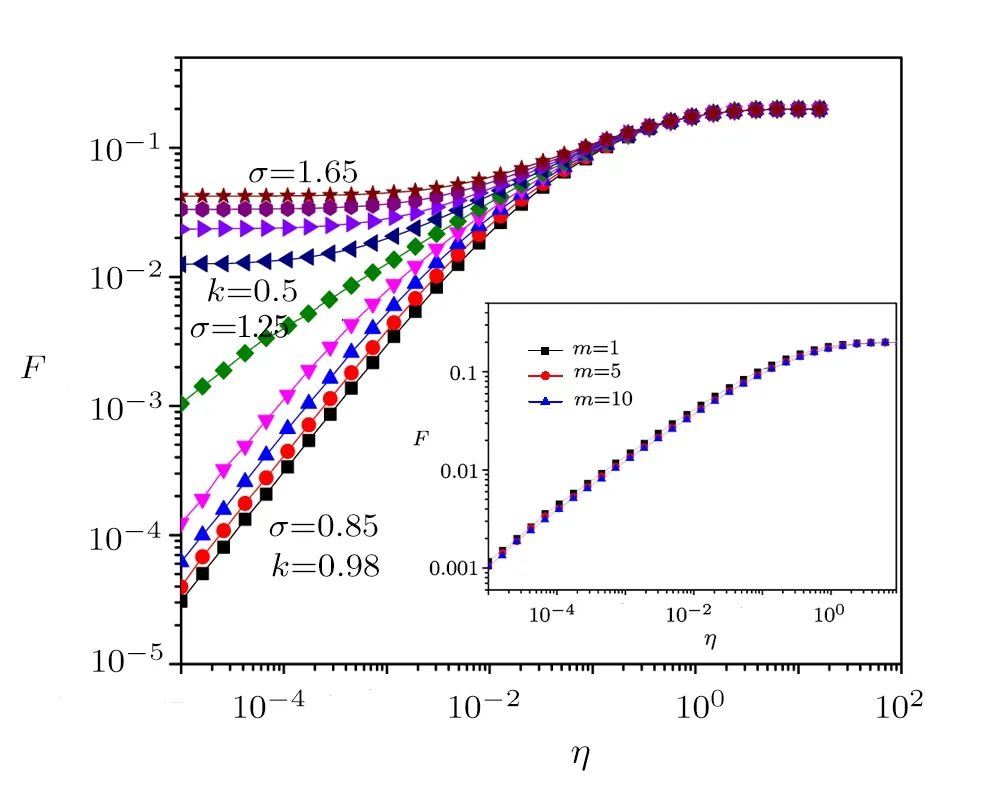
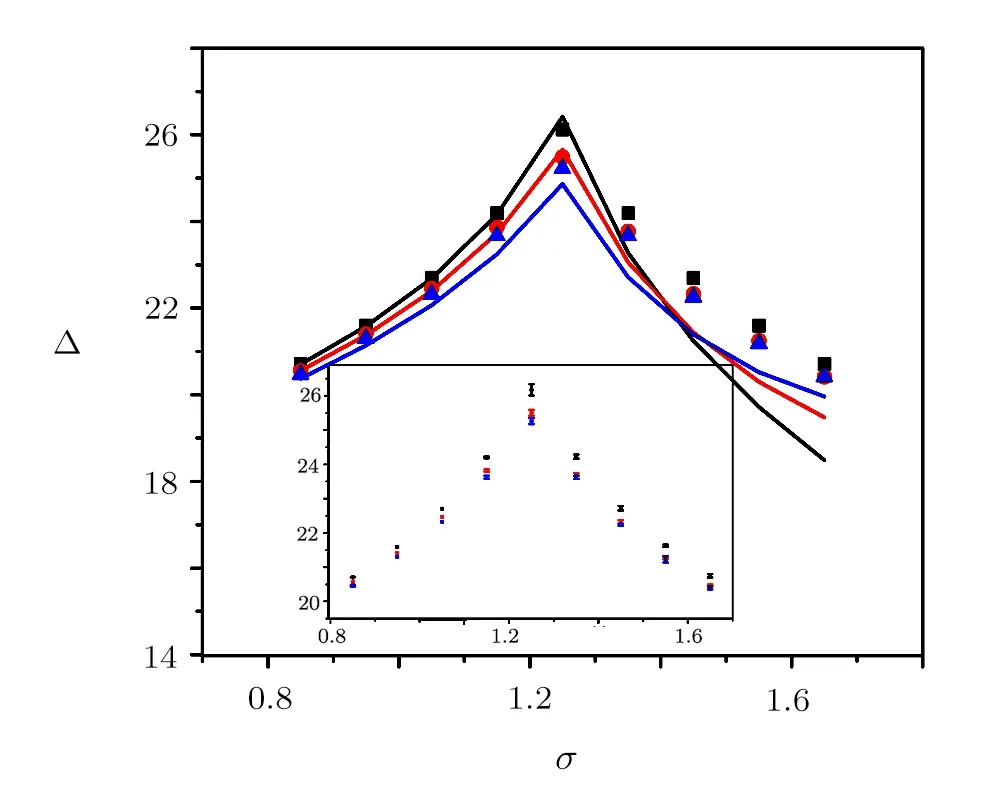
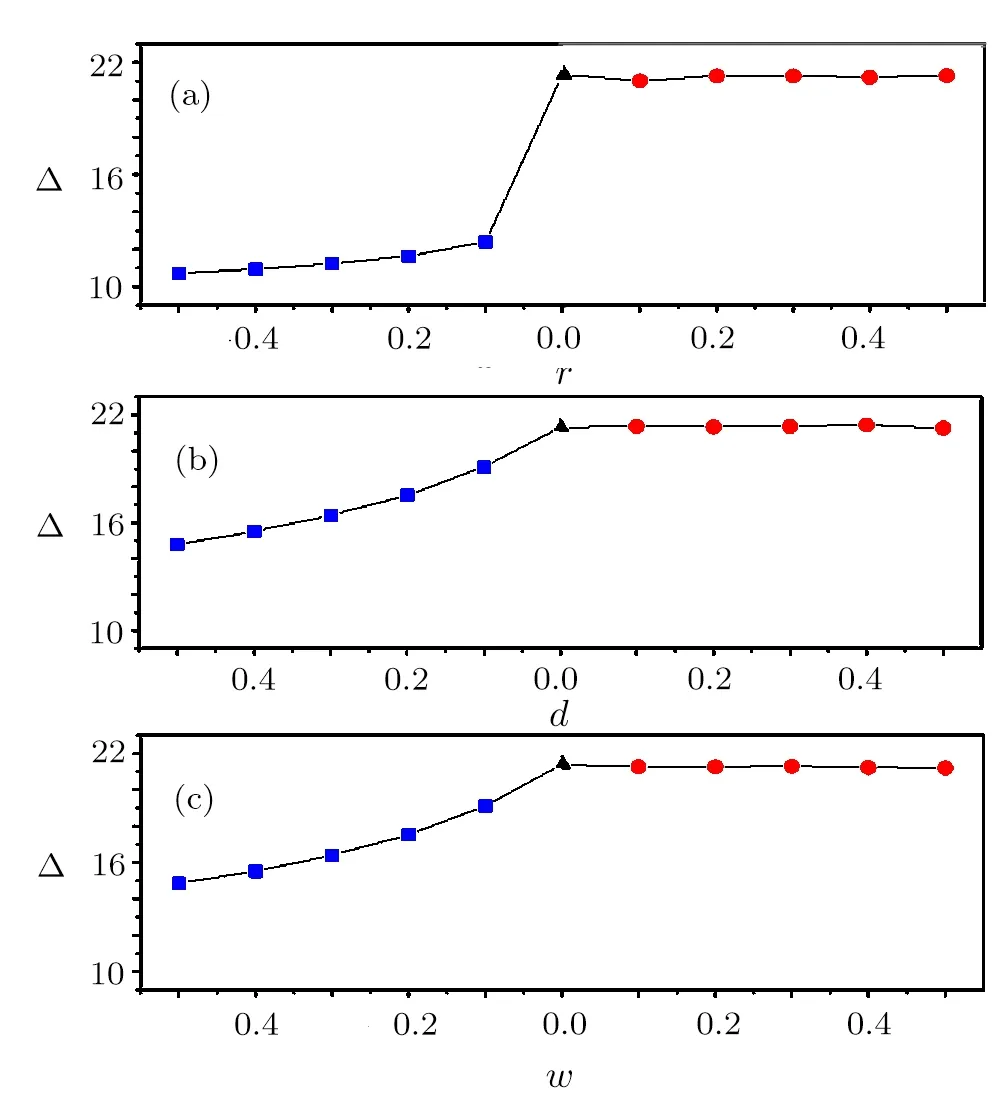
The system consists of N elements,which are coupled by an ER random network.We randomly choose Ne=feN nodes as excitatory elements,0 The local branching ratio of excitatory nodes corresponds to the average number of excitations created in the next time step by the excitatory node j,where each excitatory element j is randomly connected to Kjneighbors.The average branching ratio σ = ?σj?is the relevant control parameter. The network instantaneous activity is characterized by the density ρtof active nodes(s=1)at a given time t.The average activity is defined as where T is a large time window(of the order of 103step).As a function of the stimulus intensity η,networks have a minimum response F0and a maximum response Fmax.Variations in η can be robustly coded by variations in F,discarding stimuli that are too weak to be distinguished from F0or too close to saturation.The range[η0.1,η0.9]is found from its corresponding response interval[F0.1,F0.9],where The dynamic range?is defined as the range of stimuli(measured in dB)[40] This choice of a 10%?90%interval is arbitrary,but is standard in the literature and does not a ffect our results.[40] We first study how the strength of inhibitory couplings changes the transition of the network’s average activity.The coupling strengths are determined by the values of pemaxand pimax.For excitatory couplings,we set pemax=2σ/K.Then the mean value of peis σ/K.To study the effects of the strength of inhibitory couplings in the model,we set the maximal inhibitory probability as=2mσ/K.To simulate that inhibitory coupling strength is larger than the excitatory coupling strength,we set m>1 in simulations.We input external stimulus for 1000 steps,then remove the stimulus and calculate the average activity Fη→0. Fig.1 (Color online)Response Fη→0versus σ on Einetworks for different m with N=105,K=10,n=5,fe=4/5.The inset shows the instantaneous density of active sites for subcritical(square),critical(circle),and supercritical(triangle)states as function of time.Three different runs for each case are presented. Subcritical states have a negligible average activity,while supercritical states have a large average activity.As can be seen in the inset of Fig.1,in subcritical state,the network becomes silent quickly.In supercritical state,network presents self-sustained activity.In the critical state,the duration of activity has a large variance.At this state,the average activity becomes into non-zero.We plot the response curves F versus σ for various inhibitory signal strength m.In Fig.1,one can see that all the curves of F show the transition at the same position.The critical value of the σ is 1.25 which is agree with the value obtained in networks with pemax=We obtained that the critical points are not changed as the strength of inhibitory couplings increases. We also investigate the effects of inhibitory strength on the response of Einetwork to stimulus.The average activity F is used as the response of networks to stimulus.Figure 2 shows the relation between the response of the network and the stimulus strength for m=5.The results show that the Einetworks can exhibit the same features of response curve as in excitatory networks.When σ < σc,the system is relatively insensitive.When σ =0.85< σc,the slope(k)of response curve is near to 1,when σ = σc,the slope comes to 0.5,sensitivity is enlarged because weak stimuli are ampli fi ed.As a result,the dynamic range increases monotonically with σ.When σ > σc,the spontaneous activity F0masks the presence of weak stimuli,the network maintains a large response in week stimuli.[40]Therefore dynamic range decreases.The response curves for different m in critical states are shown in the inset of Fig.2.The response curve is changed slightly.The effect of inhibitory strength m on average activity F may lead to slight change in the dynamic range. Fig.2(Color online)Response curves(mean fi ring rate versus stimulus rate)from σ=0.85 to 1.65(in intervals of 0.1)with m=5.Inset:response of the critical network with different m.fe=4/5,N=105,K=10,n=5. We obtain the dynamic range versus the branching ratio for different inhibitory strength.In the simulation,we approximate η0.9to 1.The curves are shown in Fig.3.As the same as excitatory networks,the dynamic range peaks at the critical point.One can see that,the dynamic range is decreased with the inhibitory strength m.As shown in inset,the error of dynamic does not overlap for different inhibitory coupling strength.We can conclude that increasing the inhibitory coupling strength do not a ffect the critical point,and causing slightly decrease of dynamic range.As the error of dynamic range is weak,it is not shown in later section. Fig.3 (Color online)Dynamic range versus branching ratio for different values of inhibitory coupling strength m.The points represent simulation results with m=1(square),m=5(circle),and m=10(triangle)on Einetworks.The lines correspond to theoretical results from Eqs.(20)and(21)with m=1(black),m=5(red),m=10(blue).The inset presents the error of dynamic range for different inhibitory coupling strength. Fig.4 (Color online)The effect of decreasing the excitation(square)and inhibition(circle)on dynamic range.The triangle points represent the network’s dynamic range in critical state.(a)Removing a fraction(r)of excitatory or inhibitory nodes.(b)Deleting a fraction(d)of excitatory or inhibitory links.(c)Weakening a fraction(w)of excitatory or inhibitory coupling strength in critical network. In order to modeling the experiments in Ref.[33]that using antagonists to change the excitation and inhibition,we change the network in three ways:removing a fraction(r)of excitatory or inhibitory nodes(0 Figure 4 shows that when reducing the excitation by each of the three methods,the dynamic range?decreases.Each method of reducing the excitation can recover the phenomenon in experiments.[33]As excitatory elements are removed,the change of the dynamic range is most dramatic.The second and third method of reducing the excitation has the same result. Most interestingly,none of the three methods of reducing inhibition can change the dynamic range.Therefore the model of EI excitable network cannot recover the experimental phenomenon of changing the inhibition.In the following we present an analytic treatment of the effect of inhibition on the criticality. In the mean- fi led approximation,the average degree K is used to replace the degree Ki.[40,51?52]The excitatory probability peijas the average value σ/K,and the inhibitory probability piijas mσ/K.Therefore,the evolution of the response F is described by the following meanfield map, where is the approximate probability that a randomly selected site is in the resting state(s=0).(1?mσFt/K)fiKis the probability that a resting node at time t will not be inhibited at the next time step by any of its inhibitory neighbors,and[1?(1?σFt/K)feK]is the probability of being excited by at least one of its excitable neighbors.In the stationary state,Ft+1=Ft=F.When external stimuli η=0,the response function F is given by the solution of Then we linearize the terms(1? mσF/K)fiKand(1?σF/K)feKto the first order using binomial expansion, The order parameter behavior is In the right terms,the parameter associated with the inhibition(fi,m)are multiplied with the second or third order of response F,while the parameter associated with the excitation(fe)can be multiplied with the first,second and third order of F.One solution of Eq.(10)is F=0,when F>0,Up to the first order,more terms that associated with the excitation are retained: Then the response function F is given by the solution of When the control parameter σ → 1/fe,the activity F→0.Therefore,the critical point is and F=0 when σ<1/fe.The result does not depend on the average number of neighbours K.The parameter used in Fig.1 is fe=4/5,so the critical point is σc=1.25 for different values of m. The analytic results show that the critical point is independent of the strength of the inhibitory signal.The theoretical result agrees with the simulations. Next we analyze the effect of the inhibitory signal strength on the dynamic range.In the limit F→0,the response function in Eq.(5)can be approximated by Given response F=F0.1we can obtain the stimulus η0.1 For η0.9,Eq.(14)is invalid because it applies only to F → 0.In order to simplify the analysis,we set η0.9to 1.It has been employed in Refs.[40,51].Using Eq.(4),we have We expand the terms exp(feσF0.1)and exp[(mfi+fe)σF0.1]in Eq.(16)to the second order In the limit of F→0,the dynamic range is Up to the first order,?follows the equation, For a system with refractory time n,the maximal response Fmax=1/n.According to Eqs.(3)and(12),we have When σ≤1/fe, We estimate the theoretical results of dynamic range using Eqs.(20)and(21).The inhibitory signal strength is in the term of F20.1which is relatively small in?as shown in Eq.(20).The theoretical results are shown as the curve in Fig.3.The curves are in agreement with the simulations,that the dynamic range is taken to the maximum value in the critical state,and the increase of inhibitory strength can decrease the dynamic range. Furthermore,the analytic treatment is more suitable for the regular random network.In the regular random network,nodes are connected randomly but each node has the same number of neighbors.[53]The simulation results are also in agreement with the theoretical predications,as shown in Fig.5. For analysis of simulate the experiment in Ref.[33],we first remove a fraction(r)of excitatory nodes.The evolution of the average response F is described by the following mean- field map, Removing the excitatory nodes decrease the probability of being excited by at least one of its remaining excitable neighbors.When external stimuli η=0,the response function F is given by the following solution in the stationary state(Ft+1=Ft=F), Following the method used in Subsec.4.1,the response function F is given by the solution of When the control parameter σ → 1/(1?r)fe,the activity F→0.Therefore,the critical point is σc<1/fe,so network becomes into subcritical state. Removing a fraction(r)of inhibitory nodes,the evolution of the average response F is described as, A slight change in the probability of inhibition,changing the critical point to σc=1/fe,which equal to original network’s branching ratio.The theoretical prediction fits the change of critical point.The response curves are presented in Fig.6(a).As can be seen,removing the excitatory nodes increases the critical point.Therefore,the critical state becomes a subcritical state.However,removing the inhibitory nodes does not change the critical branching ratio. Deleting a fraction d of excitatory/inhibitory links,leads to the following mean- fi led map respectively: Their critical point is similar to removing nodes.When deleting the excitatory links,the critical point is σc=1/(1 ? r)fe,when deleting the inhibitory links,the critical point is σc=1/fe.Figure 6(b)shows the network response curves as a function of branching ratio.The change of critical points is in agreement with predictions from our theoretical treatment. As the excitatory/inhibitory coupling strength are weakened by a fraction w,the excitatory/inhibitory coupling strength,their average response F is respectively given by the solution of: The corresponding critical points for them are σc=1/(1 ? r)fe,and σc=1/fe.This is consistent with the simulation results shown in Fig.6(c). Moreover,the dynamic range of Einetwork with reduced inhibition is given by the following solution where α=r,d,w for three methods of reducing inhibition respectively.The fraction of decreasing the inhibition is in the term of F02.1,which is relatively small in?. Fig.6(Color online)Response curves(mean fi ring rate versus stimulus rate)for different fraction of decreasing the excitation(square)and inhibition(circle).The triangle points represent the network’s mean fi ring rates in critical state.(a)In the case of removing a fraction(r)of excitatory nodes or inhibitory nodes,the r=0.1,0.2 are plotted separately.(b)In the case of deleting a fraction(d)of excitatory or inhibitory links,the d=0.1,0.2 are plotted separately.(c)In the case of weakening a fraction(w)of excitatory or inhibitory coupling strength,the w=0.1,0.2 are plotted separately. Through the analytic treatment of three methods of reducing the efficacy of excitation and inhibition,we show that reducing the excitation of the network increases the critical value of σ,and changes the network in the critical state into the subcritical state.So the dynamic range is reduced.However,decreasing inhibition has no influence on critical point on Einetwork. In summary,we studied the role of inhibition in the criticality of Einetwork of excitable elements.We show that the critical point is not a ffected by inhibitory signal strength,and the increase of inhibitory signal strength will decrease the dynamic range slightly.Moreover,we use three different methods of reducing excitation and inhibition in order to simulating the experiment in Ref.[33].Using a simulation and analysis,we show that reducing the excitation can make the critical state of the network into a subcritical state,thus dynamic range is decreased as the same as experiments.However reducing the inhibition cannot change network’s criticality and dynamic range. The results of the modeling study suggest that the experimental results in Ref.[33]cannot be understood by the change of the inhibition in excitable networks.We use the Poisson process to replace the dynamics of synapses,therefore time effect of spiking is ignored.Perhaps a better compromise between larger dynamic range and biological realism would be dynamics of synapses.Moreover,the process of stimulating nodes by neighbors causes the effect of inhibition is week.More sophisticated modeling studies are needed to enhance the effect of inhibition.The present model has the virtue of enabling analytical results that provide a benchmark for the performance of networks with other topologies.The scale-free small-world networks re fl ect important functional information about brain states.[54]The existence of functional hubs was observed by experiments,and perturbation of a single hub influenced the entire network dynamics.[55]In the future,verifying hypothesis that the inhibitory hubs may have an impact on criticality in a scale-free network would be a meaningful work.


3 Simulations and Results

4 Analytical Results
4.1 Increasing the Inhibitory Coupling Strength


4.2 Reducing Excitation and Inhibition


5 Discussions
 Communications in Theoretical Physics2019年6期