Similarity measurement method of high-dimensional data based on normalized net lattice subspace①
2017-06-27 08:09:22LiWenfa李文法WangGongmingLiKeHuangSu
High Technology Letters 2017年2期
Li Wenfa (李文法), Wang Gongming, Li Ke, Huang Su
(*Beijing Key Laboratory of Information Service Engineering,Beijing Union University, Beijing 100101, P.R.China) (**National Laboratory of Biomacromolecules, Institute of Biophysics, Chinese Academy of Sciences, Beijing 100101, P.R.China)
Similarity measurement method of high-dimensional data based on normalized net lattice subspace①
Li Wenfa (李文法)②*, Wang Gongming**, Li Ke*, Huang Su*
(*Beijing Key Laboratory of Information Service Engineering,Beijing Union University, Beijing 100101, P.R.China) (**National Laboratory of Biomacromolecules, Institute of Biophysics, Chinese Academy of Sciences, Beijing 100101, P.R.China)
The performance of conventional similarity measurement methods is affected seriously by the curse of dimensionality of high-dimensional data. The reason is that data difference between sparse and noisy dimensionalities occupies a large proportion of the similarity, leading to the dissimilarities between any results. A similarity measurement method of high-dimensional data based on normalized net lattice subspace is proposed. The data range of each dimension is divided into several intervals, and the components in different dimensions are mapped onto the corresponding interval. Only the component in the same or adjacent interval is used to calculate the similarity. To validate this method, three data types are used, and seven common similarity measurement methods are compared. The experimental result indicates that the relative difference of the method is increasing with the dimensionality and is approximately two or three orders of magnitude higher than the conventional method. In addition, the similarity range of this method in different dimensions is [0, 1], which is fit for similarity analysis after dimensionality reduction.
high-dimensional data, the curse of dimensionality, similarity, normalization, subspace, NPsim
0 Introduction
A similarity measurement can determine similarity degree between two data, or distance between two points, which is the basis of data-mining methods such as clustering, classification, nearest neighbor search, and association analysis. Conventional similarity measurement methods include Euclidean distance, Jaccard coefficient[1], and Pearson coefficient[2]. These methods can satisfy the similarity measurement requirement in low-dimensional space (less than 16)[3]. However, with the increasing spatial dimensionalities, the distance between a query point and its nearest neighbor point tends to be equal to the distance from the query point to its farthest neighbor point. When the distance between any two points is equal everywhere, the similarity is pointless; this is called the isometrics in high-dimensional space[4]. The root cause of this phenomenon is the curse of dimensionality that is derived from properties of sparsity and empty space in a high-dimensional space. Thus, the performances of many similarity measurements are positively affected in the low-dimensional space, yet decrease sharply in the high-dimensional space.
In recent years, a series of methods have been proposed for similarity measurement of high-dimensional data; these includeHsim(X,Y)[5],HDsim(X,Y)[6],Gsim(X,Y)[7],Close(X,Y)[8],andEsim(X,Y)[9].However,thesemethodsignoretherelativedifferenceinproperty,noisedistribution,weight,andareonlyvalidforcertaindatatypes[10].ThePsim(X,Y)functionconsiderstheabove-mentionedfactors[10]andisapplicabletoavarietyofdatatypes;however,itisunabletocomparesimilarityunderdifferentdimensionsbecauseitsrangedependsonthespatialdimensionality.
Tosolvethisproblem,asimilaritymeasurementmethodofhigh-dimensionaldatabasedonnormalizednetlatticesubspaceisproposed.Thesimilarityrangeisnolongerlimitedbythespatialdimensionality.
1 Relatedwork
1.1 Curse of dimensionality
This is a ubiquitous phenomenon in the application field of high-dimensional data, and occurs because of the sparsity and empty space in high-dimensional space.
1.1.1 Sparsity
There is ad-dimensional data setDinahypercubeunitΨ=[0,1]d,anddataelementsaredistributeduniformly.Theprobabilityofapointfallingintoonehypercubewithlengthsissd,whichdecreaseswiththeincreaseofsbecauses<1.Thatis,itisverylikelythatthereisnopointinalargerange[11].Forexample,approximatelyonly0.59%dataexistsinahypercubewithlength0.95whendimensions=100.
1.1.2Emptyspacephenomenon
Anormaldistributiondatasetcanbeexpressedbyitscenterpointandstandarddeviation.ThedistancesbetweenthedatapointsandthecenterpointobeytheGaussdistribution;however,theirrelativeorientationcanbeselectedrandomly.Inaddition,thenumberofpossibledirectionsrelativetoacenterpointisincreasedexponentiallyandthedistancebetweenthemisincreasedwiththeincreaseofdimensionality.Fromtheviewpointofthedensityofadataset,amaximumvalueexistsatthecenterpoint,althoughtheremaynotbeapointclosetothecenterpoint.Thisphenomenonofahigh-dimensionalspaceiscalled“emptyspace.”
1.1.3 Isometry
The volume of unit sphere in ad-dimensional space is described as follows.
(1)
V(d)decreasesgraduallywiththeincreaseofdimensionalityd.Fig.1showsthatV(d)→0ifd>16.

Fig.1 Variation trend of unit sphere volume with
With the increase in dimensionality, the number of corners increases and the volume of unit sphere gradually decreases because the volume of the unit hyperspace does not change. Thus, most of the data will be distributed in the hyperspace corner. This phenomenon is shown in Fig.2 from left to right; the three subgraphs show the distributions of super-space data with dimensionality of 2, 3, and 8, respectively. In eight-dimensional space, 98% data is distributed in 2^8 = 256 corners. Moreover, the maximum and minimum Euclidean distances between the data and center point are both the same. When the dimensionality tends to infinity, the difference between the maximum and minimum Euclidean distance of the sample points to the center point tends toward 0.
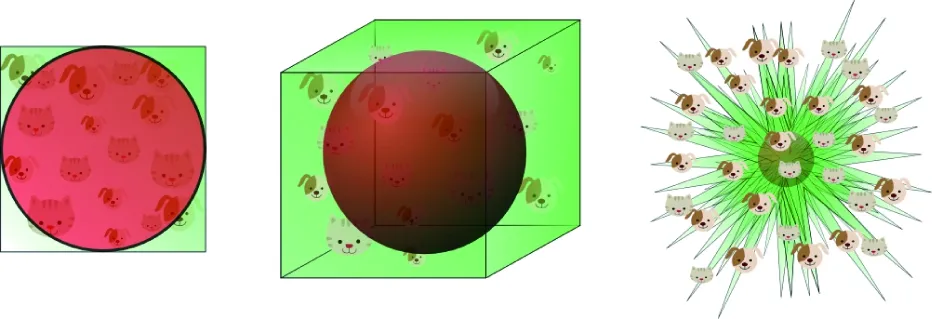
Fig.2 Data distribution in different dimensions
Therefore, with the increase in dimensionality, the Euclidean distance between any data tends to remain the same, and no longer has the measurement function. The corresponding data-mining methods, such as clustering, classification, and nearest neighbor, would lose their effect.
1.2 Conventional high-dimensional data similarity measurement methods
In recent years, a similarity measurement problem in high-dimensional space has been studied to a certain extent but the research is insufficient. TheHsim(X,Y)functionwasproposedbyYang[5],whichisbetterthantheconventionalmethodbutneglectstherelativedifferenceandnoisedistribution.Inaddition,itisnotsuitableformeasuringthesimilarityofcategorical-attributedata.Next,theGsim(X,Y)function[7]wasproposedaccordingtotherelativedifferenceofpropertiesindifferentdimensions;however,itignorestheweightdiscrepancy.Zhaointroducedthepiecewisefunctionδ(X,Y)intoHsim(X,Y)andproposedtheHsimc(X,Y)function[12],whichcomprisesafunctionofmeasuringcategorical-attributedata.However,similaritybetweenapairofpointswhosecomponentsarecomplementaryineverydimensionisinconsistentwiththeactualresult.Thepiecewisefunctionδ(X,Y)offunctionXiemodifiedHsimc(X,Y)andproposedtheHDsim(X,Y)function[6],whichcansolvetheproblemderivedfromacomplementarypropertyineverydimension.However,theattributedifferenceandnoisedistributionproblemareneglected.TheClose(X,Y)function[8]basedonthemonotonousdecreaseofe-xcanovercometheinfluencefromcomponentsinsomedimensionswithlargevariancebutdoesnotconsidertherelativedifference,whichwouldbeaffectedbynoise.TheEsim(X,Y)[9]functionwasproposedbyimprovingHsim(X,Y)andClose(X,Y)functionsandcombiningtheinfluenceofpropertyonsimilarity.Ineverydimension,theEsim(X,Y)componentshowsapositivecorrelationtothevalueinthisdimension.Alldimensionsaredividedintotwoparts:normalandnoisydimensions.Inanoisydimension,thenoiseoccupiesmajority.Whennoiseissimilarorlargerthantheoneinanormaldimension,thismethodisinvalid.Thesecondarymeasurementmethod[13]isusedtocalculatethesimilaritybyvirtueofpropertydistribution,spacedistance,etc.;however,itneglectsthenoisedistributionandweight.Inaddition,itistime-consuming.TheconceptofnearestneighborprojectionwasproposedbyHinneburg[14],whichwascombinedwithdimensionalityreductiontosolvetheprobleminhigh-dimensionalspace.However,thismethodcomplicatesthedeterminationofasuitablequalitycriterionfunction.Thus,anextensiontheorywasintroducedintosimilaritycalculation[15],inwhich,thehigh-dimensionaldataisexpressedasanorderedthreetuplebyvirtueofmatterelement,andthedeviation(theintervallengthofattributevalueineverydimension)isaddedintofunctionA. However, this method is too complicated, and the result validation of the high-dimensional data was not described in the corresponding paper. Yi[10]determined that in a high-dimensional space, the difference in a noisy dimension is larger than in a sparse dimension, no matter how similar the data is. This difference occupies a large amount of the similarity calculation, leading to the calculation results of any objects being similar. Therefore, thePsim(X,Y)function[12]wasproposedtoeliminatethenoisyinfluencebyanalyzingthedifferenceamongalldimensions.Theexperimentalresultsindicatethatthismethodissuitableforavarietyofdata.However,itsrangeis[0,n],wherenisthedimensionality.Thus,thesimilaritiesindifferentdimensionscannotbecompared.
2 Similaritymeasurementmethodbasedonnormalizednetlatticesubspace
2.1 Sparse and noisy dimensions
With increasing dimensionality, the similarities based on theLdnormbetweenanydatabecomethesame.TherootcauseisthattheLdnormdependsonthedimensiontoomuchwhichhaslargelydifferentcomponents.Inotherwords,whencalculatingsimilaritybetweenXandY,thelargerthevalueofXi-Yionthei-th dimension, the greater the contribution of thei-th dimension toXandY.AlthoughbothXandYareverysimilarinotherdimensionsexceptthei-th dimension, the overall similarity ofXandYisverysmall.Thisi-th dimension is called sparse or noisy dimension.
Owing to the existence of sparsity and noise in the high-dimensional space, no matter how similar the two records are there will always be a different dimension. The difference in these dimensions occupies a large proportion of the whole similarity, leading to any record in the high-dimensional space being dissimilar[16].
To solve this problem, the data range in every dimension can be divided into several intervals, and the components can be mapped onto corresponding intervals. When calculating the similarity between two points, only the dimensions that fall into the same interval are used. The other dimensions are regarded as sparse or noisy dimensions, and are not included in the calculation.
2.2 Meshing of high-dimensional data space
Let the dimension of dataset bed,andthenumberofdataobjectbeM.Then,everydataobjectisexpressedasxk(1≤k≤M).Inaddition,everydimensionisdividedinton=[θd]continuousintervals,andθistherealnumberbetween0and1.Thus,thenumberofpointsineveryintervalisG=[M/n].
Inthei-th dimension, all components are sorted in an ascending order. Thek-th sorted value isVal[k](1≤k≤M).Rijisthej-th interval in thei-th dimension, whose lower and upper bounds areLRijandURij,respectively.ItcanbeseenthatLRij=Val[(j-1)G+1]andURij=Val[jG].

(2)
(3)
Forxkandyl,thesetofdimensionsinwhichcomponentsfallintothesameintervalis
(4)
Ifthei-th components ofxkandylfallintotheadjacentintervals,andthedistancebetweenthemislessthantheaveragelengthofthetwoadjacentintervals,thetwopointsareregardedasclosetoeachother,andincludedinthesimilaritycalculation.Thesetofthesedimensionsisshownas
(5)
ThesetofdimensionsincludedinthesimilaritycalculationistheunionofS1andS2:
S=S1US2
(6)
2.3Similaritymeasurement
ThePsim(X,Y)functionproposedbyYiissuitableforavarietyofdatatypes[10];however,itsrangeisdependentonthespatialdimensionality,andthusthecomparisonofsimilarityindifferentdimensionsisnotpossible.Underthecircumstanceofmaintainingeffects,Psim(X,Y)iscorrectedas
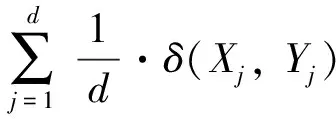
(7)
whereXandYareanytwopointsinthed-dimensional space, andXjandYjarecomponentsinthei-th dimension. Moreover,δ(Xj,Yj)isthediscriminantfunction.IfXjandYjareinthesameinterval[LRj,URj],δ(Xj,Yj)=1,otherwiseδ(Xj,Yj)=0.E(X,Y)representsthenumberofintervalsinwhichcomponentsofXandYareallthesame.TherangeofNPsim(X,Y)isobservedtobein[0, 1].TheaboveistheoutlineofNPsim,andthedetailedintroductioncanbefoundinRef.[10].
3 Experiment
Tovalidatethismethod,threedatatypeswithdifferentdistributionsweregeneratedthroughMatlab.Next,thesimilaritiesindifferentdimensionswerecalculatedusingtheproposedmethod,andwerecomparedwiththeresultobtainedfromcalculatingManhattandistance,Euclideandistance,Hsim(X,Y),Gsim(X,Y),Close(X,Y),Esim(X,Y),andPsim(X,Y).
3.1Datadescription
Thefollowingthreedatatypeswereusedintheexperiment[10].
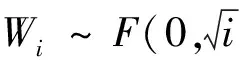
(1)Independentandidenticallydistributed(IID):Here,allvariablesobeythesamedatadistributionfunctionbutareindependentofeachother.TheIIDdataZisgeneratedbyZ=(Z1,…,ZM),andZifollowsthedistributionofZi~F(0,1).
(3)Dependentandidenticallydistributed(DID):Allvariablesobeythesamedatadistributionbutarenotindependent.Inaddition,twodimensionsareindependentofeachothercalled“freedimensions”;theotherdimensionsarerelatedtothem.TheDIDdataZisgeneratedasfollows.First,twod×1randomvariablesAandBobeyingthedistributionofF(0,1)aregenerated.Second,two1×MrandomvariablesUandVobeyingthedistributionofF(-1, 1)areproduced.Third,Z1(2≤i≤M)isgeneratedthroughZi=A×Ui+B×Vi.Atlast,theDIDdataZisproducedasZ=(Z1,…,ZM).
3.2Relativedifference
Tovalidatethismethod,IID,RID,andDIDdataaregeneratedusinganormrnd()functionofMatlab[10].Thedimensionofeverydatatypeisasfollows: 10, 60, 110, 160, 210, 260, 310, 360,and410.Thenumberofdataineverydimensionis1000.Inaddition,therelativedifferencebetweenthefarthestandnearestneighborsiscalculatedasfollows[17]:
(8)
whereDmaxn,Dminn,andDavgnaremaximal,minimal,andaveragesimilaritiesinthed-dimensional space, respectively. The relative difference results are shown in Figs 3~5.
According to the characteristics of the results, similarity measurement methods are divided into two types: the first includes Manhattan distance, Euclidean distance,Hsim(X,Y),Gsim(X,Y),Close(X,Y),andEsim(X,Y);andtheothersincludePsim(X,Y)andNPsim(X,Y).Therelativedifferenceofthesecondtypeofmethodsistwoorthreemagnitudeslargerthanthatofthefirsttypeofmethods.Therefore,theperformanceadvantageofthesecondmethodtypeisobvious.
TherelativedifferenceofPsim(X,Y)andNPsim(X,Y)hasnodifferentiationdegree.Thus,thestatisticalanalysisneedstobestudiedfurther.
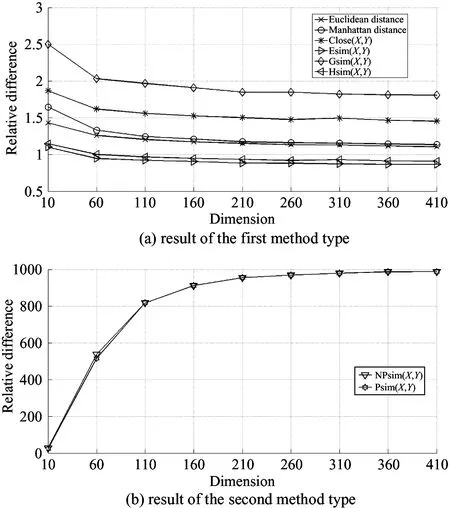
Fig.3 Relative difference of various similarity measurement methods for IID data
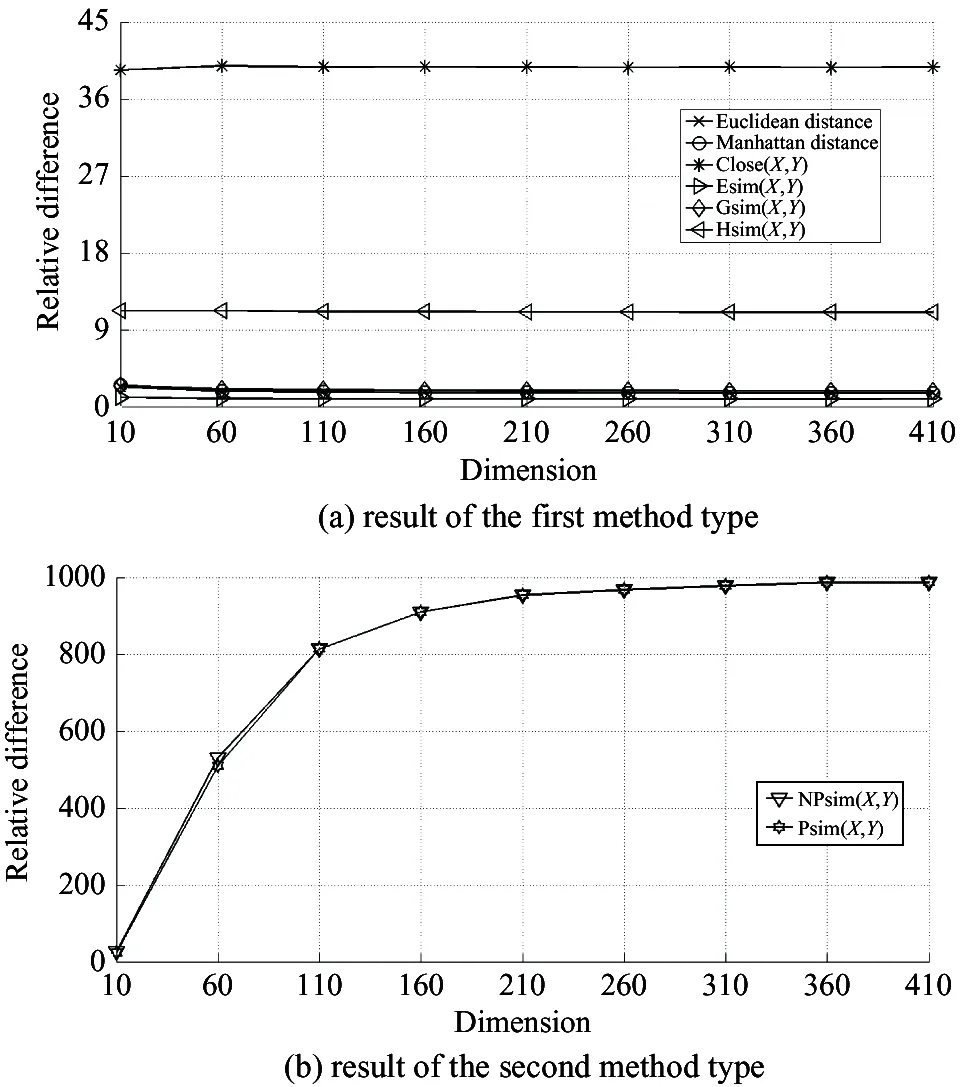
Fig.4 Relative difference of various similarity measurement methods for RID data
3.3 Statistical analysis
To compare the effect ofPsim(X,Y)andNPsim(X,Y),themaximum,minimum,andaverageofDIDdataindifferentdimensionsarecalculated,asshowninFig.6.TheexperimentalresultsindicatethatthesimilarityrangeofPsim(X,Y)increaseswiththedimension.Thus,thefunctionisnotsuitableforthesimilaritycomparisonindifferentdimensions.However,theproblemdoesnotexistinNPsim(X,Y).Table1liststhenumbersofPsim(X,Y)whosevalueisgreaterthan1indifferentdimensions.Thenumberof
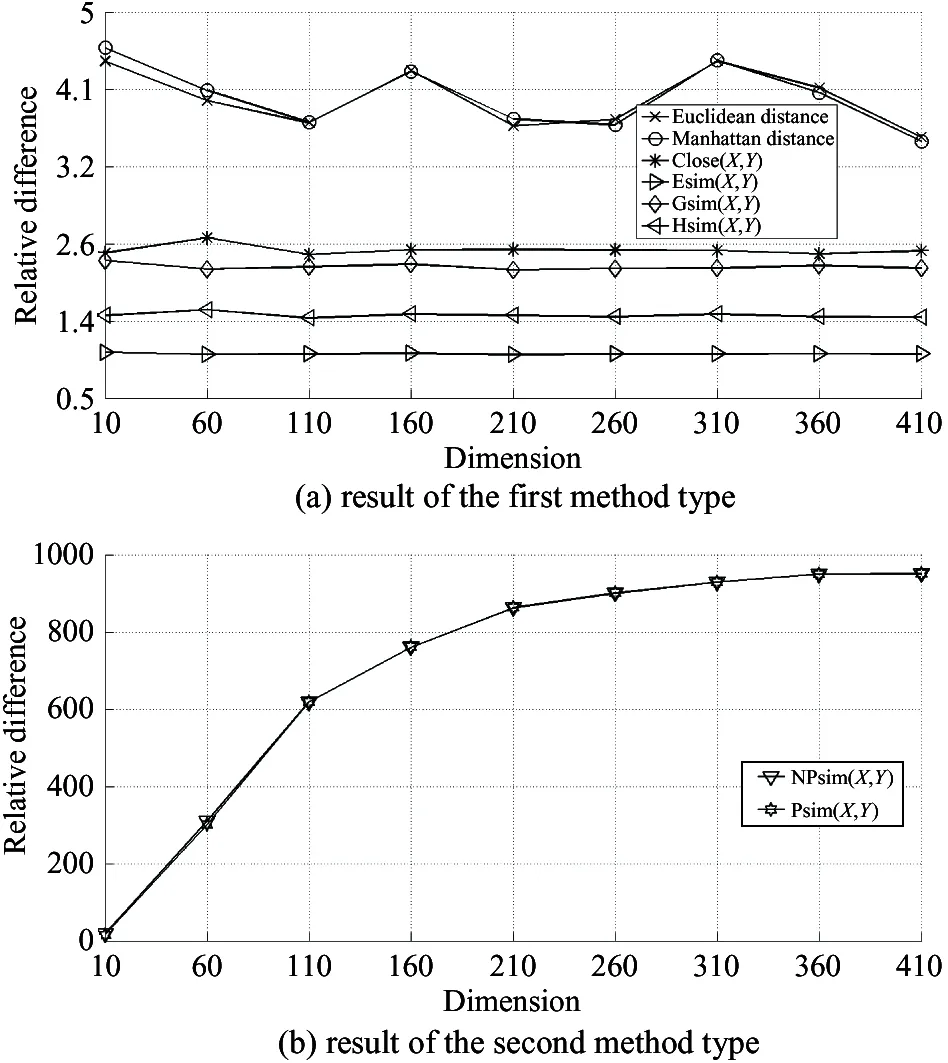
Fig.5 Relative difference of various similarity measurement methods for DID data

Fig.6 Statistical value of various similarity measurement methods for DID data

Dimension1060110160210Number1686041203731132481045284672Dimension260310360410260Number9842963024720155885198429
Psim(X,Y)ineverydimensionis1000×1000=1,000,000.Inaddition,the5%~17%resultismorethan1,andthusthecomparisonofsimilarityindifferentdimensionsisnotpossible.Therefore,NPsim(X,Y)cansatisfytherequirementofsimilaritycomparisonindifferentdimensions.
4 Conclusion
Thesimilaritymeasurementisthebasisofdata-miningalgorithms,suchasclustering,classification,andnearestneighbor.However,owingtothecurseofdimensionality,themeasurementalwaysfailsinhigh-dimensionalspace.Asimilaritymeasurementmethodofhigh-dimensionaldatabasedonanormalizednetlatticesubspaceisproposed.Inthismethod,datarangeofeachdimensionisdividedintoseveralintervals,andthecomponentsaremappedontothecorrespondingintervals.Duringsimilaritycalculation,onlythecomponentinthesameoradjacentintervalisused.Thismethodcanavoidthesimilarityeffectthatgeneratedfromthesparseornoisydimension.Tovalidatetheproposedalgorithm,threetypesofdistributiondataareusedintheexperiment,andanothersevenmethodtypesarecompared.Theexperimentalresultsshowthattheproposedmethodissuitableforsimilaritymeasurementinhigh-dimensiondata.
Inthefuture,theweightcalculationindifferentdimensions,andtheautomaticupdatingstrategyofaspatialgridwillbestudied.Inaddition,theproposedmethodwillapplyarelateddata-miningalgorithm,suchasclusteringorcorrelationanalysis.
[ 1] Tan P N, Michael S, Vipin K. Introduction to Data Mining. Boston: Addison-Wesley Publishing Company, 2005. 25-36
[ 2] Chen J N. The Research and Application of Key Technologies in Knowledge Discovery of High-dimensional Clustering. Beijing: Publishing House of Electronics Industry, 2011. 120-128(In Chinese)
[ 3] Aggarwal C C. Re-designing distance functions and distance based applications for high dimensional data.ACMSIGMODRecord, 2001, 33(1):117-128
[ 4] Warren B P. Approximate Dynamic Programming: Solving the Curses of Dimensionality (2nd Edition). Hoboken, New Jersey: John Wiley & Sons Press, 2011. 124-161
[ 5] Yang F Z, Zhu Y Y. An efficient method for similarity search on quantitative transaction data.JournalofComputerResearchandDevelopment, 2004, 41(2):361-368
[ 6] Xie M X, Guo J Z, Zhang H B, et al. Research on the similarity measurement of high dimensional data.ComputerEngineeringandScience, 2010, 32(5):92-96(In Chinese)
[ 7] Huang S D, Chen Q M. On clustering algorithm of high dimensional data based on similarity measurement.ComputerApplicationsandSoftware, 2009, 26(9):102-105(In Chinese)
[ 8] Shao C S, Lou W, Yan L M. Optimization of algorithm of similarity measurement in high-dimensional data.ComputerTechnologyandDevelopment, 2011, 21(2):1-4(In Chinese)
[ 9] Wang X Y, Zhang H Y, Shen L Z, et al. Re-search on high dimensional clustering algorithm based on similarity measurement.ComputerTechnologyandDevelopment, 2013, 23(5):30-33(In Chinese)
[10] Yi L H. Research on clustering algorithm for high dimensional data:[Ph.D dissertation]. Qinhuangdao: Institute of Information Science and Engineering, Yanshan University, 2011. 28-30(In Chinese)
[11] Ericson K, Pallickara S. On the performance of high dimensional data clustering and classification algorithms.FutureGenerationComputerSystems, 2013, 29(4):1024-1034
[12] Zhao H. Study on Some Issues of Data Clustering in Data Mining:[Ph.D dissertation]. Xi’an: School of Electronic Engineering, Xidian University, 2005. 35-42(In Chinese)
[13] Jia X Y. A high dimensional data clustering algorithm based on twice similarity.JournalofComputerApplications, 2005, 25(B12):176-177
[14] Alexander H, Charu A C, Keim D A. What is the nearest neighbor in high dimensional spaces? In: Proceedings of the 26th International Conference on Very Large Data Bases, Cairo, Egypt, 2000. 506-515
[15] Yuan R P, Shi M R. Research on the similarity of high dimensional big data based on extenics.OperationsResearchandManagementScience, 2015, 24(5):184-188
[16] Kriegel H P, Kr?ger P, Zimek A. Clustering high-dimensional data: a survey on subspace clustering, pattern-based clustering, and correlation clustering.ACMTransactionsonKnowledgeDiscoveryfromData, 2009, 3(1):1-58
[17] Charu C, Aggarwal, Yu P S. The IGrid index: reversing the dimensionality curse for similarity indexing in high dimensional space. In: Proceedings of the 6th ACM SIGKDD International Conference on Knowledge Discovery and Data Mining, Boston, USA, 2000. 119-129
10.3772/j.issn.1006-6748.2017.02.009
①Supported by the National Natural Science Foundation of China (No. 61502475) and the Importation and Development of High-Caliber Talents Project of the Beijing Municipal Institutions (No. CIT & TCD201504039).
②To whom correspondence should be addressed. E-mail: liwenfa@buu.edu.cn
on Dec. 10, 2016
?? born in 1974. He received his Ph.D. degree in Graduate University of Chinese Academy of Sciences in 2009. He also received his B.S. and M.S. degrees from PLA Information Engineering University in 1998 and 2003 respectively. His research interests include information security, data analysis and mining, etc.
 High Technology Letters2017年2期
- High Technology Letters的其它文章
- A real-time 5/3 lifting wavelet HD-video de-noising system based on FPGA①
- Mining potential social relationship with active learning in LBSN①
- Negation scope detection with a conditional random field model①
- A case study of 3D RTM-TTI algorithm on multicore and many-core platforms①
- Closed-form interference alignment with heterogeneous degrees of freedom①
- A transition method based on Bezier curve for trajectory planning in cartesian space①