Parameter calculation and result storage for phase-field simulation in α-Mg dendrite growth of Mg-5-wt%Zn alloy
2023-12-02 09:22:54WeiPengChen陳偉鵬HuaHou侯華YunTaoZhang張云濤WeiLiu柳偉andYuHongZhao趙宇宏
Chinese Physics B 2023年11期
Wei-Peng Chen(陳偉鵬), Hua Hou(侯華),3, Yun-Tao Zhang(張云濤),Wei Liu(柳偉), and Yu-Hong Zhao(趙宇宏)2,,4,?
1School of Materials Science and Engineering,Collaborative Innovation Center of Ministry of Education and Shanxi Province for High-performance Al/Mg Alloy Materials,North University of China,Taiyuan 030051,China
2Beijing Advanced Innovation Center for Materials Genome Engineering,University of Science and Technology Beijing,Beijing 100083,China
3School of Materials Science and Engineering,Taiyuan University of Science and Technology,Taiyuan 030024,China
4Institute of Materials Intelligent Technology,Liaoning Academy of Materials,Shenyang 110004,China
Keywords: parameter calculation,result storage,phase-field method,dendrite growth
1.Introduction
The microstructures formed in solidification play a significant role in process control and mechanical properties of the final casting.[1]Dendrite, as a typical solidification microstructure,exists in most metallic alloys.[2,3]Understanding the evolution of dendrite morphologies and segregation distribution is important in controlling final microstructures.With the development of computer science and material thermodynamics, the phase-field method has become an indispensable means to simulate the evolution of microstructures,especially dendrites.[4–8]
Typically, a comprehensive phase-field simulation process involves several steps: modeling, parameter calculation,equations solver, and result storage and post-processing.In recent years, a lot of efforts have been made to model and making a equation solver.For example, in terms of modeling, multiphase and multiscale[9,10]and phase-field-lattice Boltzmann[11]models have been developed, and in terms of making equation solver, adaptive mesh refinement[12,13]and parallel computing[14,15]methods have been presented.Nevertheless,compared with the above two steps,calculating parameters, and result storage and post-processing were often only briefly mentioned in most of published papers.[16–18]There have been almost no systematic studies for the latter two steps, which will limit the application of the phase-field method.Moreover, according to Tourretet al.,[19]the energy function at the core of phase-field model depends on a large number of parameters that control different energy contributions, and quantitative predictions of microstructure evolution require careful identification of parameters.Therefore, it is necessary to find a feasible strategy for parameter calculation, which will improve the accuracy of simulation results.A natural link exists between phase-field method and CalPhaD method, and the phase diagram and thermodynamic/kinetic data of alloys can be obtained through the Cal-PhaD method.[20]For alloy solidification,an accurate description of solutal diffusion in liquid and solid is helpful in accurately predicting the segregation distribution.[21,22]According to empirical formulas from experiments or theoretical calculations,solutal diffusion coefficient in liquid and solid can be obtained,which are essential to describe solute diffusion.Then,key parameters of the phase-field model can be presented by combining the CalPhaD method and empirical formulas.In addition, a feasible result storage strategy requires not only high storage efficiency but also convenient post-processing.Since the simulation domain in phase-field simulation is usually a regular graph,finite difference[23]and finite volume[24]methods are often used to solve equations.Therefore, it is reasonable to use structured grid or structured point storage methods for result storage.
In this study, a method of calculating parameters and storing results is presented for phase-field simulation inα-Mg dendrite growth of Mg-5-wt% Zn alloy under isothermal solidification.Based on the PANDAT software, the Mg–Zn phase diagram is calculated,then third-order polynomials are adapted to fit both solidus and liquidus lines, and parameters such as equilibrium partition coefficientk, liquidus slopemare obtained.Subsequently, the solutal diffusion coefficient in liquidDland solutal diffusion coefficient in solidDsare calculated from empirical formulas.The structured grid and structured point storage methods are chosen to store simulation results, and the storage efficiencies of the two methods are compared.Finally,α-Mg dendrite growth is studied to test the accuracy of parameters and stability of storage methods.
The rest of this paper is organized as follows.The phasefield method is introduced in Section 2.The results and analysis are given in Section 3, and the discussion is presented in Section 4.Finally,conclusions are drawn from the present study in Section 5.
2.Phase-field method
2.1.Phase-field equations
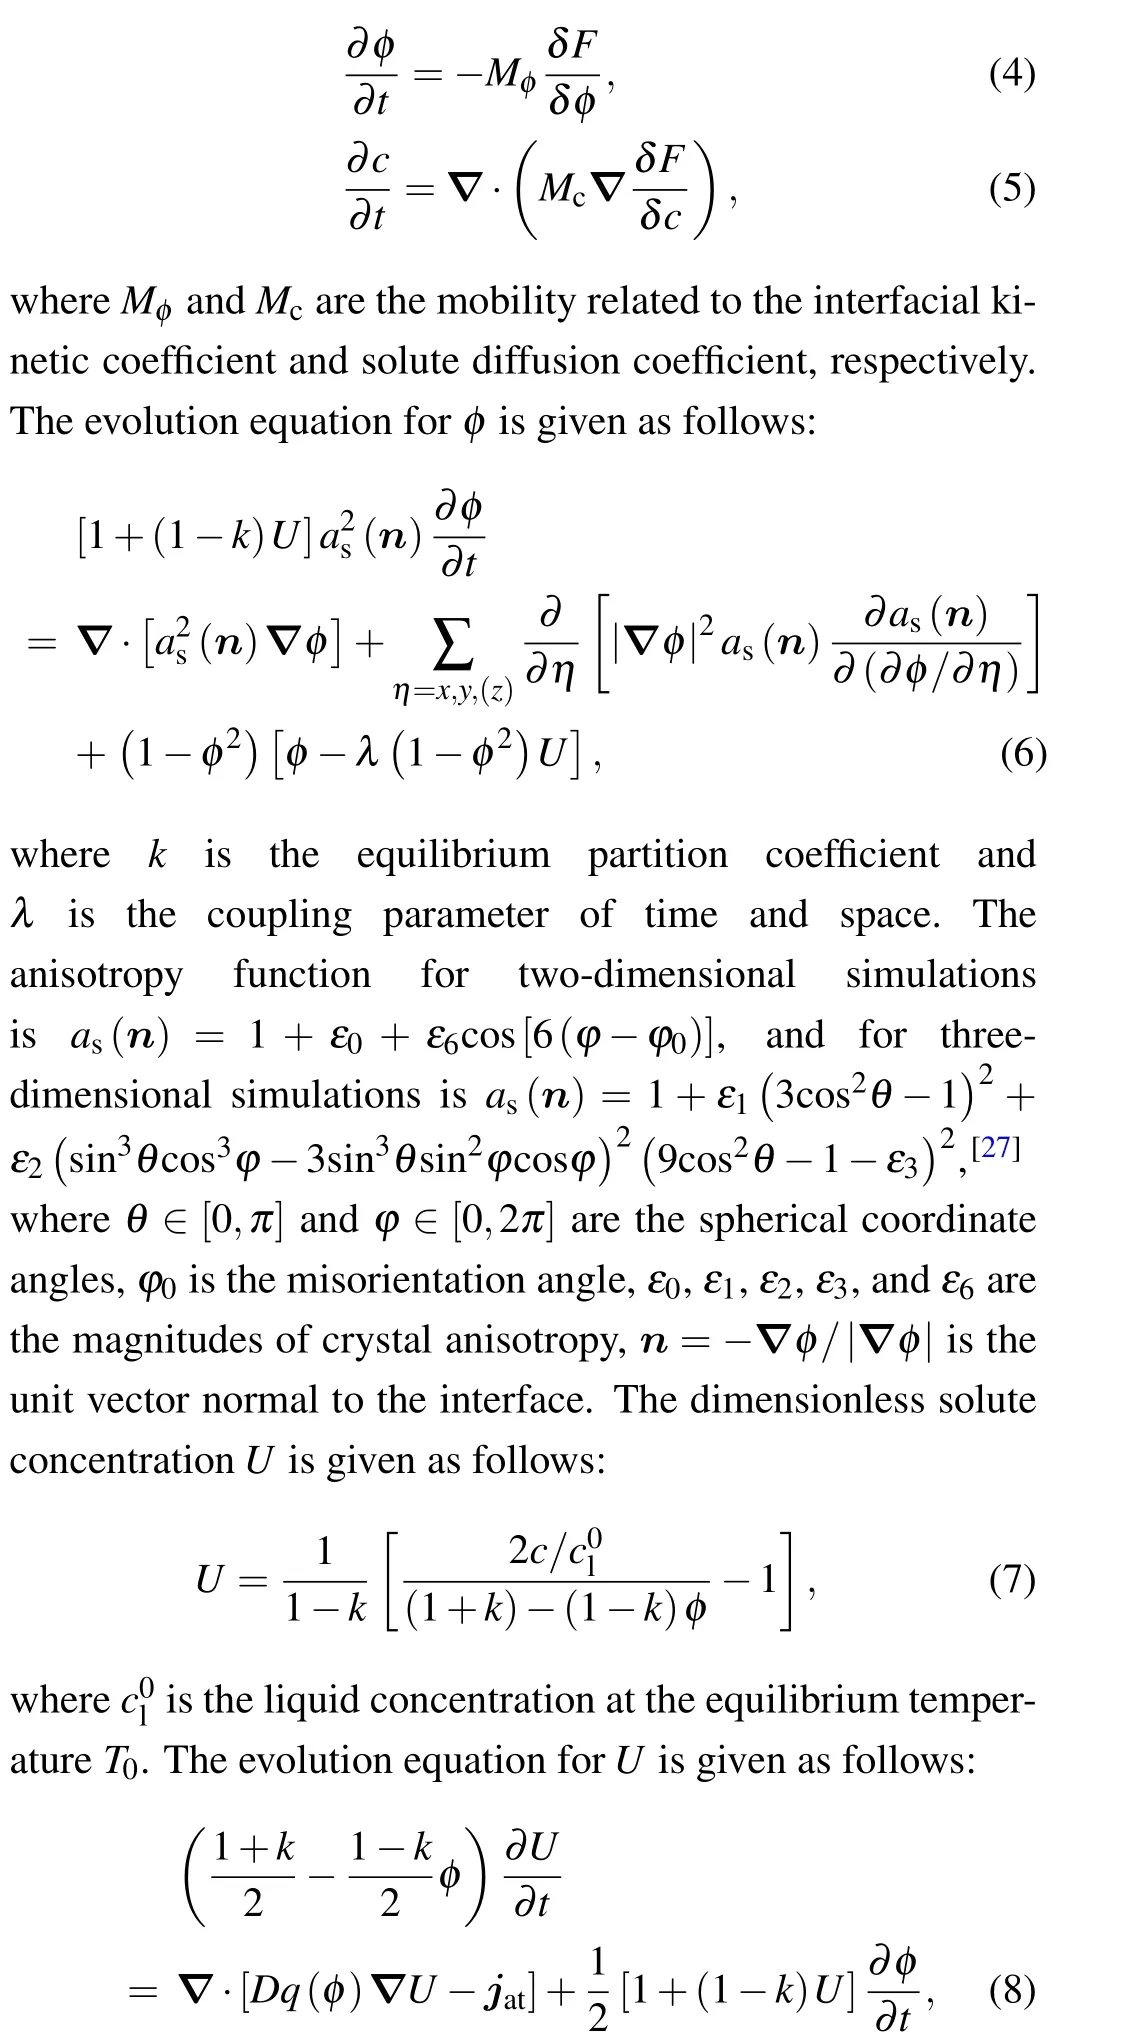
In this study, a quantitative phase-field model is used to describeα-Mg dendrite growth of Mg-5-wt%Zn alloy under isothermal solidification.[25,26]The phase-field is represented byφ, withφ=+1 in the solid,φ=-1 in the liquid, andφvarying smoothly from+1 to-1 within the diffuse interface.For a two-phase system, the free energy function can be described as
wherecis the solute concentration,Tis the temperature,σis the energy per unit length,andTmis the melting temperature.The double-well potential and free energy density functions are given,respectively,by
whereHis the barrier height,fA(Tm) is the free energy for pure A atTm,Ris the gas constant,v0is the molar volume of A,s(φ)andε(φ)are interpolation functions related to entropy density and internal energy density, respectively.According to Allen–Cahn equation and Cahn–Hilliard equation,the variational formulation for all fields can be derived from
2.2.Computational conditions
3.Results and analysis
3.1.Key parameters calculation
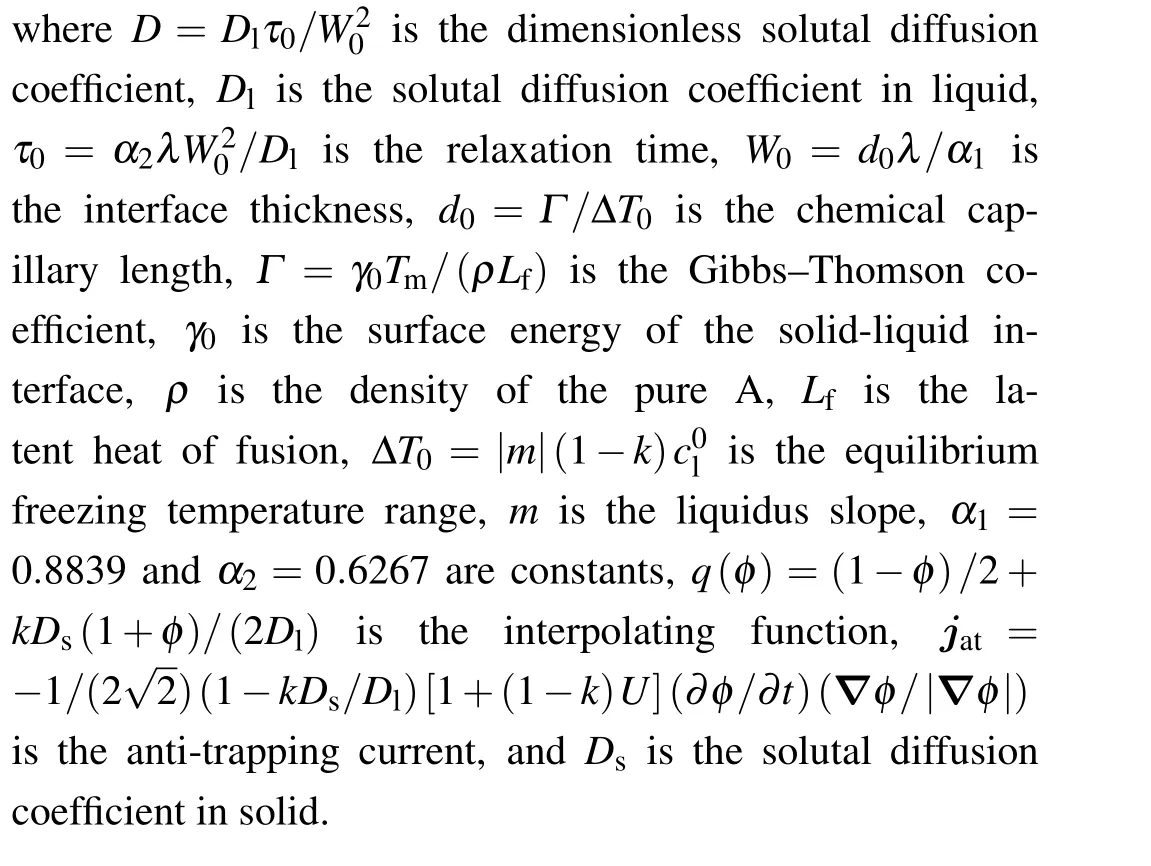
According to Eqs.(6)–(8), the key parameters of the phase-field model contain equilibrium partition coefficientk,solutal diffusion coefficient in liquidDl,solutal diffusion coefficient in solidDs,and chemical capillary lengthd0.The above parameters are the bridge between the phase-field model and the solidification process, playing an important role in determining the accuracy of simulation results.Based on thermodynamic data from PANDAT software(Version 2021b 64bit),part of the Mg–Zn phase diagram is calculated as shown in Fig.1.To obtain accurate physical parameters,the third-order polynomials are adapted to fit both solidus and liquidus lines as follows:[29]
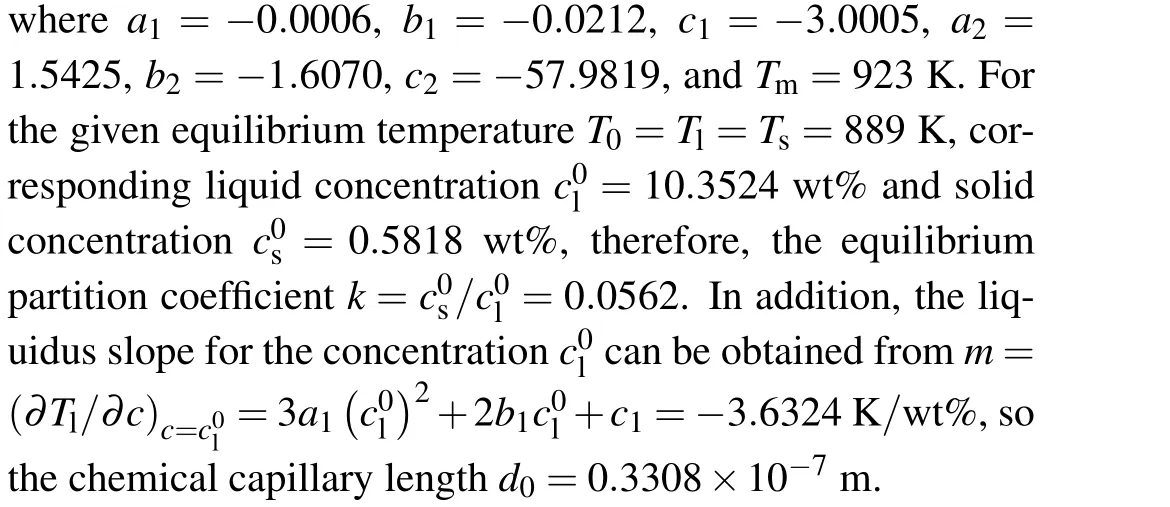

According to the empirical formulas,[30–32]the solutal diffusion coefficient in liquid and solid can be expressed, respectively,as
where ?Aand ?Bare both the adjustment constant,kBis the Boltzmann constant,ρmsoluteis the density of solute at the melting temperatureTmsolute,Msoluteis the atomic mass of solute,the termsVsolvent,Msolvent, andTmsolventare the absolute molar volume, the atomic mass, and the melting temperature of the solvent,respectively.Moreover,D0is the pre-exponential factor, andQis the activation energy.For Mg–Zn alloy, the Mg substrate is regarded as the solvent, and alloying element Zn is regarded as the solute.Therefore, according to Eqs.(12)and(13),the solutal diffusion coefficient in liquid isDl=4.6763×10⁻⁹m2/s and solutal diffusion coefficient in solid isDs=5.1899×10⁻¹⁴m2/s at the temperatureT=T0.
Moreover, Beckeret al.[33]showed that the simulations converge to stationary results forW0/d0≤10,therefore,W0=9.0d0=2.9772×10-7m, coupling constantλ=7.9551, relaxation timeτ0= 9.4497×10⁻⁵s, space step size ?x=0.8W0=2.3818×10⁻⁷m, and time step size ?t=0.01τ0=9.4497×10⁻⁷s.The other physical and model parameters for phase-field simulations are listed in Table 1.[34–36]
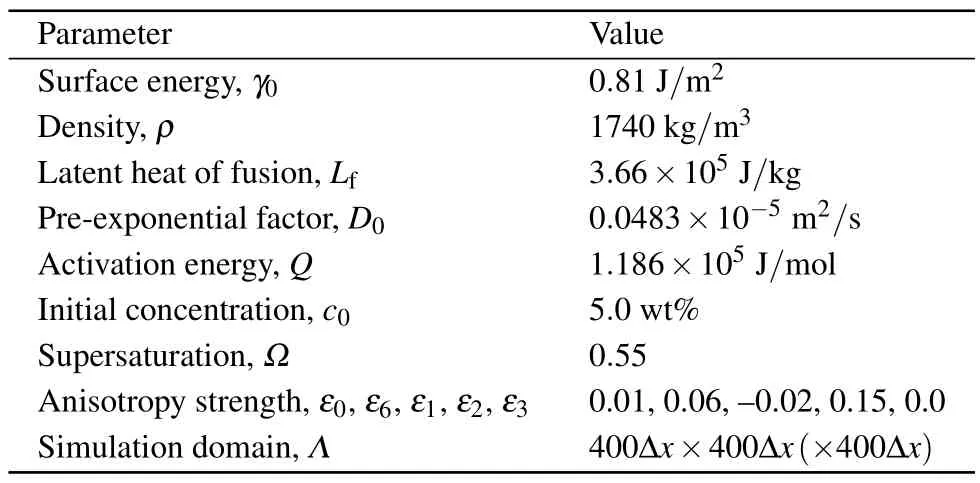
Parameter Value Surface energy,γ0 0.81 J/m2 Density,ρ 1740 kg/m3 Latent heat of fusion,Lf 3.66×10⁵ J/kg Pre-exponential factor,D0 0.0483×10⁻⁵ m2/s Activation energy,Q 1.186×10⁵ J/mol Initial concentration,c0 5.0 wt%Supersaturation,? 0.55 Anisotropy strength,ε0,ε6,ε1,ε2,ε3 0.01,0.06,–0.02,0.15,0.0 Simulation domain,Λ 400?x×400?x(×400?x)
3.2.Structured grid and structured point storage
Usually, the results of the phase-field simulation are stored in the array and need to be visualized by postprocessing software or package.Choosing an appropriate storage strategy is not only beneficial to the post-processing of results but also able to save storage space.In this study,based on the.vtkfile format, the structured grid method and structured point method are used to store simulation results.Figure 2(a)shows the structured grid storage method.It can be found that the grid needs first to be built according to the size of the array,and the elements in the array are then stored in grid nodes.Figure 2(b)shows the structured point storage method,which is different from the structured grid: elements in the array are directly stored as nodes.Figures 2(c) and 2(d) show simulation results stored by using the structured grid method and structured point method,respectively,through post-processing software: Paraview-Version 5.6.0 64bit.It can be found that in terms of the resolution of this study,there is almost no difference in dendrite morphologies obtained by these two storage methods.Moreover,for structured grid storage,when elements in the array are sequentially stored in grid nodes,undistorted post-processing results can be obtained only when the total number of nodes in each of all directions of the simulation domain is similar.When elements in the array are stored in reverse order in grid nodes, undistorted post-processing results can be obtained unconditionally.For structured point storage,undistorted post-processing results can be obtained only when elements in the array are stored in reverse order in nodes.
To illustrate the efficiency of the structured grid storage method and structured point storage method,storage space and storage time varying with node number are counted as shown in Fig.3.With the increase of node number,both storage space and storage time will increase linearly.For structured grid storage,the relationship between storage space and node number satisfiesy=15.0×10⁻⁶x, and the relationship between storage time and node number complies withy=0.8×10⁻⁶x.For the structured point storage,the relationship between storage space and node number meetsy=6.0×10⁻⁶x, and the relationship between storage time and node number obeysy=0.5×10⁻⁶x.Therefore,using the structured point storage method will reduce about 60%storage space and 37.5%storage time compared with the structured grid storage method.When the node number is small,the storage advantage of the structured point over the structured grid method is not significant.However, when the node number is large, it is difficult to obtain post-processing results even based on the current computer level.Therefore,when carrying out large-scale computing,especially for three-dimensional simulation,the use of the structured point storage method will greatly reduce storage space and time.

4.Discussion
4.1.The α-Mg dendrite growth
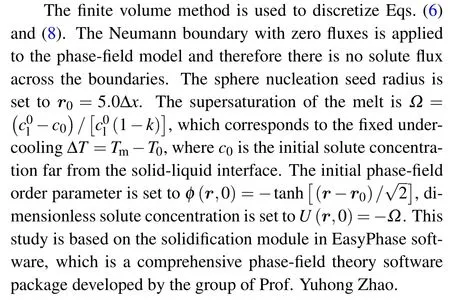
To verify the accuracy of parameters and stability of storage methods, the phase-field simulation inα-Mg dendrite growth of Mg-5-wt%Zn alloy is investigated.Figure 4 shows solute field evolution in the whole simulation domain, it can be found that the dendrite on{0001}crystal plane has six primary dendrite arms,showing a typical snowflake morphology,which result from the solid–liquid interface anisotropy.Owing to solute redistribution during the growth ofα-Mg dendrite, the solute is enriched on the liquid side of the solid–liquid interface, and solute enrichment at the root of the dendrite is higher than that at the tip of the dendrite,which results from curvature effect.Figure 5 shows the solute field evolution at the solid–liquid interface,it can be found that the threedimensional dendrite has eighteen primary dendrite arms,the six primary dendrite arms on{0001}crystal plane grows along the〈110〉direction, while the other twelve primary dendrite arms grow along the〈113〉direction,and the growth velocity of the primary dendrite arm growing along the〈110〉 direction is faster than that along the〈113〉 direction.Moreover,there is also a concentration difference at the solid–liquid interface, the concentration is high in depression areas and low in uplift areas,and the difference in concentration between the two areas is about 0.2,which is lower than that between solid and liquid.
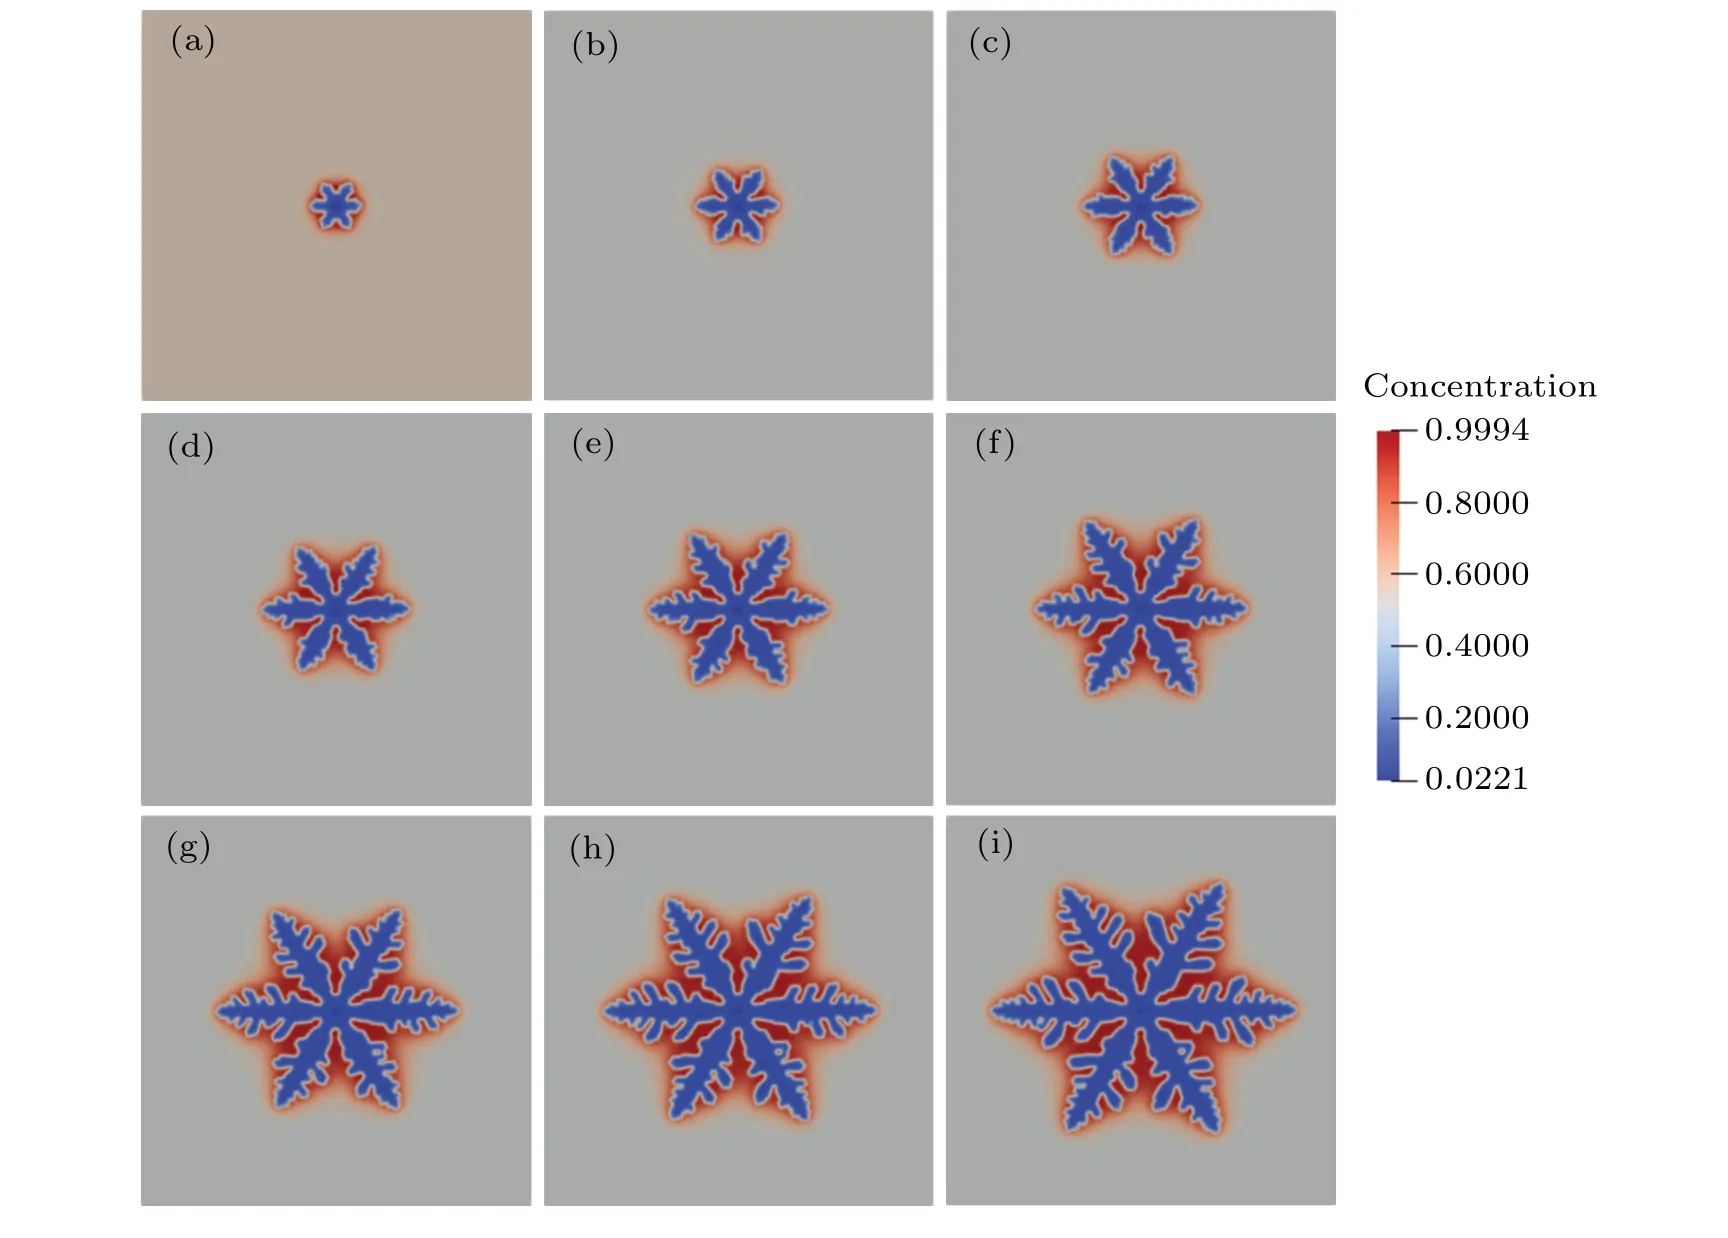
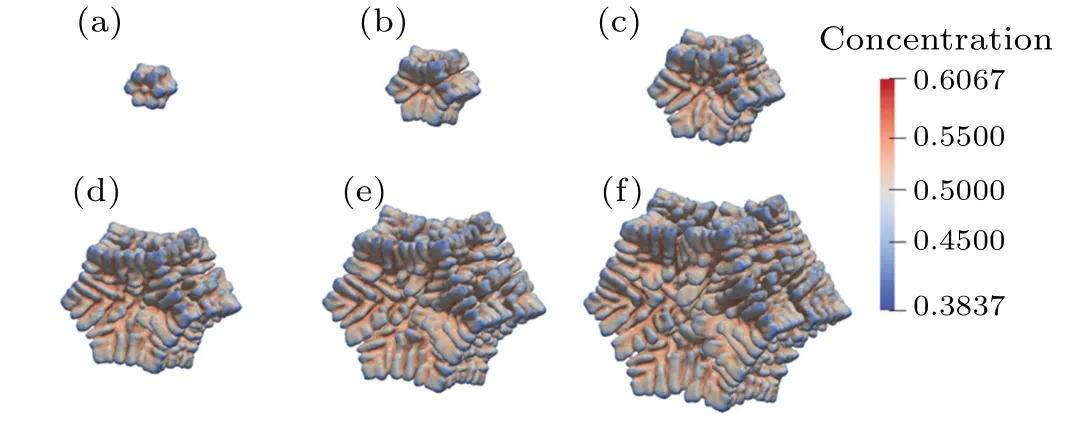
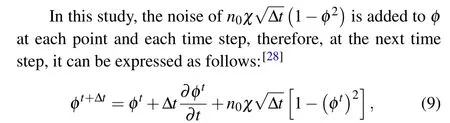
Figure 6 shows the evolutions of solid fraction, dendrite tip velocity, and dendrite tip radius inα-Mg dendrite growth of Mg-5-wt% Zn alloy under isothermal solidification.With dendrite growth, solid fraction increases nonlinearly and the slope of the curve increases gradually, which result from the development of sidebranching.Moreover, since the curve is smooth, the random distribution of sidebranching will not cause a large fluctuation of solid fraction.To avoid the effect of excessive noise on the dendrite tip stability, the magnitude of the noise is set ton0=0 when calculating the dendrite tip velocity and radius.With dendrite growth,dendrite tip velocity will first increase from 0 to 2.56 and then decrease gradually and stabilize at about 2.24.While the dendrite tip radius will increase gradually, from 0 to 2.2, and stabilize at about 2.2.
4.2.Experimental validation
To verify the accuracy of simulations, simulation results are compared with experimental results as shown in Fig.7.The original ingots with a nominal composition of Mg-5-wt%Zn are fabricated in an electric-resistant furnace under an argon atmosphere by melting high-purity Mg,and Zn at 750?C.Then, the melts are cast into a preheated mold at 200?C when the temperature decreases to 730?C,and the cast alloys each with a diameter of 42 mm and a height of 150 mm are obtained.It can be found that both morphologies ofα-Mg dendrite of experimental and simulation results on the{0001}crystal plane have six primary dendrite arms and develop secondary dendrite arms.The angle between the primary dendrite arms is 60?,and the angle between the primary dendrite arms and secondary dendrite arms is also 60?, therefore, the growth direction of primary dendrite arms and secondary dendrite arms are both〈110〉.Moreover, it can be found that the morphologies ofα-Mg dendrite of experimental and simulation results oncrystal plane have both four primary dendrite arms and undeveloped secondary dendrite arms.The angle between the left primary dendrite arm and the right primary dendrite arm is about 85?,and the angle between the upper primary dendrite arm and the lower primary dendrite arm is about 95?.The growth direction of primary dendrite arm is〈11〉, and since the interaction between secondary dendrite arms,their growth direction will be slightly deflected.

Fig.7.Optical micrographs of α-Mg dendrite of as-cast Mg-5-wt%Zn alloy under air cooling on(a){0001}crystal plane and(b)11?1crystal plane,and morphology of α-Mg dendrite of Mg-5-wt% Zn alloy under isothermal solidification at t=6000?t on(c){0001}crystal plane and(d)11?1 crystal plane.
5.Conclusions
In this study,parameter calculation and result storage for phase-field simulation inα-Mg dendrite growth of Mg-5-wt%Zn alloy is investigated.The main conclusions are as follows.
(i)Key parameters of the phase-field model,such as equilibrium partition coefficientk,liquidus slopem,solutal diffusion coefficient in liquidDl,and solutal diffusion coefficient in solidDsare obtained through the phase diagram and empirical formulas.
(ii) Both the structured grid method and the structured point method can be used to store simulation results.Moreover, using the structured point storage method will reduce about 60% storage space and 37.5% storage time compared with the structured grid storage method.
(iii)The convergent simulation results ofα-Mg dendrite growth are obtained and in good agreement with the optical micrograph of experimental results,verifying the accuracy of parameters and stability of storage methods.
Acknowledgements
Project supported by the National Natural Science Foundation of China(Grant Nos.52074246,52275390,52205429,and 52201146), the National Defense Basic Scientific Research Program of China(Grant Nos.JCKY2020408B002 and WDZC2022-12), the Science and Technology Major Project of Shanxi Province, China (Grant Nos.20191102008 and 20191102007), and the Guiding Local Science and Technology Development Projects by the Central Government,China(Grant Nos.YDZJSX2022A025 and YDZJSX2021A027).

- Chinese Physics B的其它文章
- The application of quantum coherence as a resource
- Special breathing structures induced by bright solitons collision in a binary dipolar Bose–Einstein condensates
- Effect of short-term plasticity on working memory
- Directional-to-random transition of cell cluster migration
- Effect of mono-/divalent metal ions on the conductivity characteristics of DNA solutions transferring through a microfluidic channel
- Off-diagonal approach to the exact solution of quantum integrable systems