Variations of methane stable isotopic values from an Alpine peatland on the eastern Qinghai-Tibetan Plateau
2021-09-10 17:52:54QianGuoHaijunPengBingHongHuYaoYongxuanZhuHanweiDingNingAnYetangHong
Acta Geochimica 2021年4期
Qian Guo? Haijun Peng? Bing Hong? Hu Yao? Yongxuan Zhu?Hanwei Ding? Ning An? Yetang Hong
Abstract Isotopic signature is a powerful tool to discriminate methane (CH4) source types and constrain regional and global scale CH4 budgets.Peatlands on the Qinghai-Tibetan Plateau are poorly understood about the isotopic signature of CH4 due to the limited experimental conditions.In this study,three campaigns of diurnal air samples spacing 2–3 h were taken from an alpine peatland on the eastern Qinghai-Tibetan Plateau to investigate its source signal characteristics.Both CH4 concentration and its stable carbon isotope (δ13C-CH4) were measured to derive the carbon isotopic signature of the CH4 source using the Keeling plot technique.Diurnal variation patterns in CH4 concentration and δ13C-CH4 were observed during summertime,with depleted δ13C-CH4 signals and high CH4 concentration appearing at nighttime.The δ13C-CH4 signature during summer was calculated to be-71% ± 1.3%,which falls within the range of other wetland studies and close to high-latitude peatlands.The boundary layer dynamic and CH4 source were supposed to influence the measured CH4 concentration and δ13C-CH4.Further investigations of CH4 isotopic signals into the nongrowing season are still needed to constrain the δ13C-CH4 signature and its environmental controls in this region.
Keywords Stable carbon isotope · Methane · Alpine peatland · Qinghai-Tibetan plateau · Diurnal variation
1 Introduction
Methane is an important greenhouse gas whose concentration has been rising again since 2007 after a general stabilization (Ueyama et al.2020;Kirschke et al.2013;Nisbet,Dlugokencky and Bousquet 2014;Nisbet et al.2020;Jackson et al.2020).CH4concentration does not include the source type information to determine definitively the causes of this recent rise,while the stable carbon isotope in CH4(δ13C-CH4) could be a powerful tool to provide the source information.It has been suggested that global models should include specific isotopic signatures for wetlands from different regions due to their spatial and temporal variability (Sherwood et al.2017).
Wetlands,especially peatlands,are distributed primarily in boreal and alpine regions (Chen et al.2021).Many studies have reported the δ13C-CH4of wetlands in the high northern latitudes,but tropical and temperate wetlands are still understudied (Thottathil and Prairie 2021;Brownlow et al.2017;Fisher et al.2017).The Qinghai-Tibetan Plateau (QTP) is the largest and highest plateau in the world,with an average elevation of over 4,000 m (Zhang et al.2020;Wang et al.2015).This plateau developed large amounts of peatland owing to its unique alpine environment,which accounts for 49% (5,086 km2) of the total peatland areas and 68% (1.49 Pg C) of total peatland Cstorage in China (Yang et al.2017).The Zoigpeatland,known as the largest alpine peatland in the world,is located on the eastern edge of the QTP (Xiang et al.2009;Yao et al.2011).Besides the high elevation,these peatlands are influenced both by the Indian Summer Monsoon and East Asia Summer Monsoon,making them particularly susceptible to global climate changes(Yang et al.2010;Zhang et al.2021).Most previous studies on CH4emissions of the Zoige?peatland were focused on their inter-annual variations and regional budget estimation (Hirota et al.2004;Chen et al.2009,2013,2021;Song et al.2015;Wei et al.2015;Peng et al.2019).Chen et al.(2021) reported the CH4fluxes characteristics in different periods(especially in the freeze–thaw period) on the Zoige?peatland.Peng et al.(2019) found the diurnal and seasonal variations of CH4fluxes and discussed the key environmental factors that affected the CH4emissions on apeatland.Measurement of changing CH4concentration and δ13C-CH4value could determine sources of CH4on a regional scale(Fisher et al.2006).Due to the limited experimental conditions,few studies were conducted about the δ13C-CH4characteristics of the Zoige?peatland.
Kato et al.(2013) firstly used δ13C-CH4value to help understand the soil CH4consumption and production through the chamber samples in the alpine ecosystems on the QTP.Though chamber measurements can help explain the mechanisms (Zhang et al.2011;Chanton et al.2008,Rao,Bhattacharya and Jani 2008),but cannot provide a consistent isotopic signature to represent larger-scale processes.Recent studies showed that samples from ambient air can contain a well-mixed air above the soil surface and provide a more coherent regional scale δ13C-CH4signature(Fisher et al.2017;Banda et al.2016;Rockmann et al.2016;Morimoto et al.2017).To the present,little is known about the δ13C-CH4signature in ambient air on the Zoige? peatland which could use in large-scale studies.
To obtain the isotopic signature,we deployed an automatic gas sampler near an eddy covariance (EC) CH4flux tower in a peatland on the QTP and used the Keeling plot technique (Keeling 1958) to identify the isotopic inputs of CH4in this region.The research objectives,therefore,are to (1) reveal the temporal variation of the δ13C-CH4from alpine peatlands on the QTP,(2) compare the δ13C-CH4signatures from various peatlands at different latitudes,and(3) lay a foundation for applying this technique to the studies of CH4from other peatlands in China.
2 Materials and methods
2.1 Study site
The study site,Hongyuan Peatland (32°46′N,102°30′E),located around 3 km southwest of the Hongyuan County at an altitude of around 3510 m above sea level,is part of the Zoige?peatlands on the eastern QTP(Fig.1).The dominant plants in this peatland areCarex mulieensisandKobresia tibetica(Peng et al.2019).The mean annual temperature and precipitation are 1.8 °C and 746 mm,respectively(http://data.cma.cn/).The highest monthly mean air temperature is typically observed in July(11.2 °C on average),whereas the lowest is in January with a 30-year mean of-9.4 °C.More than 75% of annual precipitation usually occurs during the growing season from May to September each year.
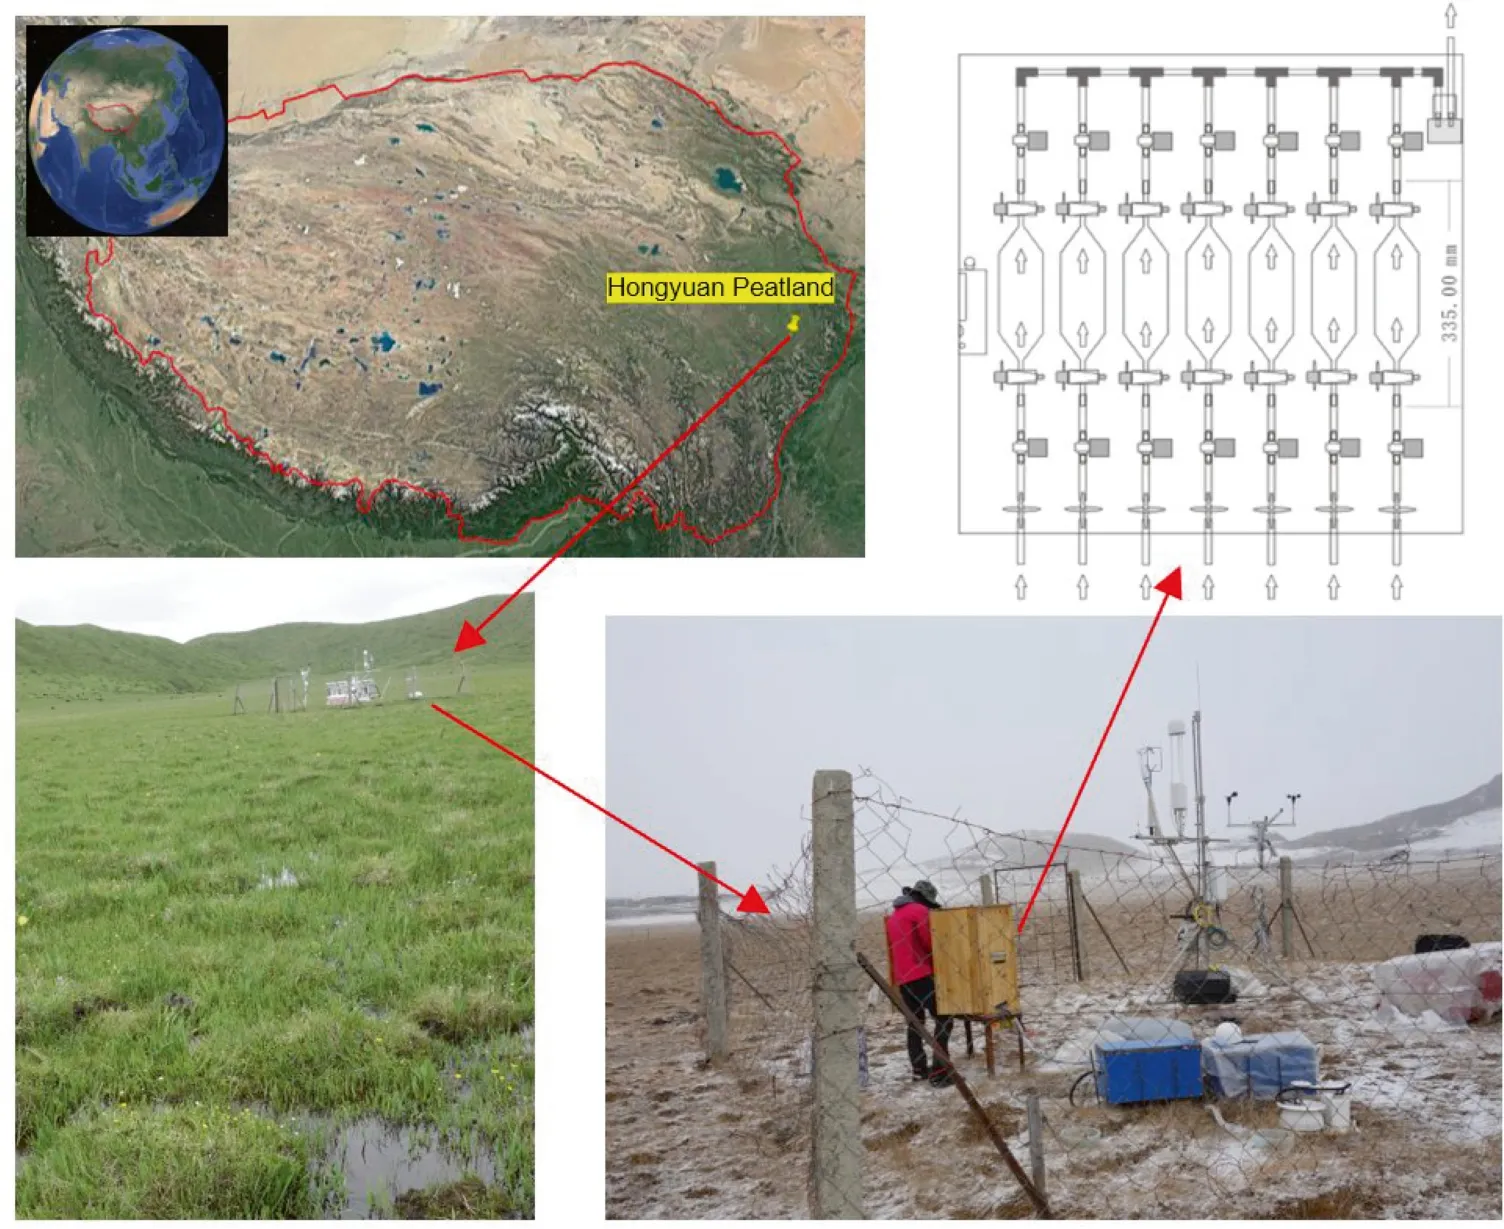
Fig.1 Maps showing the location of QTP (red solid line)and Hongyuan peatland (yellow pin),summer site view of the eddy covariance tower,and the weather station in Hongyuan peatland,automatic air sampler used in this study and its design drawing
2.2 Sampling and analytical procedure
The air samples were collected using an automatic sampler at a height of 50 cm above the soil surface.The sampler was composed of a GSM remote controller,a battery-operated pump(flow rate 4–5 L/min),14 replaceable 300 mL flasks,and the necessary valves (Fig.1).The sampler collects air samples via opening and closing the pump and the valves at the end of the flasks which got command of the GSM controller.Samples were collected in 3 h intervals for 24 h and then shipped to the laboratory for further analysis.
Air samples were first analysed for CH4concentrations using a Gas Chromatograph (GC) with a Flame Ionization Detector system (HP 6890,Agilent Technologies Co.Ltd,USA).Then the rest samples were used to measure δ13CCH4by the Trace Gas pre-concentrator (TG PreCon) and IsoPrime mass spectrometer (GV Instruments,UK).This isotope measurement system had repeatability of better than 0.5%for δ13C-CH4.Air samples firstly entered the TG PreCon system through the dual—ended sample flask.A helium flow (99.999% purity) then transported the air sample through several chemical traps and a liquid nitrogen cryotrap held at -196 °C to remove water,CO,and CO2.The rest sample flowed into the combustion furnace where CH4was oxidized to CO2.The resultant CO2was trapped and cryofocused in the liquid nitrogen and then passed through the GC column to filter out other residual gas substances.Finally,the flow went to the IsoPrime mass spectrometer for isotopic measurement.The isotopic analysis used CO2as the working reference which was calibrated against the MAT 252 mass spectrometer (Finnigan MAT,Germany).Additionally,to make sure there was no significant drift when CH4was oxidized to CO2,several referenced air samples containing the similar CH4concentration were measured before and during the real samples.δ13C-CH4represents the13C/12C ratio in a sample relative to that of the standard(Vienna Pee Dee Belemnite)and are calculated as follows:
where Rsampleand Rstdare the13C/12C ratio of the sample and the standard,respectively.
2.3 Calculating source signature of δ13C-CH4
The Keeling plot technique,first proposed by Keeling(1958),is used for the δ13C-CH4signature calculation.It is based on the following mass conservation:
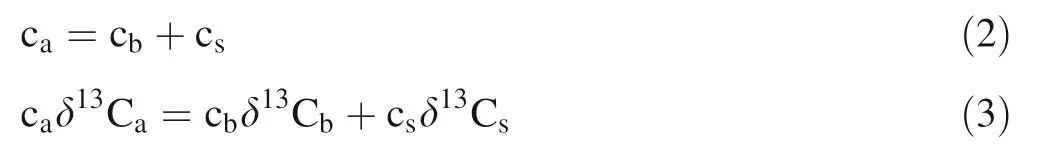
where ca,cb,csare the atmospheric CH4concentration,the background CH4concentration,and source CH4concentration,respectively.δ13C represents the carbon isotope ratio of each CH4.By combining these two equations,a linear regression equation could be used to derive the intercept as the source or mixture source signature by plotting of δ13C versus 1/concentration as follow:
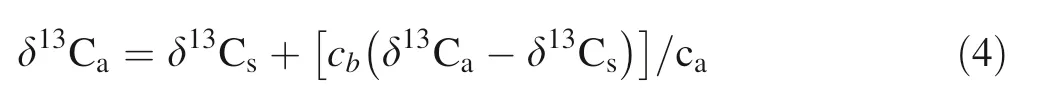
When using this method,it is assumed that there are no variations of δ13C in both background and source during a short observation period,for example,a 24-h period in this study.Additionally,we used the geometric mean regression suggested by Pataki et al.(2003).
2.4 CH4 fluxes and ancillary measurements
Methane fluxes were measured by an eddy covariance system sitting 2.5 m above the ground.This system consists of an open-path infrared CH4analyser (LI-7700,LICOR Inc.,USA),an open-path infrared CO2/H2O analyser(LI-7500A,LI-COR Inc.,USA),and an ultrasonic anemometer (WindMaster Pro,Gill Instruments Limited,UK).The half-hourly average flux was calculated by the EddyPro 5.01software (LI-COR Inc.,USA) (details were provided in Peng et al.(2019)).Other ancillary environmental measurements,including global radiation,air temperature,relative humidity (RH),precipitation,soil temperature at three depths (10,25,and 40 cm below the ground),and soil water content at the depth of 10 cm,were measured and recorded by a HOBO U30 weather station installed near the EC tower (Fig.1) (Peng et al.2015).
3 Results
3.1 Diurnal variations of CH4 and environmental conditions
Three campaigns were deployed during the following three periods:4–5 May,3–4 July,and 2–3 August of 2016.To test the reliability of air samples from flasks during the sampling and transportation process,we first compared the CH4concentrations measured by the EC system and GC system.From Fig.2,there is a good match of CH4concentrations detected by these two methods (R=0.81,p<0.0001) and the air samples could well capture the variations in CH4concentrations during the three campaigns,especially during 3–4 July and 2–3 August.Therefore,we can ignore the deviation of the samples that may occur during the sampling and transportation process.
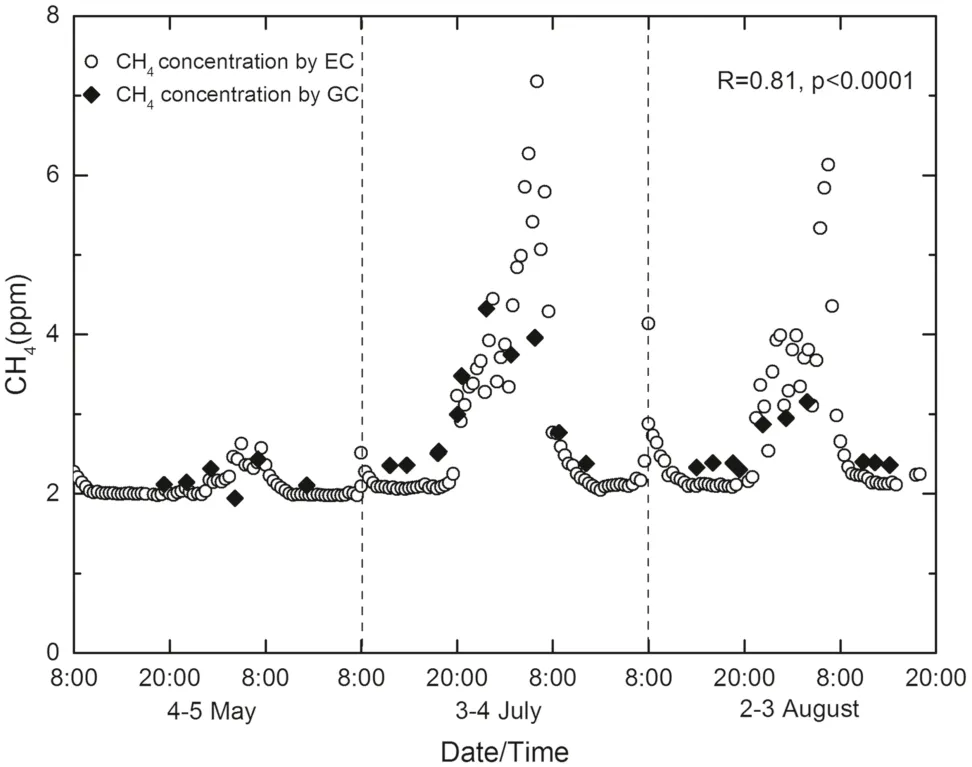
Fig.2 CH4 concentrations measured by the LI-7700 analyser and the GC system
The CH4concentrations and δ13C values are shown in Fig.3a,b,c.Clear diurnal patterns in CH4concentrations were observed during 3–4 July and 2–3 August,whereas no similar variation of CH4concentrations was seen in 4–5 May.The lower CH4concentrations were measured in the daytime and the higher CH4concentration in the nighttime during 3–4 July and 2–3 August.The CH4concentration ranged from 1.95–4.32 ppm during the three campaigns.The lowest concentrations were observed during 4–5 May,ranging from 1.95–2.43 ppm,while the higher values were observed in 3–4 July and 2–3 August,ranging from 2.36–4.32 ppm and from 2.3–3.16 ppm,respectively.From Fig.4a,the largest daily amplitude (1.97 ppm) was observed during 3–4 July,and smaller daily amplitudes were seen during 4–5 May (0.49 ppm) and 2–3 August(0.85 ppm).The average CH4concentration were 2.18,3.04,and 2.55 ppm in May,July,and August,respectively.
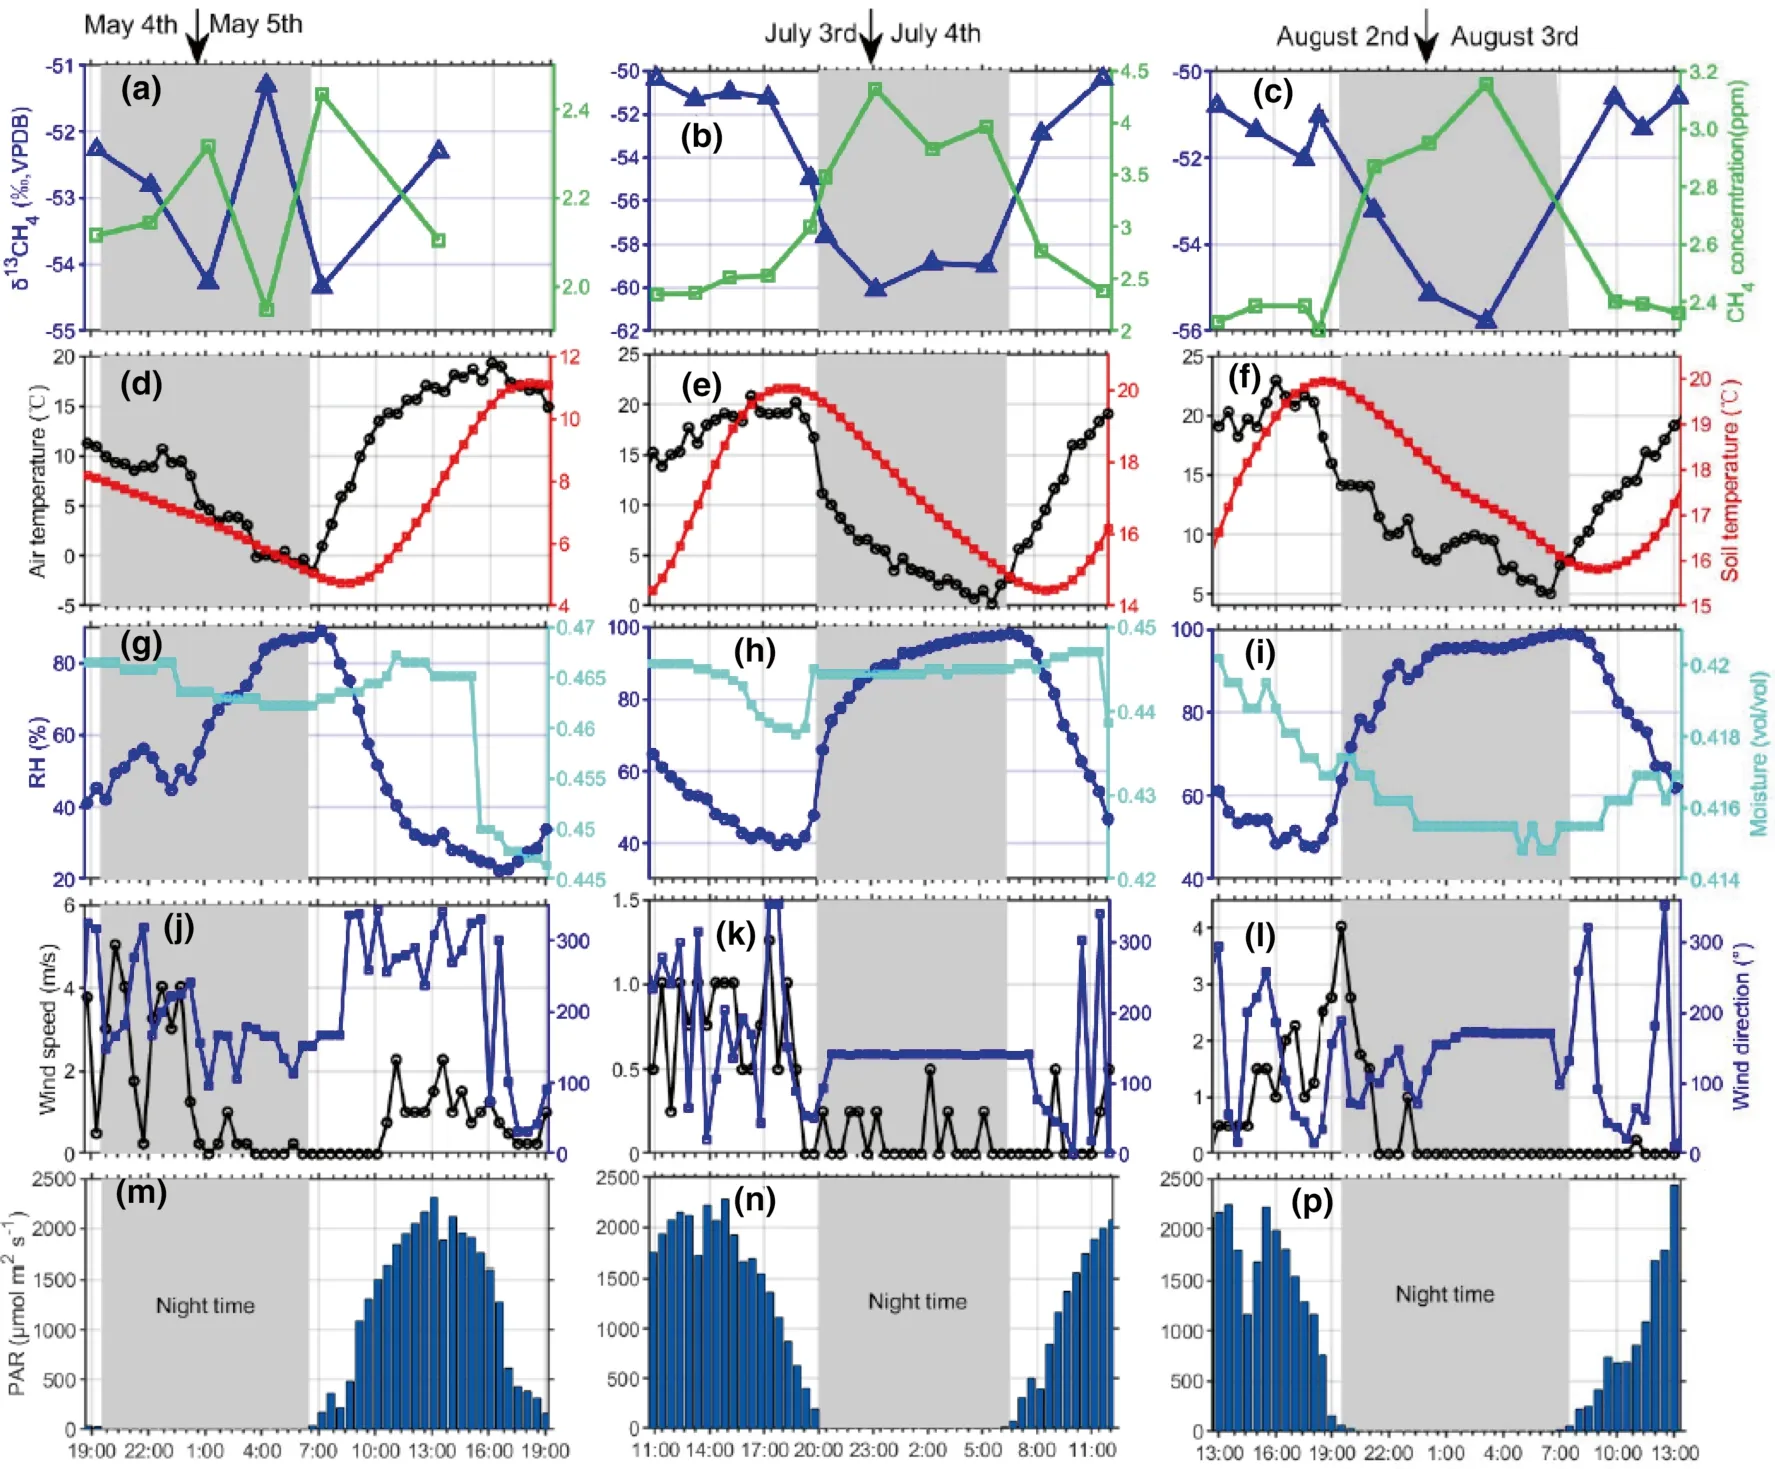
Fig.3 Diurnal variations in δ13C-CH4,CH4 concentration,and environmental factors during the three campaigns(Beijing time,GMT+8).a,b and c are δ13C-CH4 and CH4 concentration; d,e,and f are air temperature and soil temperature at the depth of 10 cm;g,h,and i are relative humidity (RH) and moisture; j, k,and l are wind speed and wind direction; m, n,and p were photosynthetically active radiation (PAR)
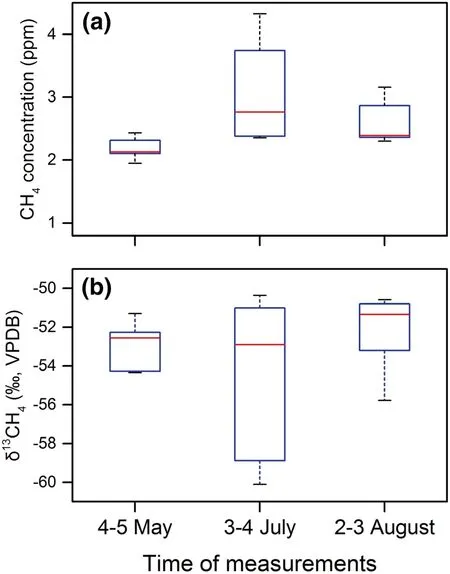
Fig.4 Box and whisker showing a CH4 concentrations,and b δ13CCH4 of air samples during the three campaigns.Red lines represent median values
The δ13C-CH4was tightly concomitant with the variations in CH4concentrations (Fig.3a,b,c).The higher δ13C-CH4was measured in the daytime and the lower δ13C-CH4in the nighttime.The δ13C-CH4ranged from-54.34% to -51.3%,-60.1% to -50.37% and -55.78%to -50.59% in 4–5 May,3–4 July,and 2–3 August,respectively.From Fig.4b,the largest daily amplitude was seen during 3–4 July,with the value of 9.73%,and smaller daily amplitudes were seen during 4–5 May and 2–3 August,with the values of 3.04% and 5.19%.The average δ13C-CH4were -52.88%,-54.35% and -52.18% in 4–5 May,3–4 July,and 2–3 August,respectively.
Both the air temperature and soil temperature at the depth of 10 cm showed similar diurnal changes with an increase in the daytime and a decrease in the nighttime(Fig.3d,e,f).The average air temperature was 9.8,11,13.3 °C in 4–5 May,3–4 July,and 2–3 August,respectively,ranging from -1.6 to 19.3 °C,0–20.9 °C,5–23 °C in 4–5 May,3–4 July and 2–3 August,respectively.Average soil temperature was 7.3,17,17.7 °C,varying from 4.7–11.1 °C,14.4–20 °C,15.8–20 °C in May,July,and August,respectively.
The daily-average relative humidity(RH)was relatively low in 4–5 May (53%) and increased to 72% and 78% in 3–4 July and 2–3 August,respectively (Fig.3g,h,i).Accordingly,the RH showed similar trends in 3–4 July and 2–3 August with a rapid increase and then stay at high values in the nighttime and a relatively slow decrease in the daytime.While the trend in 4–5 May was a relatively slow increase to reach a peak in the daytime and gradually decreased in the nighttime.The diurnal changes in moisture were,on average,0.462,0.444,and 0.417 vol/vol,respectively,varying from 0.446–0.467 during 4–5 May,from 0.437–0.447 during 3–4 July,and from 0.415–0.42 during 2–3 August,which appeared to decrease from May to August (Fig.3g,h,i).
The diurnal variations of wind speed were quite different among the three campaigns (Fig.3j,k,l).For the campaign on 4–5 May,the wind speed was variable quickly from higher values to lower values (<2 m/s)during the first half of the night and then dropped to the lowest wind speed until the end of the next daytime,while low wind speed occurred(<2 m/s)during all night of 3–4 July and 2– August (Fig.3j,k,l).Wind direction was almost constant in the nighttime of 3–4 July and 2–3 August while was highly variable in the nighttime of 4–5 May.Photosynthetically active radiation (PAR) showed a clear diurnal pattern with a progressive increase in the daytime,which was similar to the change of the air temperature (Fig.3m,n,p).
3.2 Long-time variations of CH4 and environmental conditions
CH4flux and environmental variables from May to August of 2016 were all shown in Fig.5.CH4flux showed a distinct increase from May to August(Fig.5a),with the peak occurred from July to August.δ13C-CH4values were more depleted in July than those in May and August.Daily mean air temperature became higher in July and August compared with that in May.Soil temperature from different depths also showed an increase in July and August than in May.PAR showed a constant oscillation during the observation time.More precipitation occurred from July to August than that in May.Soil moisture at the depth of 10 cm was influenced by both soil temperature and precipitation (Peng et al.2019).
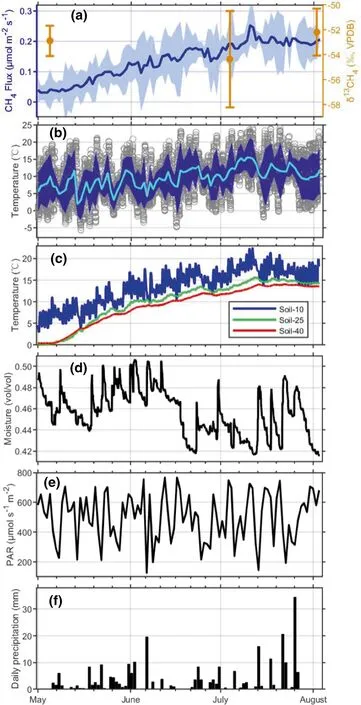
Fig.5 a CH4 flux(the blue line stands for daily mean fluxes and the shaded area denotes the standard deviation for each halfhour interval) and measured δ13C-CH4 of the three campaigns, b air temperature(the grey circles are the halfhourly observation,the light blue line shows the daily mean air temperature and the shaded area represents the standard deviation for each half-hour interval,c soil temperature at the depth of 10,25,and 40 cm,respectively, d soil moisture at the depth of 10 cm,e PAR and f daily precipitation from May to August of 2016
4 Discussion
4.1 Diurnal patterns of CH4 concentration and δ13C-CH4
The campaigns on 3–4 July and 2–3 August had obvious diurnal variations and large variation ranges in both CH4concentration and δ13C-CH4,while the campaign in 4–5 May showed unclear diurnal change and a small variation range of CH4concentration and δ13C-CH4(Fig.3)(Fig.4).In addition,the CH4concentrations and CO2concentrations measured by the EC system on this study area had similar diurnal cycles(Fig.6).These results may represent that the variations of methane were mainly influenced by the boundary layer dynamic on the daily scale and influenced by the emitting source on the long-time scale(Lowry et al.2001).
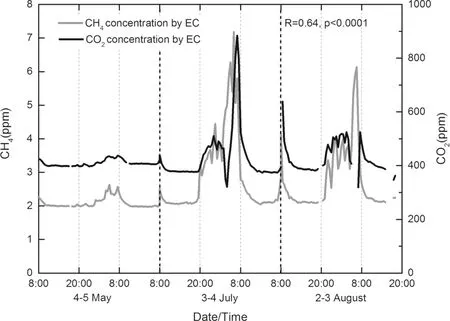
Fig.6 CH4 concentrations and CO2 concentrations measured by the EC system
For the daily scale,the variation of boundary layer height cannot directly affect the CH4 concentrations and δ13C-CH4from the source but can affect the observation of methane build-up in the ambient air.In general,an overnight build-up of CH4 concentration occurs during stable nocturnal boundary layer after sunset and disperses into the expanding boundary layer when temperature inversion broke during sunrise.Lowry et al.,(2001) pointed out that the large variation of air temperature under the conditions of low wind speed could lead to the development of strong low-level inversion.Therefore,the beneficial meteorological condition could be helpful to observe an obvious build-up of methane.Our results showed that the three campaigns all had a large variation in air temperature,but the low wind speed of nighttime only occurred during 3–4 July and 2–3 August(Table 1),which could significantly slow down the mixing of CH4 concentration.During the campaign of 4–5 May,we did not observe a strong nighttime build-up of methane,possibly because of the lack of development of a stable nocturnal boundary layer (Sriskantharajah et al.2012).In addition,the small amount of observation data during 4–5 May may also not capture the obvious build-up of methane.For the long-time scale,the variation of the methane may affect by the source and will discuss in the next section.
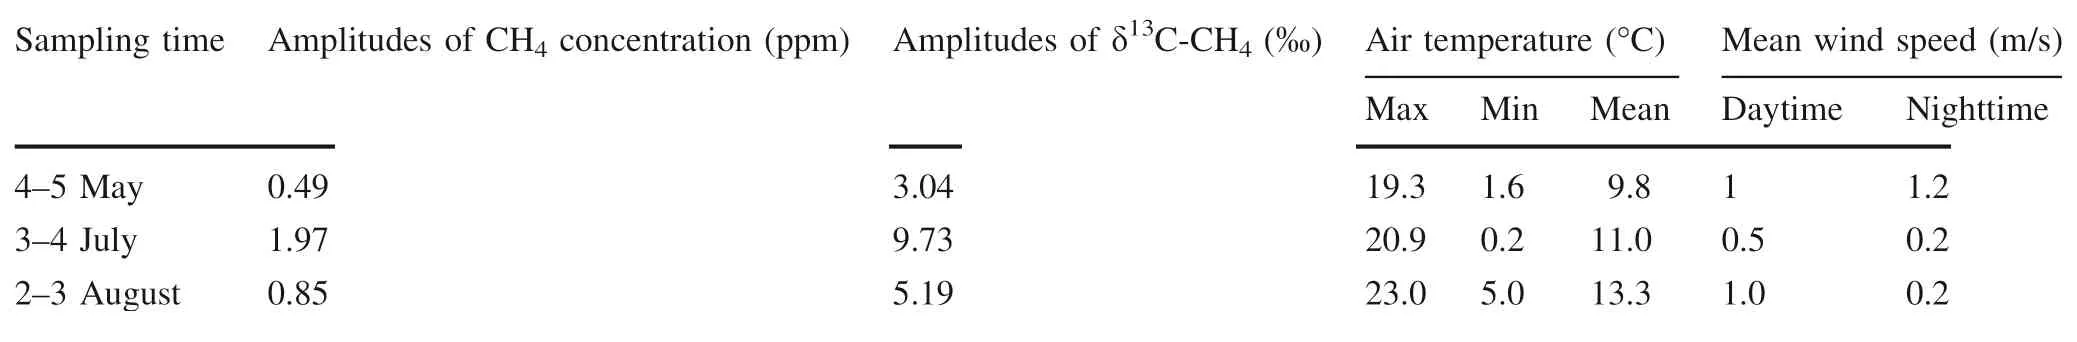
Table 1 CH4 concentration,δ13C-CH4,air temperature,and wind speed during the observation period
4.2 Identification of δ13C-CH4 signatures and their variations
Based on the Keeling plot technique,δ13C-CH4signatures were derived from the three campaigns(Fig.7).The δ13CCH4signature was -68.30% ± 1.6%,-2.39% ± 0.8%and 69.49% ± 1.8% for 4–5 May,3–4 July,and 2–3 August,respectively.The δ13C-CH4signature of 3–4 July showed the most depleted value compared with the other two campaigns.To compare with other wetland studies,we put all the data from the three campaigns together and found that the data from 3–4 July and 2–3 August had a better correlation (R=0.98,p<0.0001) when excluded the data during 4–5 May,therefore we derived a summer δ13C-CH4signature of 71% ± 1.3% for this study area(Fig.7d).
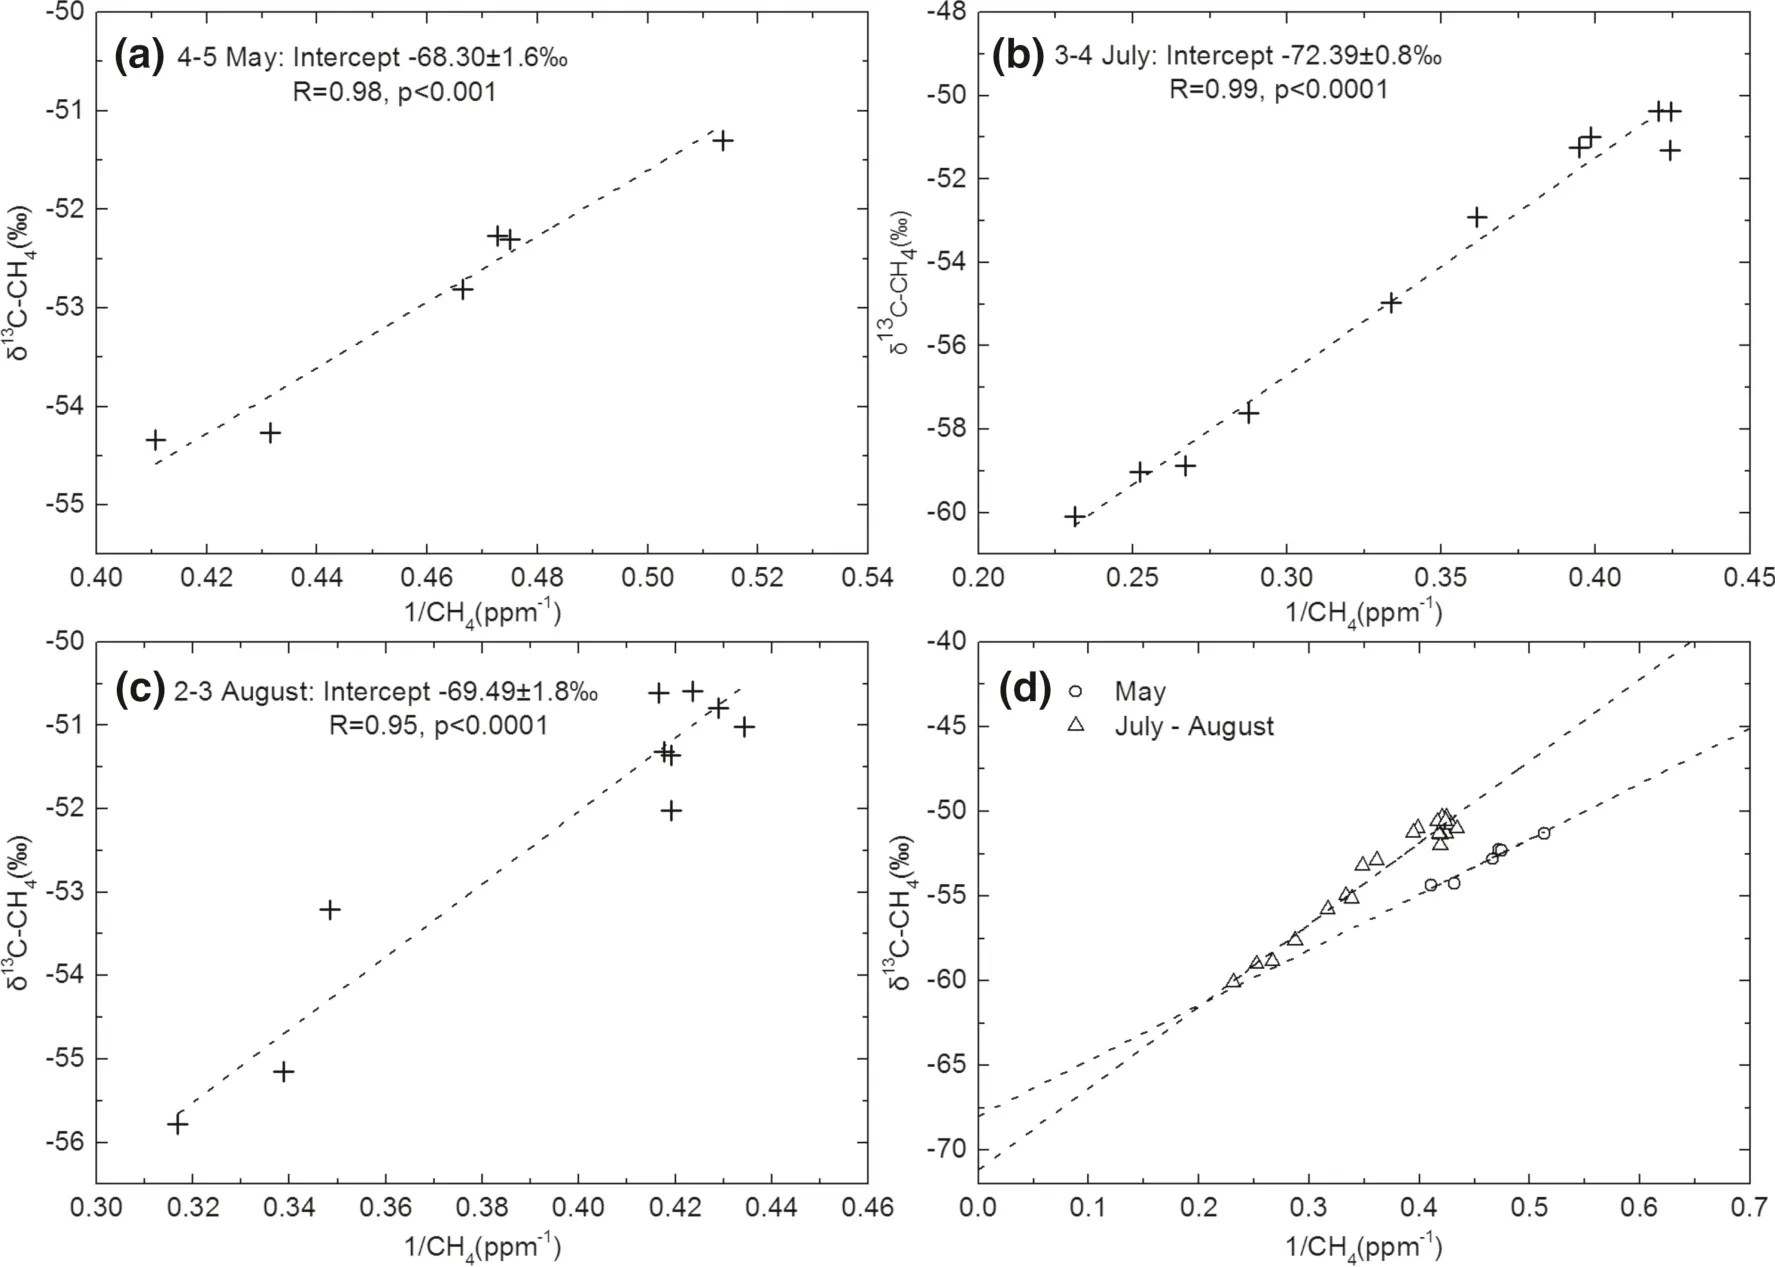
Fig.7 Keeling plots for each campaign and their comparison.a-c Three cases during 4–5 May,3–4 July,and 2–3 August,d Results during May and results combined with data of July and August.The intercepts of the y-axis represent the carbon isotopic signature of methane inputs in this region
During 4–5 May,the measured CH4concentration was significantly lower than those in summer and the δ13C-CH4signature showed an approximate 3% increase compared with the summer signature,which may imply a potential variation of methane from source on a long-time scale.It has been noted that both the CH4production process and its transport path can affect its δ13C-CH4composition(Conrad 2005;Popp et al.1999).Sriskantharajah et al.(2012)observed that δ13C-CH4emitted in the spring thaw was more enriched in δ13C than that in summer from a subarcticwetland,which is similar to this study.Rao et al.(2008)also found a significant seasonal change of δ13C-CH4over the paddy fields,with enriched δ13C-CH4at the beginning and the end of the growing season,and depleted δ13C-CH4before harvesting.In this study,the plants haven’t started to grow in 4–5 May,and CH4flux was quite low and other environmental factors were distinctly different from those during summer (Fig.5),which may result in the lower emitted CH4concentration.During July to August,CH4flux almost reached the peak values and biomass growth provided more substrates input in the form of root exudates to the anaerobic microbial community compared with the original substrates in May(Bergman,Klarqvist and Nilsson 2000),which lead to an increase of CH4concentration and more depleted13C in the emitted CH4.In addition,part of the produced CH4can be transported into the air by abundant aerenchyma,this could also cause significant fractionation and thus result in the depletion in δ13C-CH4in summer (Schütz and Rennenberg 1991;Chanton 2005;Happell et al.1993).Since the data of this study were too small to further test the seasonal variation of δ13C-CH4in this region,more investigation should be done in the future study,especially in the non-growing season.
4.3 Global wetland δ13C-CH4 signatures comparison
To our best,we compiled the existing published data of the δ13C-CH4from wetlands at different latitudes,the results show that δ13C-CH4signatures at lower latitude are around-60%,e.g.,Amazon floodplain(53%),Florida Everglades(-55%),Thailand Swamp(66.1%)and Minnesota peatland(-67%),whereas at high latitude,δ13C-CH4signatures are around -70% (Table 2).Ganesan et al.,(2018) also found a large difference of 10%between boreal signature(67.8%)and tropical signature (56.7%) from wetlands using the inverse model.It seemed that δ13C-CH4signatures from high latitude are more depleted in13C than those from lower latitude.
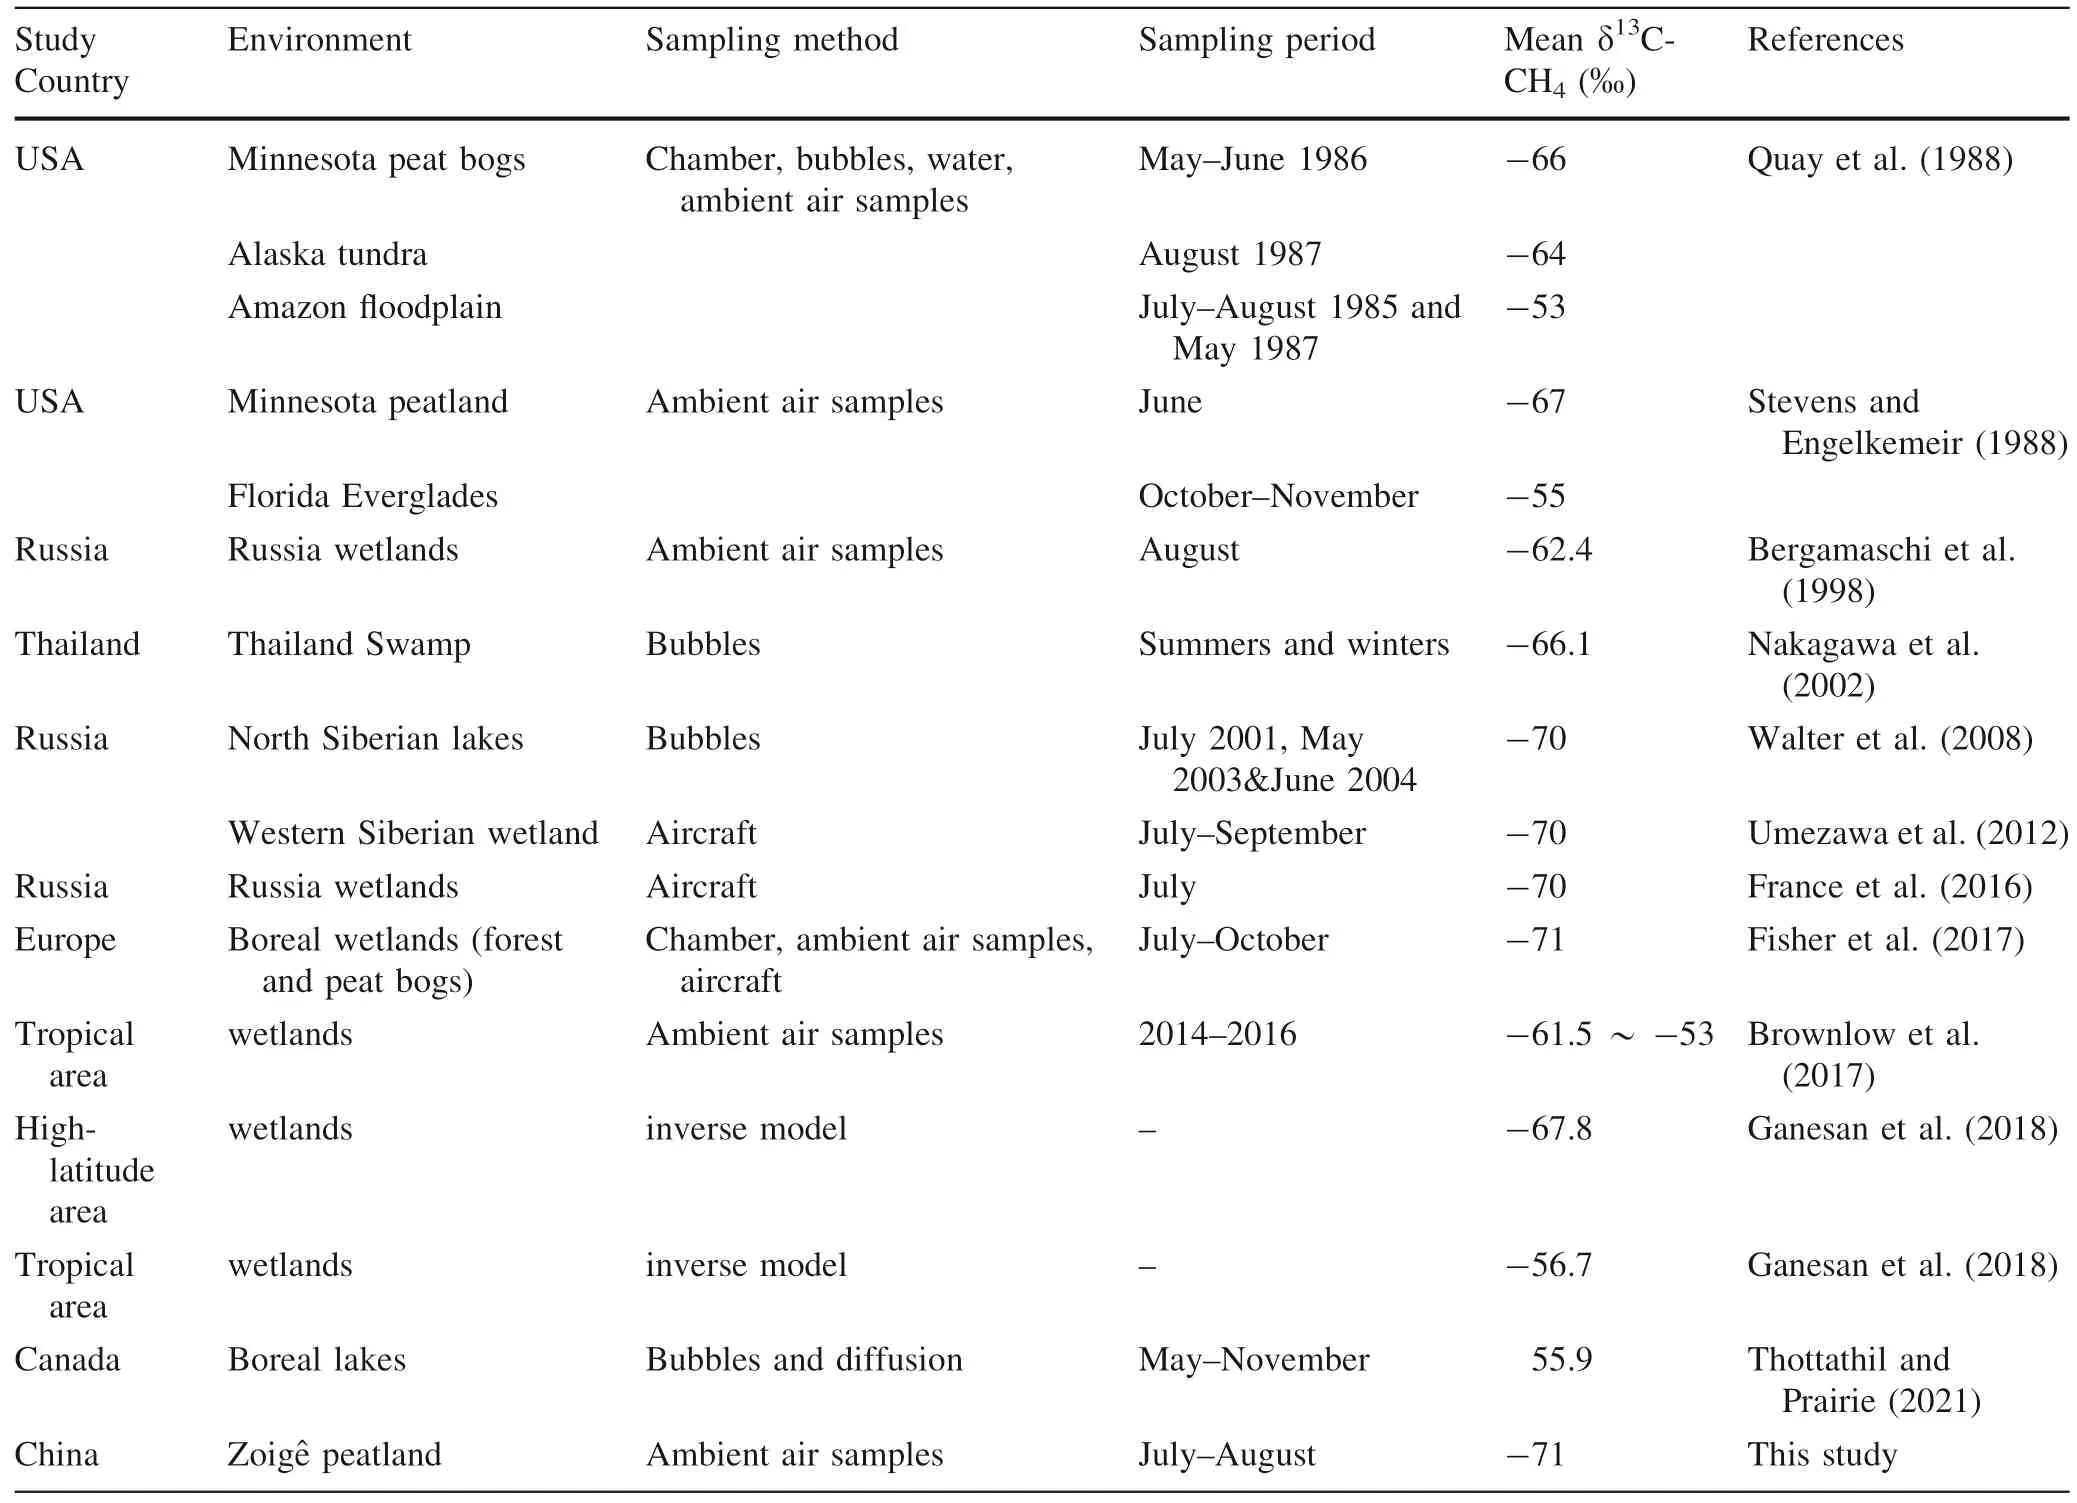
Table 2 Comparison with δ13C-CH4 from other published studies
Though the location of Hongyuan Peatland belongs to the mid-latitude area,the summer δ13C-CH4signature of-71% is much closer to those of the high-latitude studies.This could be explained by the low air temperature and alpine environment,which are similar to the boreal wetlands at the high latitude rather than the warm wetlands at the low latitude.For boreal wetlands at the high-altitude,the depleted δ13C-CH4could be attributed to the following reasons:(1)the13C of the organic material in the sedimentsis more depleted at high latitudes due to a temperature dependence of kinetic and equilibrium isotope effects that occur during photosynthesis (Stevens and Engelkemeir 1988);(2) high-altitude wetlands have thinner oxic layers than those at low latitude,which could lead to less CH4oxidation (Brownlow et al.2017);(3) the differences in methanogenic communities could also lead to the depletion of13C (Fisher et al.2017).
5 Conclusions
In this study,carbon isotopic signatures of CH4in a Zoige? alpine peatland are determined via collecting air samples upon the soil surface from May to August of 2016.CH4concentration measured by the LI-7700 open-path analyser is in line with that measured by the GC system.Clear diurnal variation patterns of CH4concentration and δ13CCH4were observed throughout the study period,which was mainly influenced by boundary layer dynamics.Long-time variations in CH4concentration and δ13C-CH4may be dominated by the CH4source.Our results provide a nonintrusive method to employ the source signature of methane and give a summer δ13C-CH4signature of -71%of the QTP peatland which is close to the signature at the high-latitude area.However,more investigations into longtime,especially non-growing season,of δ13C-CH4variation patterns in this understudied region are still required to decipher the regional CH4source signature and their environmental controllers.
Author contributionsH.P.and B.H designed the study.Q.G.,H.Y,and H.D conducted field works.Q.G.,Y.Z.,and N.A.conducted laboratory analysis.Q.G.and H.P.conducted data analysis and wrote the first draft of the manuscript.All co-authors were involved in the discussion and revising of the manuscript.
FundingThis research was financially supported by the Strategic Priority Research Program of Chinese Academy of Sciences (Grant No.XDB40010000),the National Natural Science Foundation of China (Grant Nos.41907288,41673119,and 41773140),and the Science and Technology Foundation of Guizhou Province(Grant Nos.[2019]1317 and[2020]1Y193).H.P.was supported by the‘Light of West China’ Program and the CAS Scholarship.
Declaration
Conflict of interestThe authors declare that they have no conflict of interest.
- Acta Geochimica的其它文章
- Is bicarbonate directly used as substrate to participate in photosynthetic oxygen evolution
- Coupling effects of hydrological characteristics and nutrient load in sediments on the trophic state of reservoirs
- Geochemical constraints and uranium potential of the younger granitic rocks in El Maghrbia area,Central Eastern Desert,Egypt
- Carboniferous tectono-magmatic evolution of the northern Luliang arc:evidence from geochemistry and petrography of Carboniferous volcanic rocks in the northern Luliang Uplift,NW China
- Geochemistry and spectrometric prospection of younger granites and granitic pegmatites bearing uranium mineralization at G.Kab El Rakeb area,Central Eastern Desert,Egypt
- Zinc,copper,and strontium isotopic variability in the Baiyangping Cu–Pb–Zn–Ag polymetallic ore field,Lanping Basin,Southwest China