Detailed explanation of textile and apparel foreign trade in the first 7 months
2020-11-28 07:31:28byZhaoXinhua
China Textile 2020年6期
by Zhao Xinhua
Trade data
In July, the total import and export value of national trade in goods was USD 412.93 billion, an increase of 3.4% year-on-year (the same below), of which exports were USD 237.63 billion, an increase of 7.2%, and imports were USD 175.3 billion, a decrease of 1.4%. The trade surplus for the month was USD 62.33 billion. From January to July, the total import and export value was USD 244.263 billion, a year-on-year decrease of 4.8%, of which exports were USD 133.638 billion, a decrease of 4.1%, imports were USD 110.625 billion, a decrease of 75.7%, and a cumulative surplus of USD 230.13 billion was achieved.
In July, the textile and apparel trade value was USD 33.79 billion, an increase of 13.2%, of which exports were USD 31.77 billion, an increase of 15.5%, and imports were USD 2.03 billion, a decrease of 13%. The trade surplus for the month was USD 29.74 billion, an increase of 18.1%. From January to July 2020, the textile and apparel trade volume was USD 172.08 billion, a year-on-year increase of 3.5%. Among them, exports were USD 159.1 billion, an increase of 4.8%; imports were USD 12.98 billion, a decrease of 10%, and the cumulative trade surplus was USD 146.12 billion, an increase of 6.4%.
Trade characteristics
From January to July 2020, the import and export of textiles and apparel presented the following characteristics:
Exports achieved growth for four consecutive months, and bulk commodities showed a trend of recovery.
From April to July, exports of textiles and apparel have achieved growth for four consecutive months. At the beginning of the third quarter, exports in July increased by 15.5% year-on-year and 8% month-on-month respectively. The growth was mainly driven by anti-pandemic materials. At the same time, the export of traditional bulk commodities also gradually improved. Although the export value of the three major categories of yarns, fabrics and apparel still registered negative growth in July, the decline was significantly narrower than the previous period.
General trade exports maintained rapid growth, with private enterprises taking the lead.
General trade exports achieved double-digit growth for four consecutive months, with an increase of 20.3% in July and a cumulative increase of 8.9% from January to July. Processing trade continued to decline, with a drop of 24% in July, and a cumulative drop of 30.8% from January to July.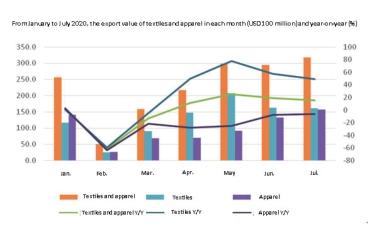
In July, market demand rebounded slightly. The export decline of bulk commodities, including yarn, fabrics, and knitted garments, except for anti-pandemic materials, slowed down compared with the previous period, but still failed to resume growth. From January to July, the cumulative decline of the three major categories of commodities was 31.3%, 27.4% and 18.1% respectively.
Guangdong exports rebounded rapidly, while Beijing and Hubei continued to grow at a high level.
Since the second quarter, Guangdongs performance has been outstanding. From April to July, exports achieved continuous rapid growth. In July, the growth rate climbed to 60.4%. From January to July, the cumulative growth rate was 20.5%, ranking first among the top five export provinces and cities. Zhejiang and Jiangsu decreased by 5.4% and 7.6% respectively, while Shandong and Shanghai increased by 6.3% and 15.8% respectively.
The exports of Beijing and Hubei increased by 288.2% and 142.8% respectively in July, and the cumulative increase from January to July was 267% and 131.5% respectively.
The decline in imports shows that it will take time for the industry to recover.
In contrast to exports, textile and apparel imports have continued to decline for four months, and there is still no trend of recovery. In July, it fell by 13%, of which yarn fabrics fell by 20.2%, and knitted and woven garments fell by 11.6%. From January to July, cumulative imports fell by 10%, of which yarn fabrics fell by 27%, and knitted and woven garments fell by 10%.
There is a certain correlation between current imports and later exports. In particular, the slow rebound in imports of intermediate goods indicates to a certain extent that apparel exports in the later stages may weaken and lack growth momentum.
Cotton imports rebounded rapidly, with American cotton accounting for more than one-third.
In July, cotton imports continued to rebound rapidly, with imports of 148,000 tons that month, an increase of 64% from June, and the year-on-year decline narrowed to 9.2%. From January to July, a total of 1.047 million tons were imported, a decrease of 22% yearon-year. Among them, the United States was the largest source of imports. The cumulative import from the United States was 391,000 tons, an increase of 40.4%. The proportion of American cotton rose to 37%, of which two-thirds reached in July.
The China Cotton Association analyzed that in July, the national economy continued to recover steadily. Although the area of cotton has declined, the output has increased steadily. The cotton reserve meets market demand. The Xinjiang pandemic affected the export of Xinjiang cotton, and domestic spot prices rose. The textile market is in the off-season, raw material stocks remain low, and the decline in cotton commercial stocks has narrowed. Cotton imports continue to grow, foreign pandemics continue, droughts in the American cotton regions have developed, and Sino-US conflicts have escalated again. Affected by many factors, international cotton prices fluctuate frequently. At the end of the month, the China Cotton Price Index (CCIndex3128B) was 12,319 yuan/ton, an increase of 453 yuan from the end of the previous month; the monthly average price was 12,156 yuan/ton, a month-on-month increase of 198 yuan and a year-on-year decrease of 1,994 yuan. Chinas imported cotton price index FC Index M was 69.6 cents per pound each month, up 1.29 cents from the previous month. At the end of the month, it was 69.62 US cents/lb, higher than 1.87 US cents/lb at the end of the previous month. The 1% tariff was discounted to RMB 12,176/ton, which was lower than the domestic spot price of RMB 143 during the same period. The price difference between domestic and foreign cotton increased by 145 yuan from the end of the previous month.
- China Textile的其它文章
- PEACEBIRD Fashion Headquarter—a new China fashion landmark
- 2020 Ningbo fashion festival kicked off on October 22nd
- 31st edition of Milano Unica:A bold signal of a comeback
- “Nothing New, Everything New”:Heimtextil presents the 2021/2022 trends
- Why is Bangladesh overtaken by Vietnam in global garment exports?
- The cotton import sliding-scale duty quotas have shrunk by half this year,and the changes worthy of attention are more than this!