Detection of Apple Marssonina Blotch with PLSR, PCA, andLDA Using Outdoor Hyperspectral Imaging
2020-05-07 09:10:26SooHyunParkYoungkiHongMubarakatShuaibuSangcheolKimWonSukLee
光譜學與光譜分析
2020年4期
Soo Hyun Park, Youngki Hong, Mubarakat Shuaibu, Sangcheol Kim, Won Suk Lee*
1. Department of Agricultural and Biological Engineering, University of Florida, Gainesville, FL 32611, United States 2. Department of Agricultural Engineering, National Academy of Agricultural Science, RDA, Jeonju 55365, South Korea 3. Smart Farm Research Center, Korea Institute of Science and Technology (KIST) Gangneung-si, Gangwon-do 25451, South Korea
Abstract In this study, hyperspectral images were used to detect a fungal disease in apple leaves called Marssonina blotch (AMB). Estimation models were built to classify healthy, asymptomatic and symptomatic classes using partial least squares regression (PLSR), principal component analysis (PCA), and linear discriminant analysis (LDA) multivariate methods. In general, the LDA estimation model performed the best among the three models in detecting AMB asymptomatic pixels, while all the models were able to detect the symptomatic class. LDA correctly classified asymptomatic pixels and LDA model predicted them with an accuracy of 88.0%. An accuracy of 91.4% was achieved as the total classification accuracy. The results from this work indicate the potential of using the LDA estimation model to identify asymptomatic pixels on leaves infected by AMB.
Keywords Apple Marssonina blotch; Hyperspectral imaging; PLSR; PCA; LDA
Introduction
AppleMarssoninablotch(AMB), caused by the fungusDiplocarponmali, is one of the most severe apple diseases known and it is widely distributed in South Korea[1-2]. Symptoms initially appear as brownish spots which later become darker and surrounded by chlorotic regions. The disease leads to defoliation during the growing season, thereby weakening tree vigor and diminishing fruit yield and quality[3]. AMB mainly infects leaves, but in severe situations, it can also attack twigs and fruits. The disease poses a serious problem to major apple producing regions due to the fact that it occurs in consecutive years and it is difficult to detect and control[4-5]. The early symptomatic stage of the disease is particularly challenging to detect by the human eye and symptoms might differ significantly by apple variety. Worst still, even if it is detected and sprayed with fungicides at the early symptomatic stage, it might be too late to save the tree owing to the fast developing speed of AMB. Due to these challenges, most Korean apple growers spray AMB fungicides in advance of favorable conditions for disease infection before the summer months[6]. This could lead to a waste in the use of fungicides, enhance fungicide resistance and also lead to environmental pollution. As a result, the development of AMB detection methods and determination of optimal timing for fungicide spray are needed to reduce fungicide usage.
Nondestructive measurement techniques have been developed to overcome the disadvantages of the conventional invasive methods, in recent years, hyperspectral imaging technology has been developed as an effective inspection tool for quality and safety assessment of a variety of agricultural products[7-10]. It is generally non-destructive, reliable, and carries abundant data. There are several studies concerning the application of this technique for sensing fungal diseases including detection of black spots on citrus[11-12], fungal inspection in stored canola[13], fungal infection and development in corn kernels[14-15], damages by Fusarium in wheat and oats kernels[16-17], and black pox symptom on apple surface. These studies have shown the feasibility of hyperspectral imaging for identifying symptoms in crops through image or spectroscopic processing. However, the potential of hyperspectral imaging technique has not yet been studied in the detection of AMB in apple tree leaves. Thus, the main objective of this study was to develop detection methods for AMB diseased leaves using hyperspectral images. The specific objective of the study was to investigate various classification and estimation methods for separating healthy, asymptomatic and symptomatic regions on apple leaves using spectral reflectance data.
1 Experimental procedure
1.1 Experimental setup and data acquisition
The experimental apple orchard from which hyperspectral images were acquired was located in the Apple Research Institute at Gunwi, Gyeongsangbuk-do province, South Korea. The apple cultivar used in this study was Fuji/M.9; the trees were inoculated with AMB spores three months before data acquisition. A cluster comprising of twelve leaves on a single tree branch was selected to be imaged for this study and was imaged once every five to nine days between October 14 and October 28, 2014. This was done so as to track the progression of the disease on the leaves.
A hyperspectral camera (PS-V10E, Specim, Finland) was used in acquiring hyperspectral images for the range of 400~1 000 nm and it is shown in Fig.1. The hyperspectral camera was mounted on a tripod of 70 cm in height. A black cloth was placed on the ground to prevent confusing weeds for apple leaves. A reflectance panel, with 99% reflectance , was placed on the black cloth for radiometrically correcting the images to reflectance. Images were exported to the Environment for Visualizing Images (ENVI version 5.2, EXELIS, Colorado, USA) software for further processing and extraction of reflectance spectra.
Pixels on the apple leaves were classified into four classes: healthy green leaf (HG), healthy green vein (HGV), AMB asymptomatic (ASYM), and AMB symptomatic (SYM). The number of pixels extracted for each class is given in Table 1. The reason why HGV was included as one of the classes was because its color was similar to the color of the early symptomatic pixels. HG pixels were collected from regions far away from the symptomatic area, and HGV pixels were collected in the vein regions of the leaves. ASYM pixels were chosen from the earlier image than an image which had a developing symptomatic or new symptomatic pixels. According to the hyperspectral images acquired over time, features of developing AMB symptoms appeared as shown in Fig.2. Based on the overlapped symptomatic image of 3 stage images by time, ASYM pixels were chosen from the not-overlapped area as shown in Fig.3. In addition, pixels at the same location of the same leaf where new symptoms occurred one week later were also selected as ASYM pixels.
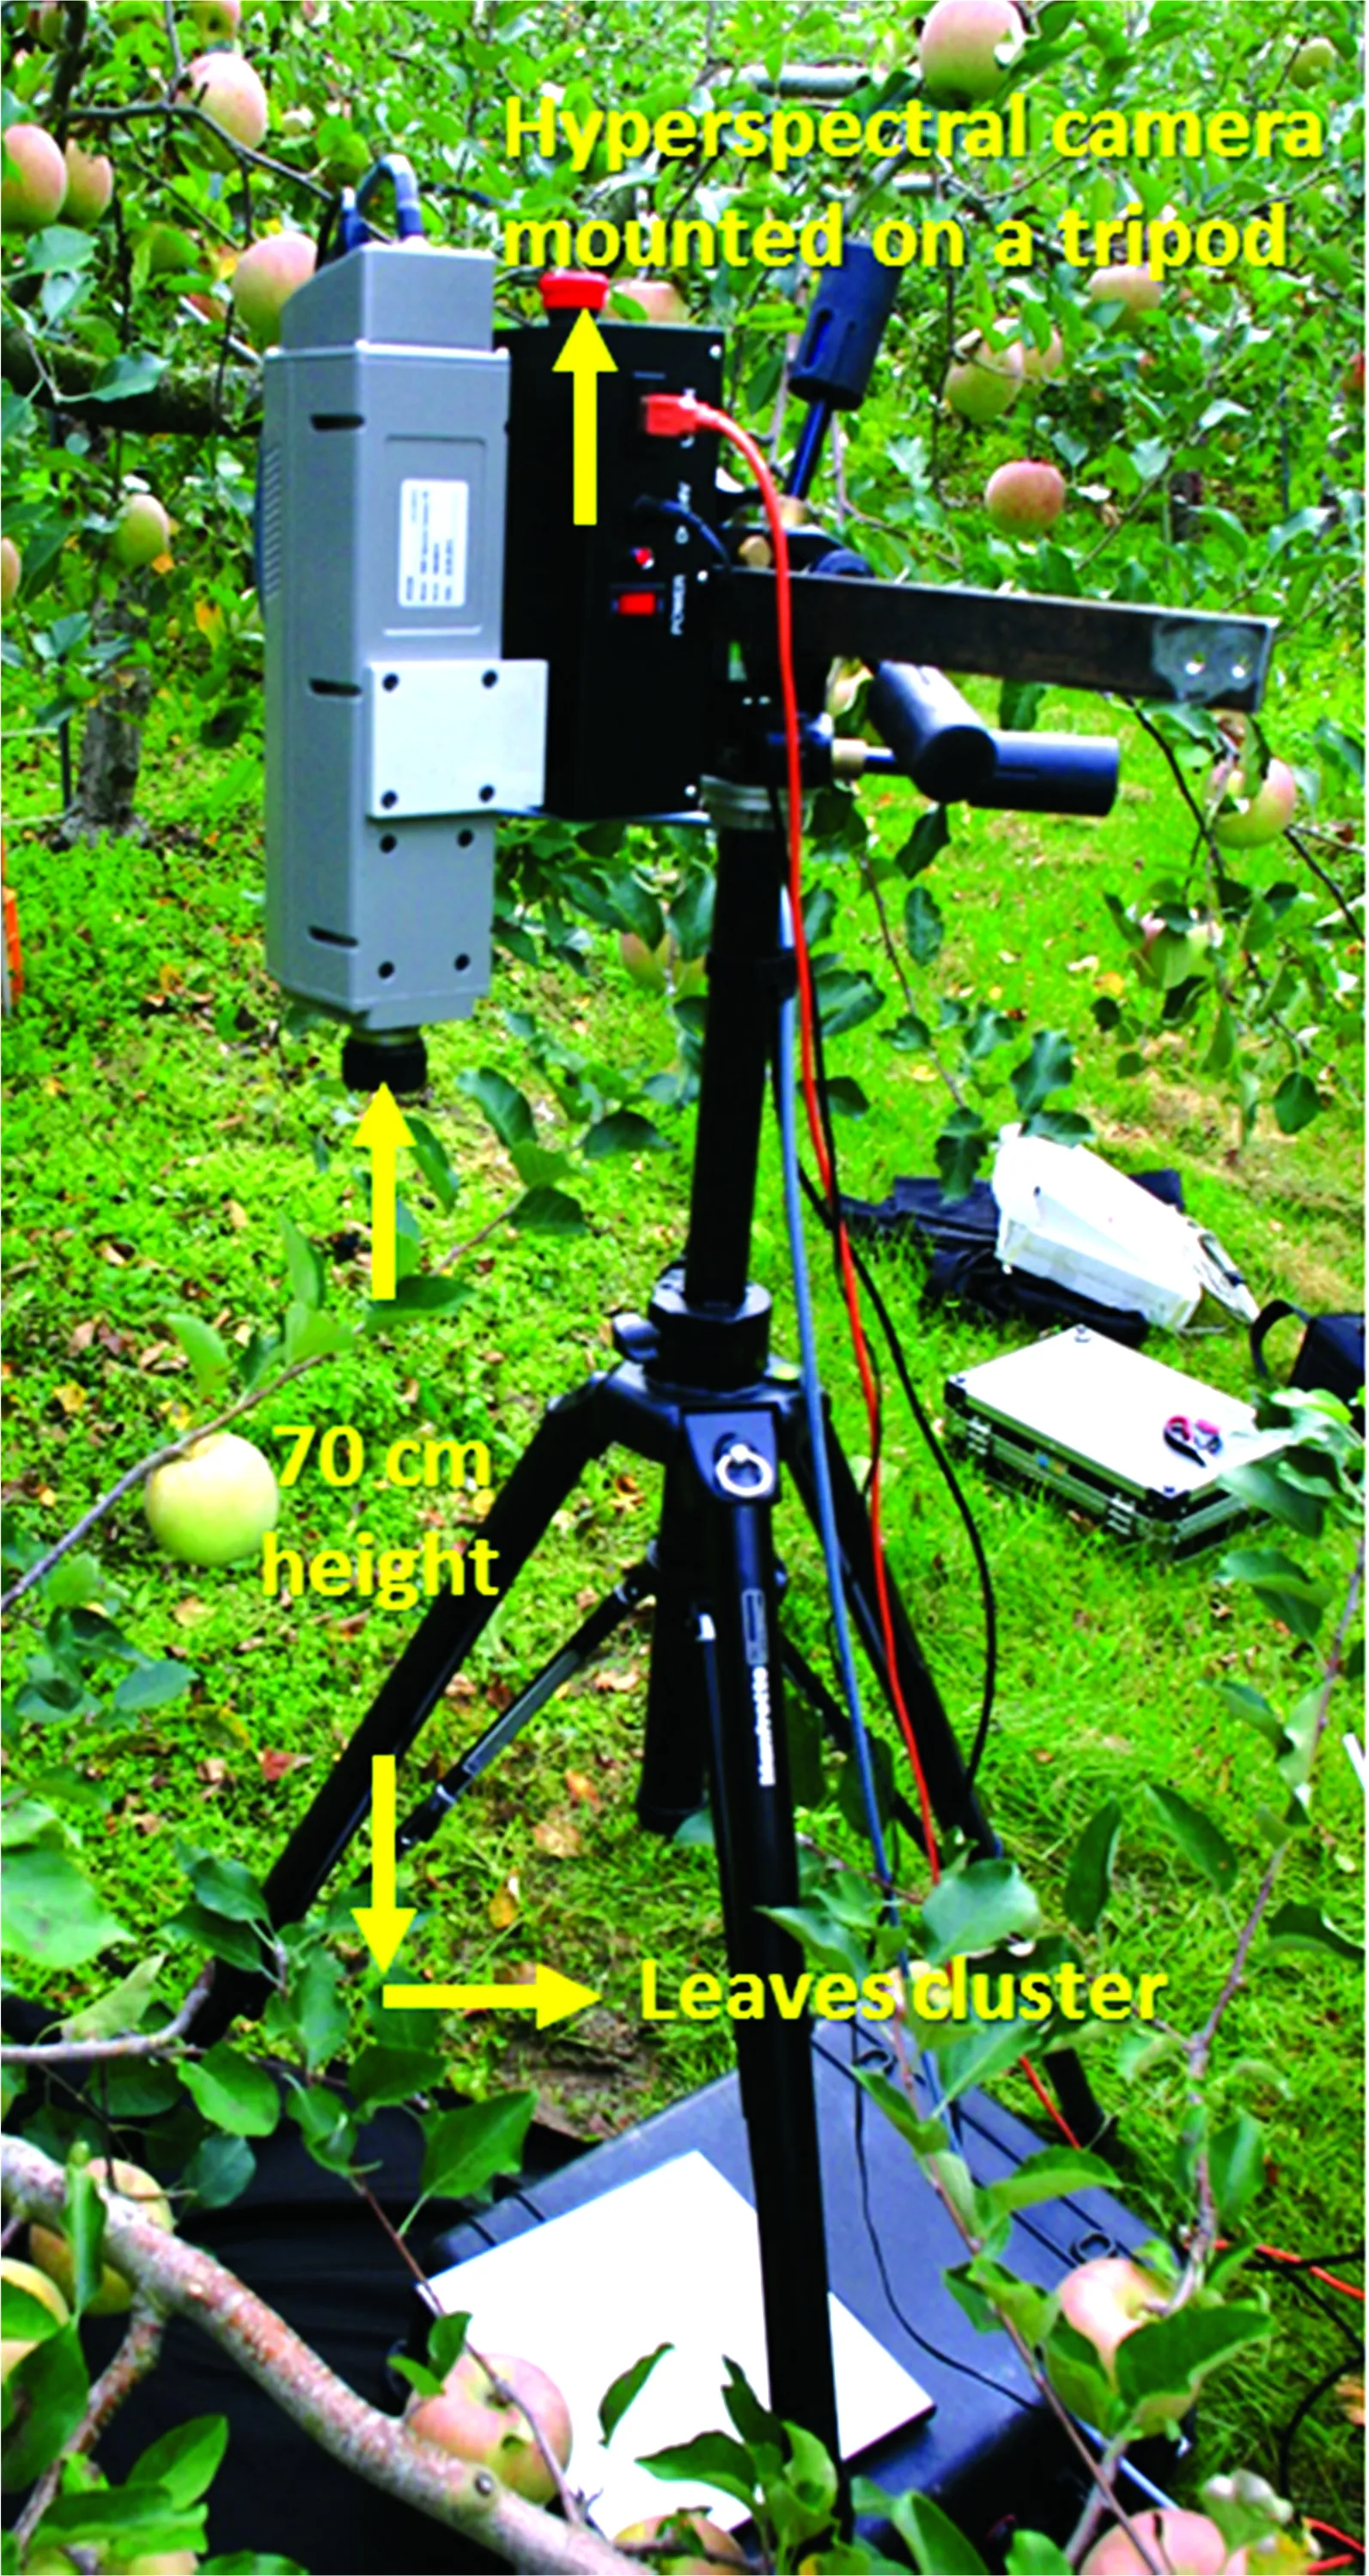
Fig.1 Hyperspectral imaging system setup for appletree leaves imaging in experimental site

Table 1 Names and the number of pixels for each class
1.2 Data analysis
White and dark references were captured in hyperspectral images in order to correct the acquired images to reflectance.
Flat-field correction was performed on the original hyperspectral images using Eq. (1) defined below:
(1)
whereRCis the corrected reflectance,RRAWis the original sample image,RWHITEandRDARKwere the reference image obtained from white and dark references, respectively[18]. The dark reference was acquired digitally by SpectralDAQ (version 3.62, SPECIM, Spectral Imaging Ltd., Oulu, Finland). A reflectance factor of 100% for the white reference was used in this study for simplification, although the reflectance panel had a reflectance value of 99% across the wavelength range covered by the hyperspectral imaging system. The procedures used in this study for the hyperspectral images analysis are shown in Fig.4.

Fig.2 An example to explain to select asymptomatic pixels using hyperspectral images of developingAMB symptoms over time and enlargements (polygon area means symptomatic area)

Fig.3 How to make the overlapped images using developing symptomatic areas

Fig.4 Steps taken in hyperspectral image analysis
Matlab (R2015a, MathWorks, Natick, MA) was used to conduct partial least squares regression (PLSR), principal component analysis (PCA), and linear discriminant analysis (LDA) to the extracted reflectance spectra in range of 400 to 1 000 nm. The estimation model was developed with four linear discriminants from LDA classifiers. Results were represented in terms of score plots and coefficient of determination (R2) of cross-validation of the estimation model performance.
2 Results and Discussion
The average reflectance spectra of each class are shown in Fig.5. The other three classes, except for the symptomatic class, had a similar signature, especially around 555 nm and over 750 nm. Unlike the other classes, AMB symptomatic (SYM) spectra did not possess a peak between 495 and 570 nm due to the absence of chlorophyll in symptomatic regions. Based on the aforementioned characteristic, the SYM class can easily be separated from the other classes. PLSR, PCA, and LDA were conducted for effective separation and prediction and these estimation models were performed with the test set.
First, PLSR and PCA were conducted to minimize spectroscopic interference and noise. For the most part, the results derived from PCA and PLSR were similar. PLSR and PCA explained 95.9% and 96.8% of the training set variation with four principal components, respectively. Figure 6 shows the first three latent variable (LV) from reflectance spectra, and it indicates that the PLSR model could efficiently classify pixels of SYM against pixels of HG, HGV and ASYM. However, pixels of ASYM should be recognized against other classes in order to develop a model to identify the early symptoms on apple leaves. The SYM class was separated easily from the other classes due to its distinct color and reflectance spectra. However, ASYM class could not be easily separated from the HG class using PLSR due to similarity in their color and spectra.

Fig.5 Average spectra by classification
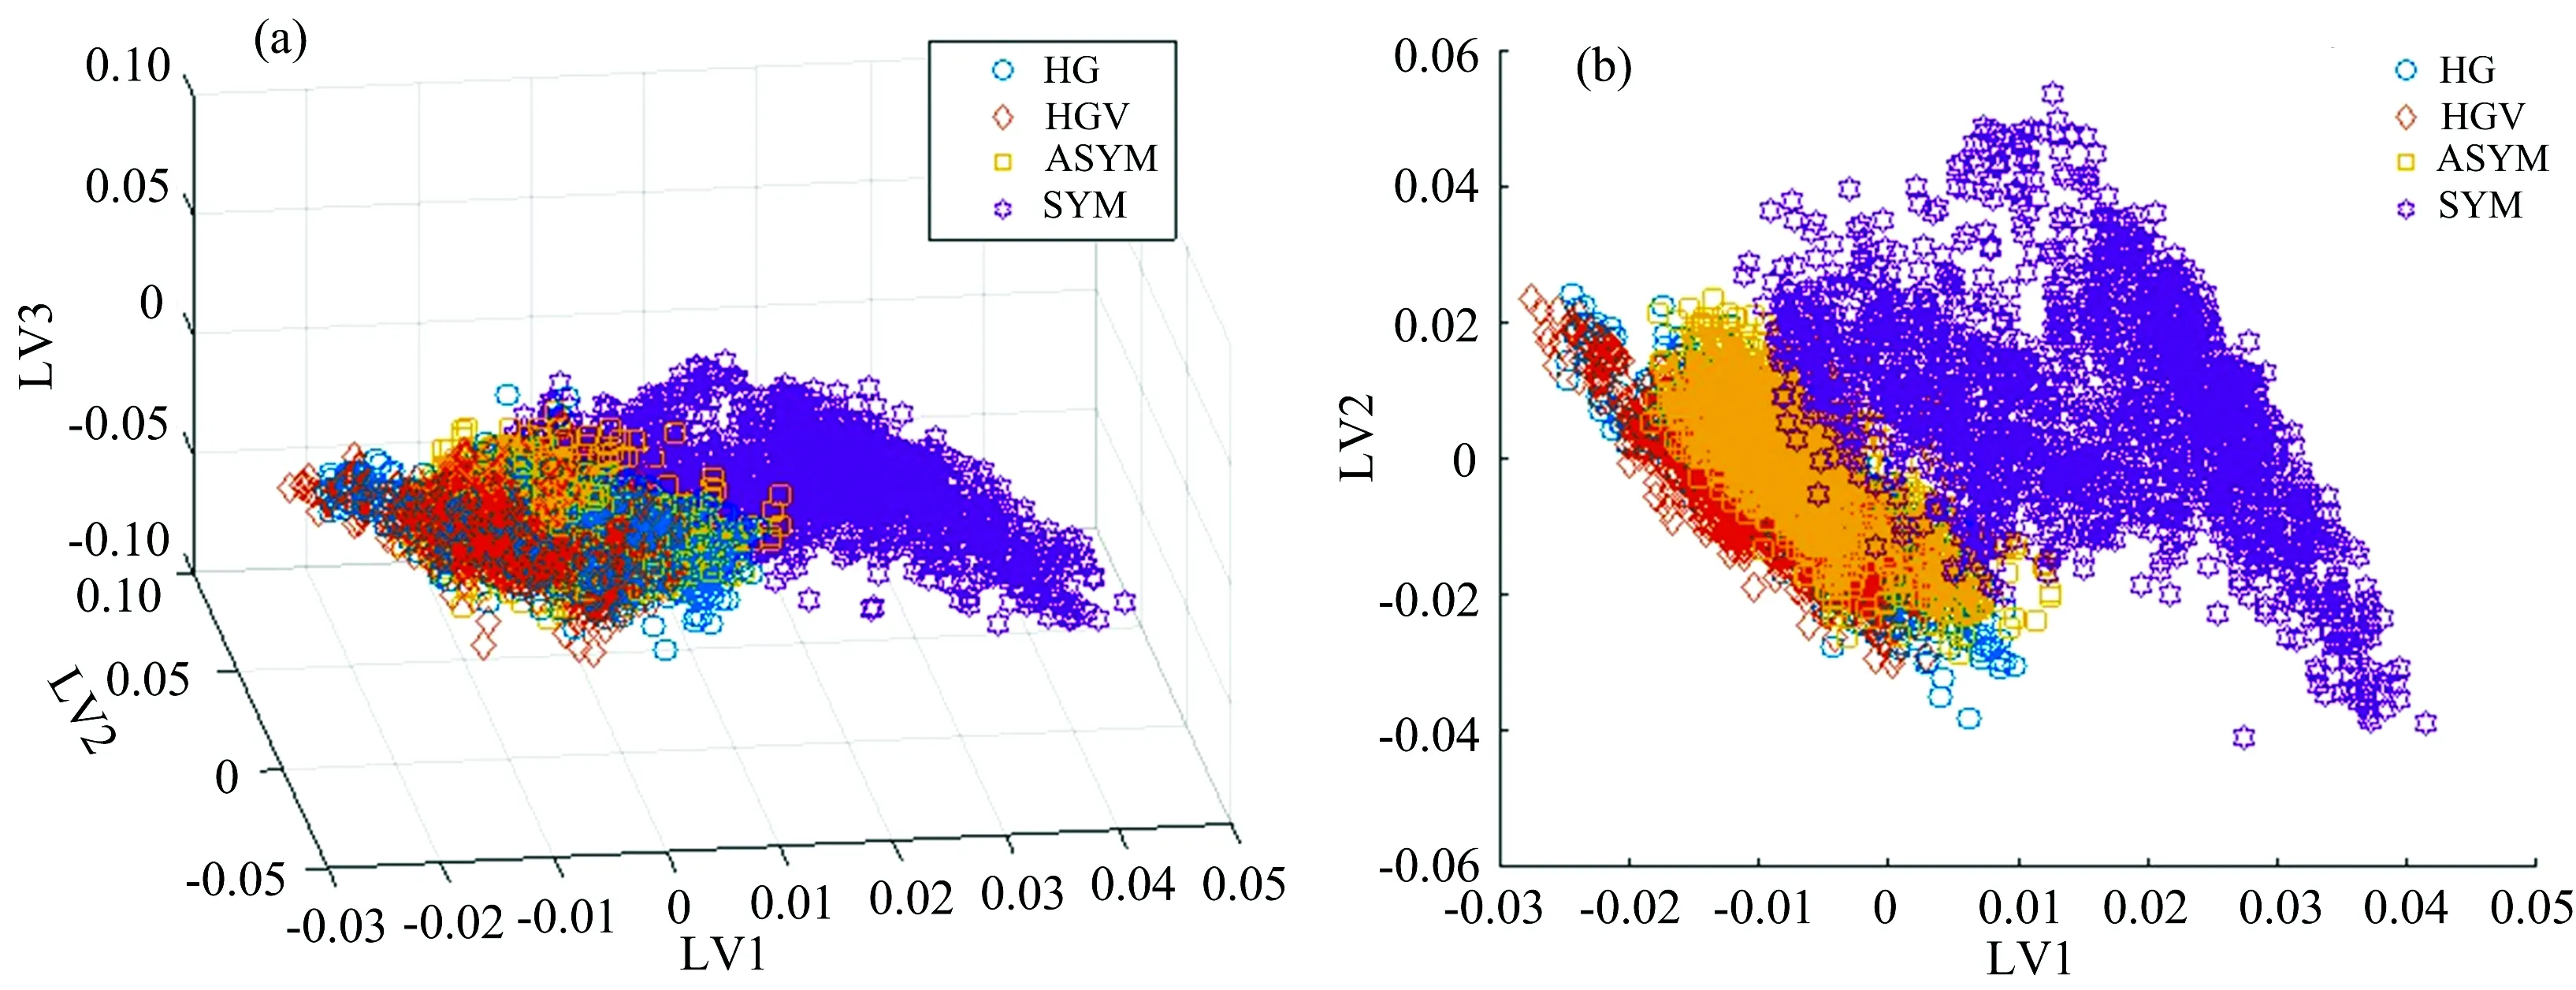
Fig.6 Score plot between leaf pixels in terms of the principal components from PLSR
PCA was performed to ideotify four classes. The PC1, PC2, and PC3 scores plots, shown in Fig.7, contained the greatest amount of variability in the data set, and as a result, they were used in discriminating among the classes. PCA showed similar performance results as those of PLSR. Score plots indicated that PCA could classify pixels of SYM against pixels of other classes. Just as was the case in the PLSR analysis, the ASYM class could hardly be separated from the other classes. Score plots of PCA performed less efficiently than the score plots of PLSR in separating the classes, since SYM was distributed in wide area and overlapped more with HG and ASYM in spacious plain.

Fig.7 Score plots between leaf pixels in termsof the principal components from PCA
Cross-validation results used in identifying the four classes from both PLSR and PCA analyses are shown in Fig.8. The PLSR estimation model performed better becauseR2of estimation models using PLSR and PCA were 0.57 and 0.36, respectively. Based on the estimation model performances, PLSR and PCA models could be suitable to separate SYM pixels against pixels of HG, HGV and ASYM. However, both models showed high separation error for ASYM class. Further analysis should be considered so as to ensure the ASYM class can easily be separated from the other classes.

Fig.8 Cross-validation results to identify 4 classes using PLSR (a) and PCA (b)
LDA is closely related to both PCA and factor analysis in that they all look for linear combinations of variables that explain the data well. LDA explicitly attempts to model the differences between classes while PCA does not take into account any difference between classes, it provides only a visualization of the variability of the data, does not imply any clustering, although formation of sample groups could be a possible result[19]. Score plots with the liner discriminants from LDA are shown in Fig.9. Based on the score plot formation, LDA performed better in separating the classes than PLSR and PCA. In particular, ASYM pixels were separated against the other three classes. Additionally, the reflectance taken from ASYM seems to be separated from HG effectively. Thereby, cross-validation was applied to verify the estimation model using LDA scores.

Fig.9 Score plots between leaf pixels in terms of the liner discriminants (LD) from LDA
The LDA score plots and cross-validation results are shown in Fig.10, and Table 2 shows the classification accuracy and error obtained for each class using thresholds of 1.7, 2.1, and 3.6. TheR2of estimation model using LDA scores was 0.81. It performed better compared toR2achieved using PLSR and PCA estimation models. In particular, the classification accuracy obtained for ASYM class was 88%, and 11.8% of SYM samples were misclassified as healthy pixels (HG and HGV). Comparing the classification accuracy achieved for the ASYM class with results obtained by other researchers who have studied similar fungal diseases, the results from this analysis were not as high as some others. Bulanon et al.[11]obtained an accuracy of 96% for citrus black spot detection , Senthilkumar et al.[13]achieved over 92% classification accuracy for infected canola seeds, and Tallada et al.[14]reported 98% detection accuracy of uninfected corn kernels. However, the AMB asymptomatic area on leaves is very difficult to characterize since they have the same color as healthy leaves. Considering that asymptomatic diseased leaves are hardly ever spotted by the human eyes, the developed estimation model using LDA has the potential for being used for identification of asymptomatic regions of leaves infected by AMB.
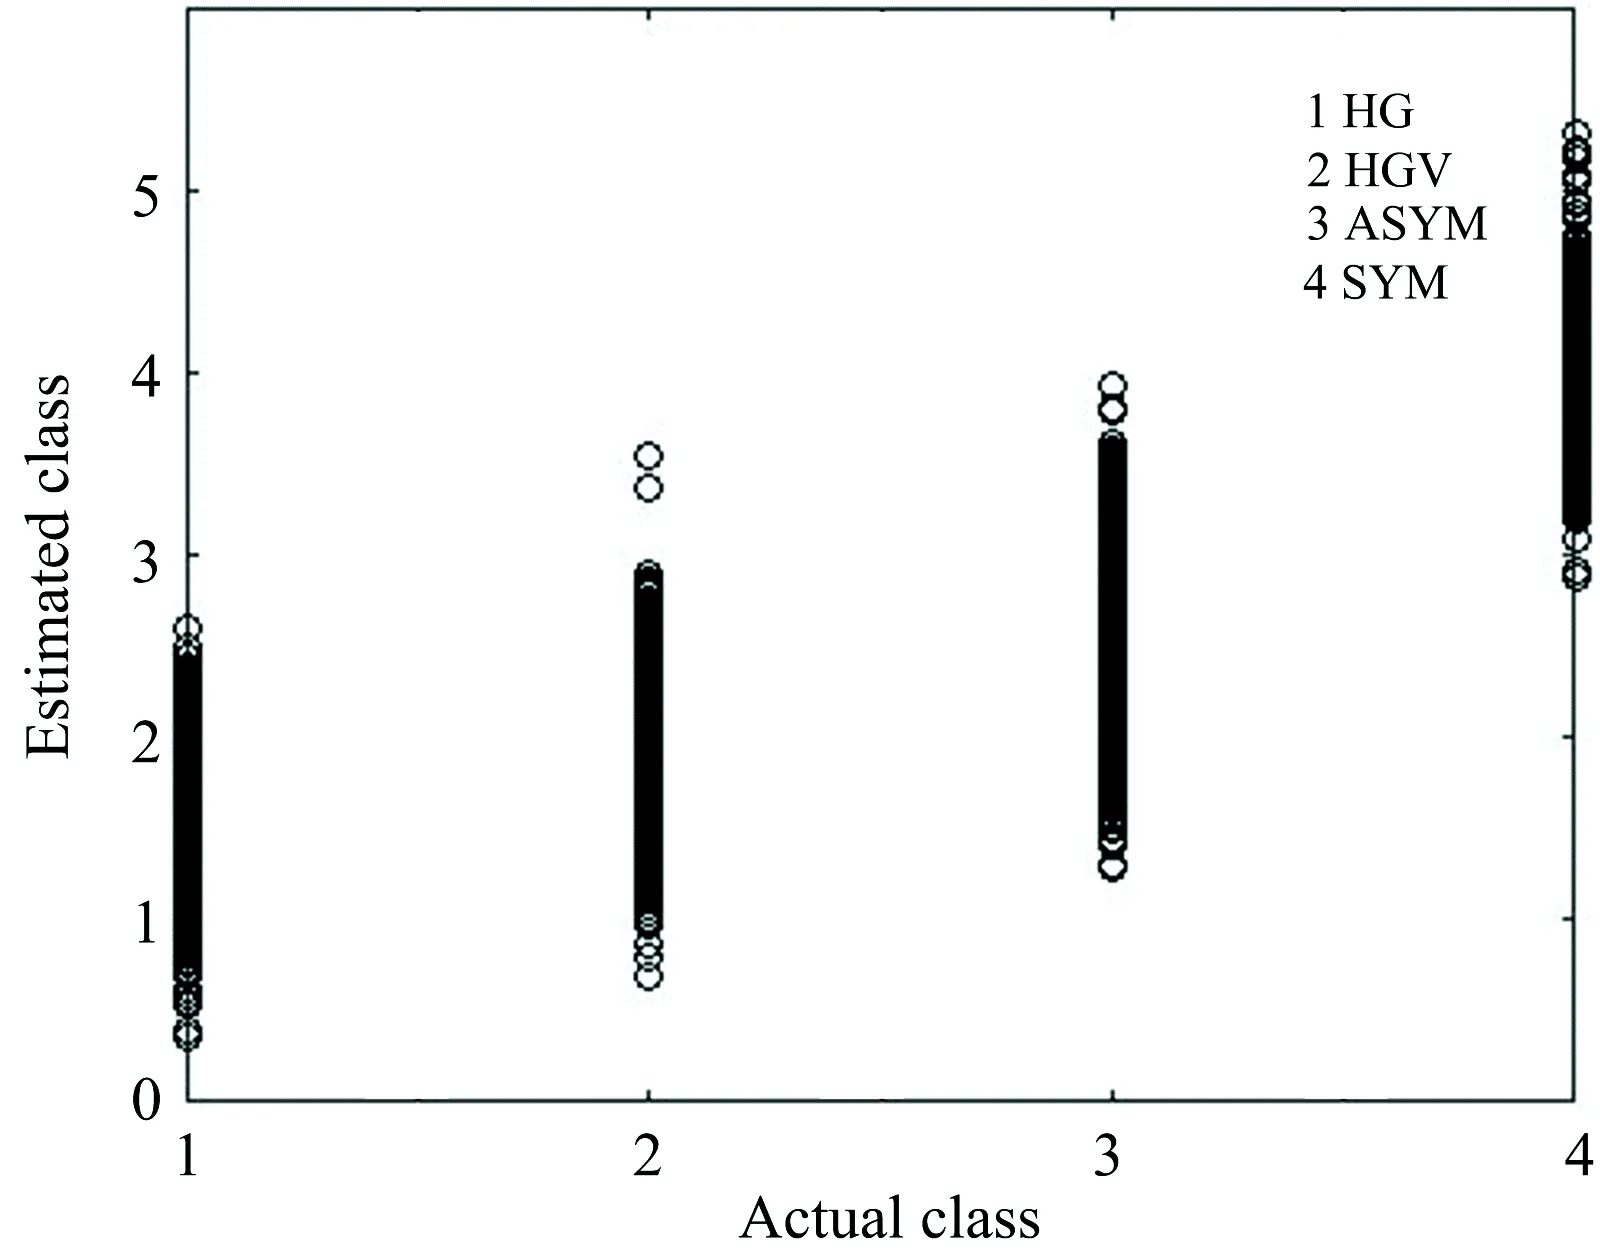
Fig.10 Cross-validation result of linier estimationmodel using LD scores
Table2NumberofpixelsandclassificationratesinperformanceofestimationmodelusingLDAscores
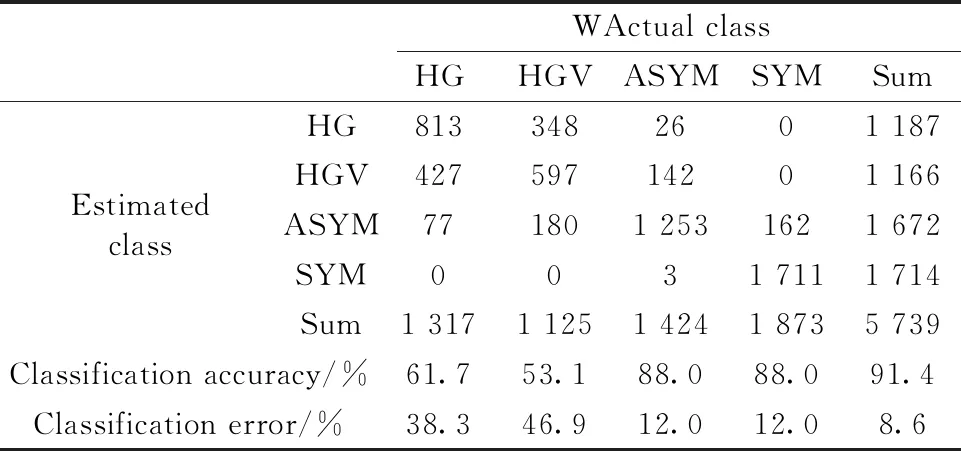
WActual classHGHGVASYMSYMSumEstimatedclassHG8133482601 187HGV42759714201 166ASYM771801 2531621 672SYM0031 7111 714Sum1 3171 1251 4241 8735 739Classification accuracy/%61.753.188.088.091.4Classification error/%38.346.912.012.08.6
3 Conclusion
In this study, multivariate data analysis of hyperspectral images was applied to identify four different classes of apple leaves which were healthy green leaf (HG), healthy green vein (HGV), AMB asymptomatic (ASYM), and AMB symptomatic (SYM). Reflectance spectra information was extracted from time lapse hyperspectral images acquired from a cluster of leaves on a tree and class estimation models were built using PCA PLSR, and LDA. The estimation model built using LDA classifier performed better than PLSR and PCA in separating the SYM class from the other classes. Using this model, an accuracy of 88.0% was obtained in discriminating the ASYM class from the other three classes, while an accuracy of 91.4% was achieved for the SYM class. Based on the results achieved from this study, the developed estimation model using LDA score has the potential for being used for the identification of asymptomatic pixels on hyperspectral images of leaves infected by AMB. Our results indicate that the developed model has the potential for being used for the identification of asymptomatic pixels on hyperspectral images of leaves infected by AMB. Thus, this study will be of interest to many agro-engineers in disease detection.
Acknowledgement: This study was carried out in the University of Florida, USA, and supported by the National Academy of Agricultural Science, Rural Development Administration, Republic of Korea.
登錄APP查看全文
- 光譜學與光譜分析的其它文章
- The Characterization on Organic Sulfur Occurrence in Coking Coal and Mechanism of Microwave Actionon Thiophene
- Elemental Analysis of Tea Leaves (Camellia Sinensis) and Their Own Soils at Eastern Black Sea Region in Turkey
- 紅外光譜數據融合對美味牛肝菌產地鑒別
- 基于高光譜開發灘羊肉中高鐵肌紅蛋白含量的定量函數
- 不同耕法下秸稈還田對土壤WSOC熒光特性的影響
- 高鹽樣品中鋰的電感耦合等離子體發射光譜法(ICP-OES)測定研究