Exploring alkylthiol additives in PBDB-T:ITIC blended active layers for solar cell applications?
2019-08-16 01:20:50XiangLi李想ZhiqunHe何志群MengjieSun孫盟杰HuiminZhang張慧敏ZebangGuo郭澤邦YajunXu許亞軍HanLi李瀚ChunjunLiang梁春軍andXipingJing荊西平
Chinese Physics B 2019年8期
Xiang Li(李想), Zhiqun He(何志群),?, Mengjie Sun(孫盟杰), Huimin Zhang(張慧敏), Zebang Guo(郭澤邦),Yajun Xu(許亞軍), Han Li(李瀚), Chunjun Liang(梁春軍), and Xiping Jing(荊西平)
1Key Laboratory of Luminescence and Optical Information,Ministry of Education,Institute of Optoelectronic Technology,Beijing Jiaotong University,Beijing 100044,China
2College of Chemistry and Molecular Engineering,Peking University,Beijing 100871,China
Keywords: bulk heterojunction(BHJ)polymer/non-fullerene solar cells,solvent additive,morphology,crystallization
1. Introduction
Bulk-heterojunction(BHJ)polymer solar cells(PSCs)have attracted much attention as promising candidates for the nextgeneration solar cells due to the irreplaceable advantages,such as wide source of materials,wet processing at low cost,environmental friendliness,and easy preparation of large area devices.[1-6]In the past few decades,great achievements have been made in the development of polymer solar cells. The efficiency of bulk heterojunction PSCs based on fullerene receptors fabricated via solution processing was gradually increased to 10%.[7,8]
Three typical routes can be found in the development of high performance PSCs:the synthesis of high efficiency photovoltaic materials,[9-11]the construction of novel device structure,[12-15]and the optimization of morphology,[16-19]or a combination of these approaches. Zhan et al. developed a series of excellent non-fullerene receptor materials, such as ITIC and ITIC-Th,which opened up a way to improve the optical coverage and energy level matching with many polymer donors through effective enhancement in photon capture in the active layer of the devices.[20,21]Zhao et al. blended non-fullerene receptor ITIC with polymer PBDB-T in combination with solvent additives (such as 1,8-diiodooctane, diphenyl ether, 1-chloronaphthalene, and N-methyl-2-pyrrolidone) to optimize photovoltaic devices and achieved an average power conversion efficiency (PCE) of the devices from 8.6% to over 9%; in combination with the optimization of transporting layer, the maximum PCE of the devices may reach an outstanding level of 11%.[22]At present,the device efficiency of BHJ solar cells based on non-fullerene accepter has exceeded 15%.[23]Tandem solar cells with complementary optical absorption of active materials in front and back cells also made breakthroughs.[24]
It is well known that phase separation is a critical factor determining the photovoltaic generation process, i.e., exciton diffusion and dissociation,charge carrier transport and collection. Highly separated donor/acceptor(D/A)phase of large size is beneficial to charge transport due to the formation of double continuous channels.However,it may inhibit dissociation of exciton to free carriers as the exciton has to travel a longer distance to reach the D/A interface. Although a finely separated phase with smaller sizes is beneficial to exciton dissociation,it may hinder charge transport to the electrode. Therefore,the optimization of phase separation scale can achieve a balance between exciton dissociation and charge transfer. The phase separation status can be adjusted by various methods,such as thermal annealing,[25-29]solvent annealing,[30,31]and mixing with solvent additives.
Solvent additives have been extensively explored in the optimization of polymer photovoltaic devices as the method was found to be easy in operation and effective in photovoltaic response.[18,32-36]A large number of solvent additives have been investigated based on polymer:fullerene system. Bazan and Heeger et al. discovered that alkylthiol additives can modify the P3HT aggregation and P3HT/fullerene phase separation,[37]and influence the physical interactions between the polymer chains and/or between the polymer and fullerene phases on PCPDTBT:PC71BM system.[35]Only limited investigations have been reported for polymer:non-fullerene system. By far, the relation between the physical properties of the additives and the device performance has not yet established. The selection of the successful candidates relies on a trial and error excise due to the fact that the exact physical mechanism is still unclear.
In this work, we focus on the binary system for simplicity in order to better understand the physical mechanism within a device. A series of alkylthiol additives with similar polarity but different chain lengths are selected in active layers of BHJ nonfullerene organic/polymer solar cells. The effects of these additives on the device performance are investigated and discussed.We are able to establish the relation between the degree of the order in active layers and the device performance. The work leads to a better understanding in the physical mechanism of PSCs.
2. Experimental section
2.1. Material
Poly[(2,6-(4,8-bis(5-(2-ethyl-hexyl)thiophen-2-yl)-benzo-[1,2-b:4,5-b’]dithiophene))-alt-(5,5-(1’,3’-di-2-thienyl-5’,7’-bis(2-ethyl-hexyl)benzo[1’,2’-c:4’,5’-c’]dithiophene-4,8-dione))](PBDB-T)and 3,9-bis(2-methylene-(3-(1,1-dicyanomethylene)indanone))-5,5,11,11-tetrakis(4-hexylphenyl)-dithieno[2,3-d:2’,3’-d’]-s-indaceno[1,2-b:5,6-b’]-dithiophene) (ITIC) were purchased from Solarmer Materials Inc. 1,3-propanedithiol(PDT,97%)and 1,8-octanedithiol(ODT,98%)were obtained from Alfa Aesar.1,4-butanedithiol(BDT,>95%)was from Tokyo Chemical Industry(TCI).The chemical structures of these materials are shown in Fig.1.
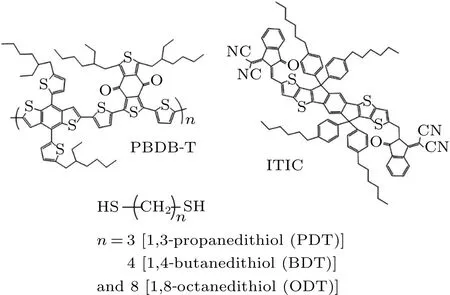
Fig.1. The chemical structures of the materials used in the active layers.
The ZnO precursor was prepared by dissolving zinc acetate dehydrate (Zn(CH3COO)2·2 H2O, 219 mg) and ethanolamine(NH2CH2CH2OH,60 mL)in 2-methoxyethanol(CH3OCH2CH2OH, 2 mL), which is similar to the literature report.[38]The ZnO precursor was filtered twice by 0.22-μm PTFE syringe filter before use. The polymer solution was prepared by dissolving PBDB-T and ITIC (1:1 by weight) into chlorobenzene (CB) at a total concentration of 20 mg/mL,which is followed by the addition of solvent additives (such as PDT,BDT,or ODT)at a small fraction.
2.2. Device Fabrication
The indium-tin oxide (ITO) glass subst rates were ultrasonically cleaned with detergent, deionized water, acetone,and isopropanol for 20 min each in turn. After drying with N2flow,these substrates were placed in ultraviolet ozone environment for 20 min. The filtered ZnO precursor was spincoated on top of the ITO substrate at a speed of 3000 rpm for 40 s and then annealed at 200°C for 20 min in air to form a thin ZnO layer. These were transferred into an N2-filled glove box. Active layers were spin-coated on top of the ZnO layer from the PBDB-T:ITIC solutions (with or without additives)at a speed of 1100 rpm for 60 s with an approximate thickness of 100 nm. These were then annealed at 160°C for 10 min.A thin MoO3layer (6 nm) was thermally evaporated on top of the active layer. Finally, an Ag electrode (~100 nm) was thermally evaporated at a pressure of 2×10⁻⁴Pa.
2.3. Characterization and device measurements
The ultraviolet-visible(UV-Vis)absorption spectra of the film specimen were taken using UV-Vis-Near infrared (NIR)scanning spectrometer (Shimadzu UV-3101PC). Steady-state or transient photoluminescence spectra were measured using a Horiba Fluorolog-3 spectrofluorometer or Edinburgh Instruments FLS920 fluorescence spectrometer, respectively.The surface morphologies of films were investigated using an atomic force microscope(AFM,Nanocute,SII NanoTechnology) in a tapping mode and scanning electron microscope(SEM,Hitachi S4800). X-ray diffraction patterns were taken using a Bruker D8 advance diffractometer. The current density-voltage(J-V)characteristics of the devices were measured using a source measure unit(Agilent B2902A) under a standard AM 1.5G solar irradiation illumination with a light intensity of 100 mW/cm2from a solar simulator (Abet Sun 2000). The external quantum efficiencies(EQEs)of the polymer solar cells were detected with a solar cell quantum efficiency measurement system(Zolix Solar Cell Scan 100). All devices were tested in an ambient atmosphere without encapsulation.
3. Results and discussion
3.1. Influence of solvent additives on the device performance and the active-layer morphology
Inverted bulk-heterojunction polymer solar cells are fabricated, which have a general device configuration,ITO/ZnO/PBDB-T:ITIC/MoO3/Ag, as shown in Fig. 2(a)alongside with the energy diagram of the layers in Fig. 2(b).In order to optimize the device performance, a number of organic-solvent additives,PDT,BDT,or ODT,are selected in the current investigation.These are tested individually into the donor-acceptor blended active layers in order to manipulate the device performance. Three different solvent additives with varied volume ratios are used into the PBDB-T:ITIC blended active layers, the J-V curves corresponding to the devices of adding PDT,BDT,and ODT are illustrated in Figs.2(c),2(d),and 2(e), respectively, and the detailed photovoltaic parameters are summarized in Table 1. Such optimized fractions for different additives are found to be slightly different,which are 1%for PDT,0.5%for BDT,and 0.5%for ODT additives.These fractions are then used in the follow-up devices fabrication.
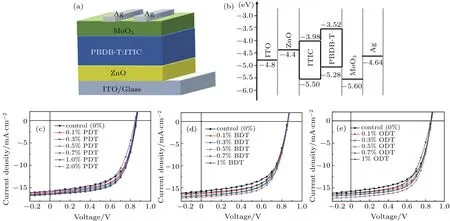
Fig. 2. (a) The structure, (b) the energy level diagram of each layer, and the J-V characteristics of the PBDB-T:ITIC-based photovoltaic devices with additives(c)PDT,(d)BDT,and(e)ODT.
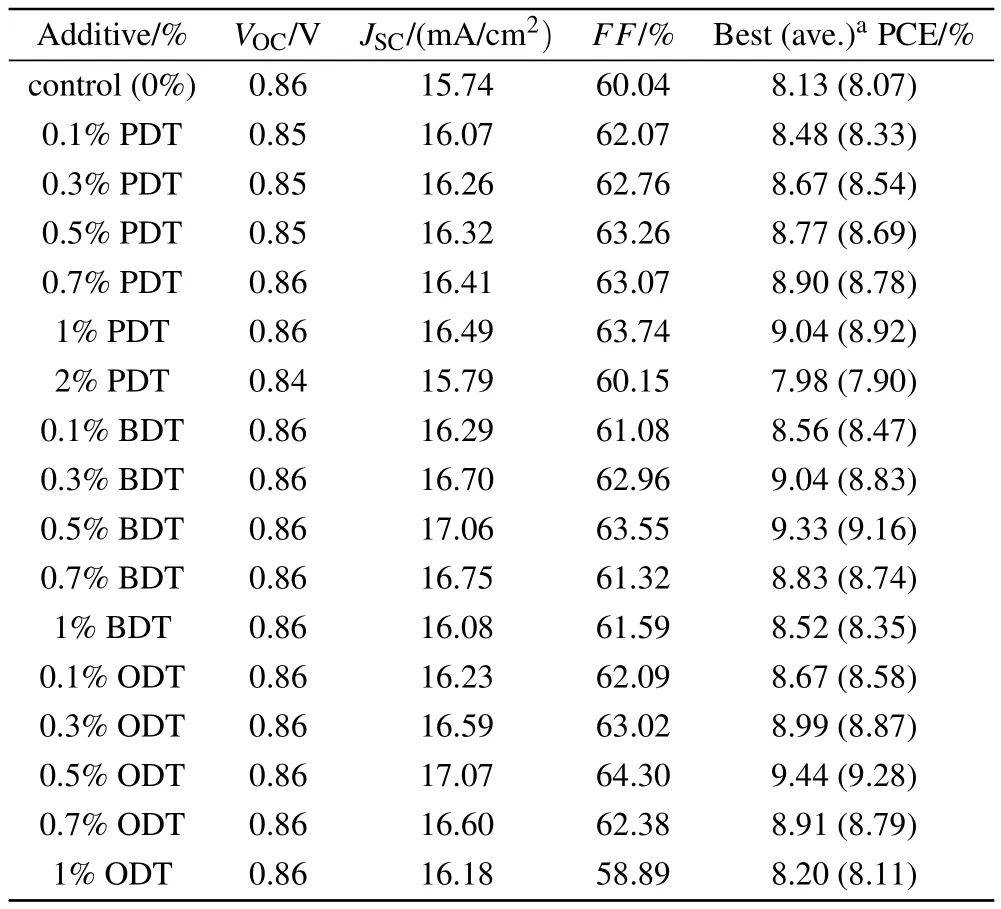
Table 1. The photovoltaic performance of photovoltaic devices based on PBDB-T:ITIC blend with varying volume ratios of three different solvent additives.
It can be seen from Table 1 that the addition of PDT,BDT,or ODT additives into the active layers has no effect on the open-circuit voltage(VOC)of the devices. However,there are distinct enhancements in short-circuit current density(JSC)and fill factor(FF)in all devices investigated with an additive in the active layers.It appears that the additive with the longest flexible chain, such as ODT, has the strongest impact on the device performance. The device fabricated with 0.5% ODT in the active layer demonstrates the best performance. In this device, the JSCreaches 17.07 mA/cm2(8.4% increase from 15.74 mA/cm2of the control device) and FF 64.30% (7.1%increase from 60.05%of the control device). The additive optimization leads to an overall 16%enhancement in PCE,from 8.13%of the control to 9.44%of 0.5%ODT device.
The insensitivity of the additives to VOCof the device can be understood as the fact that the three additives have identical functional groups though the chain lengths are different.Since the functional group determines the polarity of a molecule, it means that the effect on charge distribution of the adjacent molecules,such as the donor/acceptor blend,is similar.Therefore,the VOCvalues of the devices are unchanged. In order to understand the increase in JSCand FF, other factors have to be considered.
Because the boiling temperatures of PDT,BDT,and ODT are quite different, which are 169°C, 195°C, and 269°C, respectively,the additive in the active layers may alter the crystallization process during the film formation and thus the morphology of the films. It is well known that the exciton dissociation, carrier transport and collection are closely related to the morphology of the active layer. The formation of a suitable microstructure with phase seperation and network interpenetrating channels for charge transport will be beneficial to improve the JSCand FF of the device. The morphology of the active layers is first analyzed using wide-angle x-ray diffraction(XRD).The XRD patterns of PBDB-T:ITIC blended films with or without additives are shown in Fig.3 and the peak positions are listed in Table 2.The diffraction from each individual material is also obtained for comparison(not shown).
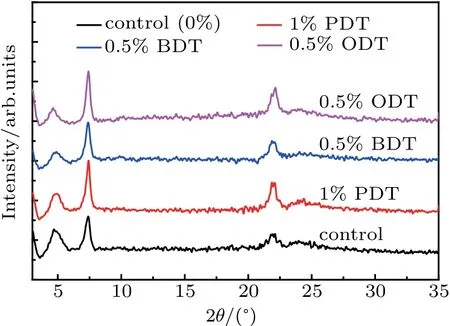
Fig. 3. Wide angle x-ray diffraction patterns of PBDB-T:ITIC blend films with or without additive (the curves are shifted vertically for the sake of clarity).
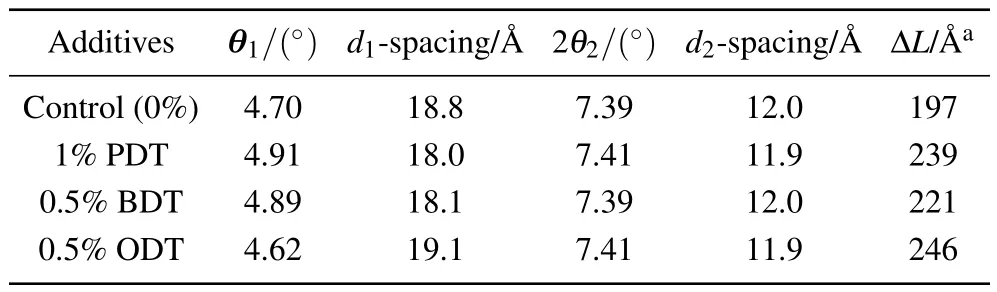
Table 2. Peak positions, d-spacings, and the calculated correlation lengths from wide angle x-ray diffraction of the blend films with different additives.
From Fig.3,three distinct diffractions are observed. The one at low angle q1=0.33 ?A-1(2θ1=4.70°) corresponding to a d-spacing of 18.8 ?A is the diffraction from PBDB-T lamellar structure,[39]while the peak at q2=0.53 ?A-1(2θ2=7.39°)is the diffraction from ITIC lamellar structure.[40]Unlike PBDB-T:PBDTTPD blend in a previous work where an alloy was developed,[39]the lamellar structures of the PBDBT:ITIC blend display distinct structural features of individual components. These means that both PBDB-T or ITIC are in separated phases rather than in an alloy. The donor/acceptor is blended in a form mixing crystalline domains of each individual component. In addition, the dimension of the PBDBT lamellar is smaller in the PBDB-T:ITIC blend than that in the PBDB-T:PBDTTPD blend as the x-ray diffraction peak of the PBDB-T component occurs at a slightly higher angle in PBDB-T:ITIC blend.[39]Diffraction at a relatively high angle,q3=1.55 ?A-1(2θ3=21.9°), is superimposed on top of an amorphous diffraction and related to the feature in the outplane direction.
A distinct feature can be observed where the diffraction peaks at 2θ2and at 2θ3become narrower when adding the solvent additives into the active layers. This is an indication of improvement in structural order in the crystallization. The changes in structural order can be estimated using correlation length (ΔL), which is defined as ΔL=2π /Δq, where the Δq is the full width at half maximum intensity of the peak,and q is the scattering factor defined by q=4π sinθ/λ.[41-43]The ΔL values calculated based on the diffraction at q2of diffraction representing ITIC component from specimens prepared using different additives are listed in Table 2. It is found that ΔL increases significantly after the addition of additives into PBDB-T:ITIC blended active layer. Longer correlation length of diffraction at q2represents an extended order structure in ITIC component,whereas there is almost no change in the correlation length of diffraction at q1representing PBDBT component. This indicates that the additives would have a stronger impact on the morphology of the molecular acceptor ITIC than that of donor PBDB-T. A relative high degree of order in molecular organization of ITIC would benefit the electron transport in the actively layer and balance the hole/electron transport,which in turn improves the device performance. This work demonstrates that simple solvent additives may manipulate structural orders and improve the device performance.
Solvent additives have been widely used in device fabrication. However,the majority are focused on phase separation between the donor and acceptor and/or crystallization in polymer donor. Rogers et al.reported the use of ODT as a solvent additive,and found that the PCEs of the devices were boosted from 2.8% to 5.5% for a fullerene PCPDTBT:PC71BM system due to subtly increased crystalline correlation lengths of the donor’s features.[44]Another early work reported by Jenekhe’s group in 2011 demonstrated that a solvent additive(1,8-diiodooctane,DIO)was added into the processing solvent(dichloromethane) in a non-fullerene P3HT:NDI-3TH blend.The PCE of this device was improved by a factor of 10. It was found that DIO was able to regulate the aggregation and the domain size of the acceptor(NDI-3TH)phase in the BHJ blends.[45]On the whole,only limited investigations reported the tuning order of the crystallization in acceptor’s domain in the blends.
The surface morphology of PBDB-T:ITIC blended films with and without solvent additives is observed using AFM as displayed in Fig.4. The control film without additive shows a root-mean-square(RMS)surface roughness of 6.18 nm,where the average RMS surface roughness of the films with additive PDT (1%), BDT (0.5%), or ODT (0.5%) slightly decreases to 5.92 nm, 5.02 nm, or 4.95 nm, respectively. In comparison with the films without additives, the surface of the active layer becomes smoother by adding the solvent additives.At the same time, it can be seen from the phase images that the films with additives show more distinct phase separations between the donor and accepter materials; in addition, nanoscale fiber structure appears when 0.5% ODT is added. This is beneficial to the dissociation of excitons and the transport of the charges.
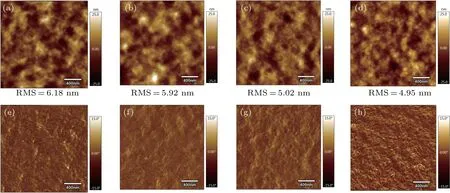
Fig.4. (a)-(d)AFM height images and(e)-(h)phase images of PBDB-T:ITIC blend films; (a)and(e)without additive,and with additive of: (b)and(f)1%PDT,(c)and(g)0.5%BDT,and(d)and(h)0.5%ODT.
Further SEM investigation(see Fig.5)shows clearer images on surface morphology of the active layers.It can be seen that the surface of the films consists of similar interpenetrating network structure,but the grain size becomes more uniform in the active layers with additives.
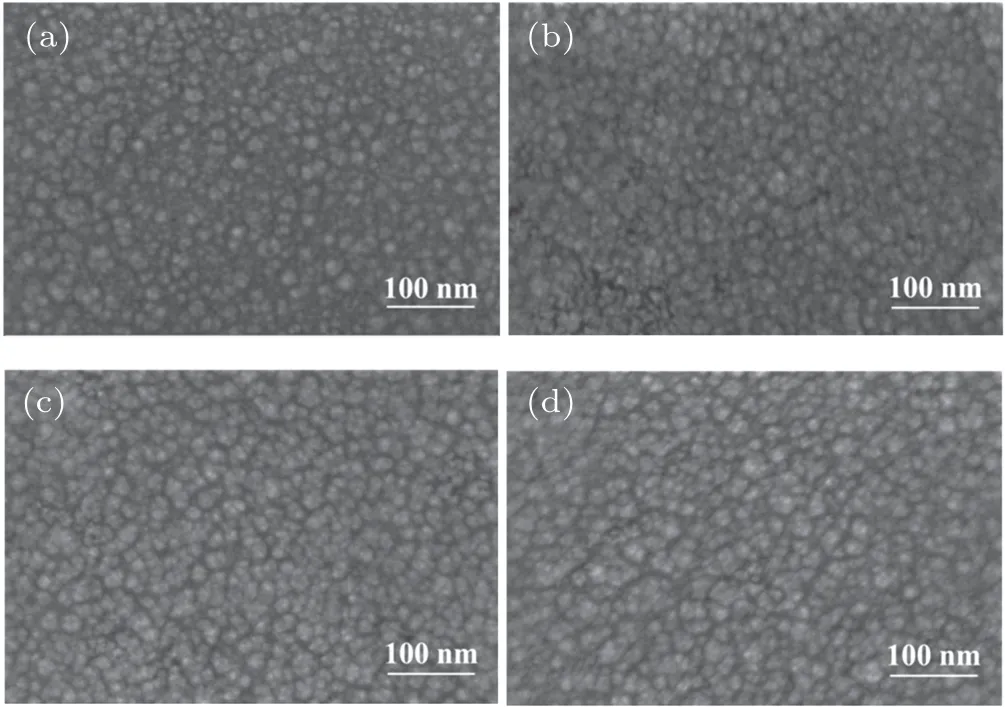
Fig. 5. SEM images of PBDB-T:ITIC blend films (a) without additive and with additive of(b)1%PDT,(c)0.5%BDT,and(d)0.5%ODT.
3.2. Influence of the solvent additives on photophysical property of the materials and devices
In order to understand device performance,photophysical properties of the active layer are investigated. The absorption spectra of PBDB-T:ITIC blend films with or without additive are shown in Fig.6(a). It can be seen that the absorption spectra from specimens with or without additives exhibit a rather similar profile, which has multiple peaks in the range from 500 nm to 740 nm, a maximum at 634 nm, and two shoulders at 580 nm and 700 nm. According to our early work,the absorption in the range from 500 nm to 630 nm was mainly contributed by donor PBDB-T, whereas the absorption from 600 nm to 740 nm was from acceptor ITIC.[39]The side absorption at 580 nm therefore mainly belongs to PBDB-T and the absorption at the other side at 700 nm is due to ITIC absorption. The maximum absorption at 634 nm is an overlap region between the absorptions of the two components. The EQE spectra of the corresponding devices are measured as shown in Fig. 6(b). It covers a similar spectral range from 400 nm to 740 nm compared to the absorption. It is interesting to see that the device with additives in the active layers demonstrates significant enhancement in EQE at all spectral range. The EQE spectrum from the control device maximized around 70.7% is sitting at the bottom, while the EQE curve from the device with 0.5%BDT additive(EQE max.~79.7%)almost coincides with that from the device with 0.5%ODT additive (EQE max. ~80.1%) lying on the top. The measured JSCvalue from the J-V curve is consistent with the integral of EQE response obtained.
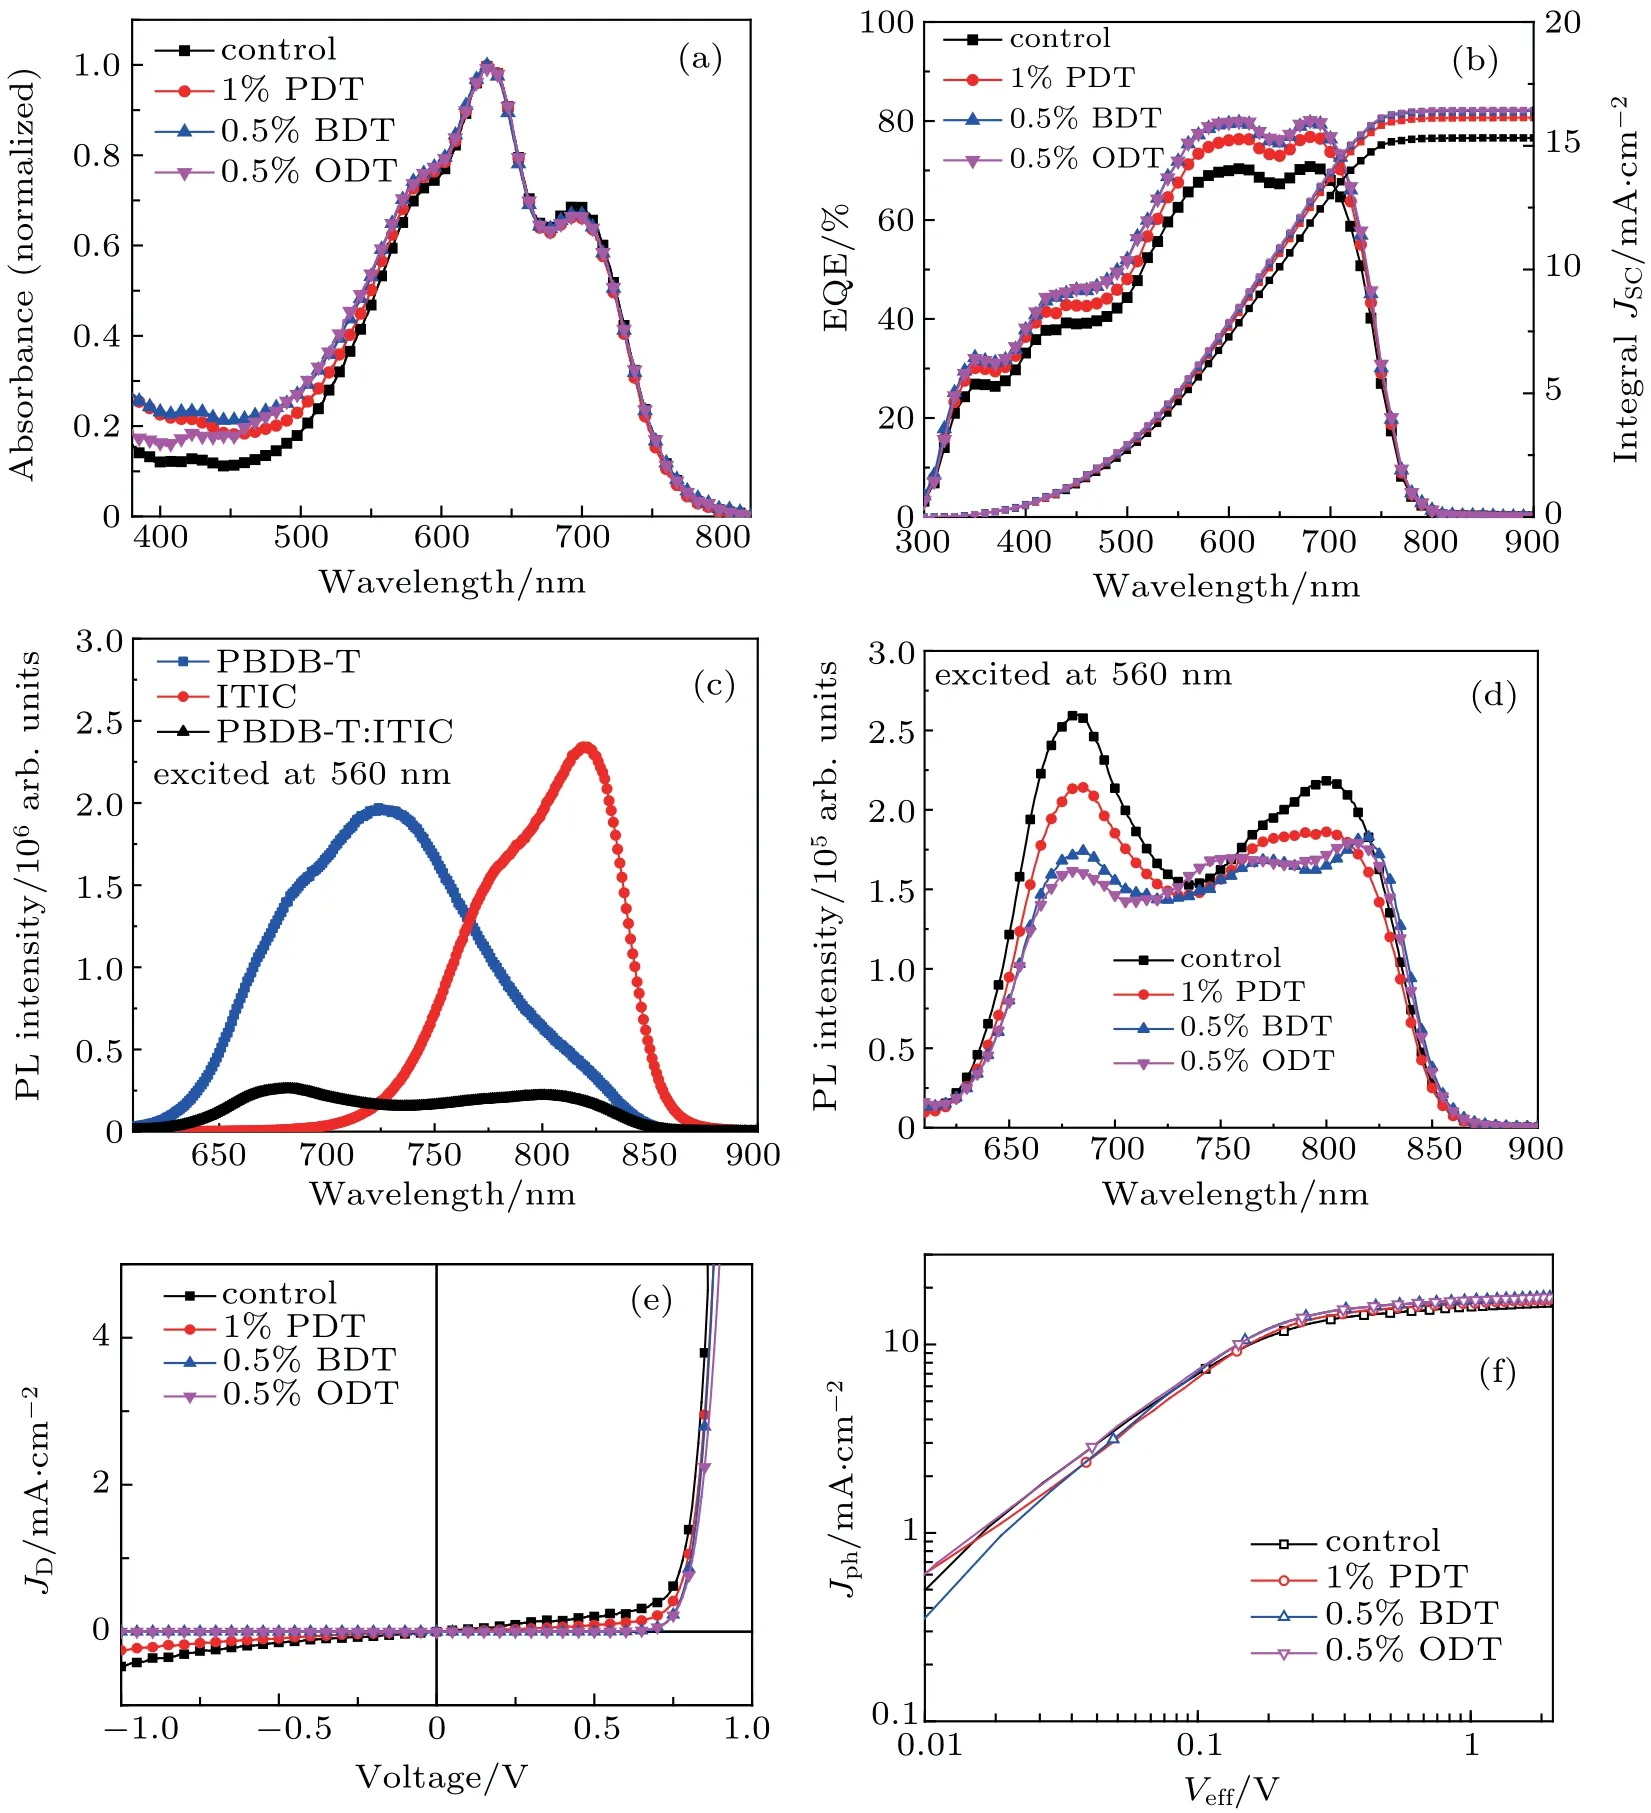
Fig.6. (a)UV-Vis absorption; (b)EQE spectra; (c)and(d)PL spectra of neat PBDB-T,neat ITIC,and PBDB-T:ITIC blended films with or without solvent additives as indicated; (e) the current density measured under dark condition and (f) Jph-Veff curves of PBDB-T:ITIC-based photovoltaic devices with or without solvent additives as indicated.
In order to understand the excitation and charge transfer status in the active layers,photoluminescence(PL)spectra are measured as illustrated in Figs.6(c)and 6(d),and excited at 560 nm where mainly absorbed by PBDB-T. Unblended PBDB-T specimen exhibits a broad, multiple PL emission with a peak at 725 nm, accompanying with shoulders around 685 nm and 820 nm. Pure ITIC specimen shows a double PL emission with a main peak at 820 nm and a shoulder roughly around 780 nm. However, the PL emission of PBDB-T:ITIC blended film exhibits two peaks located at 680 nm and 800 nm with a substantially reduced intensity (see Fig. 6(c)). In addition, the two emission peaks shift away from the emissions of the individual components(PBDB-T or ITIC).Because the range of emission from the blend completely overlaps with the absorption of the ITIC component,[39]an inner filter effect is unavoidable. The emission peak at 680 nm appears to be the residue emission from PBDB-T,while the emission around 800 nm may also be the residue PBDB-T emission.A slightly high fraction in red-end emission may be caused by energy transfer from PBDB-T to ITIC, i.e., the PBDB-T emission is partially absorbed by ITIC and then is re-emitted.Nevertheless, the overall reduction or quenching in emission from the PBDB-T:ITIC blend means that the majority of energy absorbed by ITIC does not generate PL emission. There is an additional quenching channel that is opened. This is rather similar to the investigation where photo-induced electron transfer was found.[39]The emission quenching in donoracceptor pair is often related to the electron transfer, energy transfer,charge transfer,or exciton dissociation process at the D/A interface.[39,46-48]
It can be seen from Fig.6(d)that the addition of solvent additives further leads to an overall reduction in PL emission from the PBDB-T:ITIC blend. At the same time,the emission profiles in the long wavelength range from 750 nm to 830 nm are also altered. This agrees with morphology investigation in the last section that additives are able to re-organize order structure of ITIC crystalline domain,extending the lamellar structure. A better donor/acceptor microcrystal organization will further quench the emission since the more efficient charge transfer channel is opened.
The impact of solvent additives to the excitation status in active layer and the photocurrent in the device can be analyzed via charge generation and recombination process of the devices.[39]The saturation current density(Jsat),maximum exciton generation rate (Gmax), and charge dissociation probabilities P(E,T)can be evaluated from the photocurrent of the devices. The photocurrent density(Jph)is defined as Jph=JLJD, where JLand JDare the current densities measured under illumination and in the dark. Figure 6(e)shows the JD-V curves,which demonstrates rectified characteristics and a substantially reduced dark current. A relationship between Jphand the effective voltage(Veff)is plotted in Fig.6(f)on a double logarithmic scale. Veffis given by Veff=V0-V, where V is the applied voltage and V0is the compensation voltage obtained from the Jph-V characteristics at Jph=0. Assuming the recombination of free charge carriers and space-charge effects can be neglected,the photocurrent through the external circuit is Jph=eGL,where e is the elementary charge,G is the generation rate of charge carriers,and L is the thickness of the active layer. As the applied voltage is increased, the photocurrent of the device reaches saturation (Jsat). At these voltages, all bound e-h pairs are separated and the maximum photocurrent Jsat=eGmaxL is reached,where Gmaxis the maximum exciton generation rate.[49,50]In this work,the saturation current density Jsatis obtained at Veff≈2 V(Fig.6(f)).Thereby,Gmaxcan be calculated through the above formula. The charge dissociation probabilities,P(E,T)=Jph/Jsat,can also be obtained from photocurrent of the device.[50]The Gmaxand P(E,T)obtained at short-current and maximum output power conditions are listed in Table 3. It can be seen from Table 3 that the maximum exciton generation rates Gmaxof devices with solvent additives are all increased due to a general rise in charge dissociation probabilities, which in turn enhances the photocurrent and Jsatin the device when having solvent additives(see Fig.6(f)).
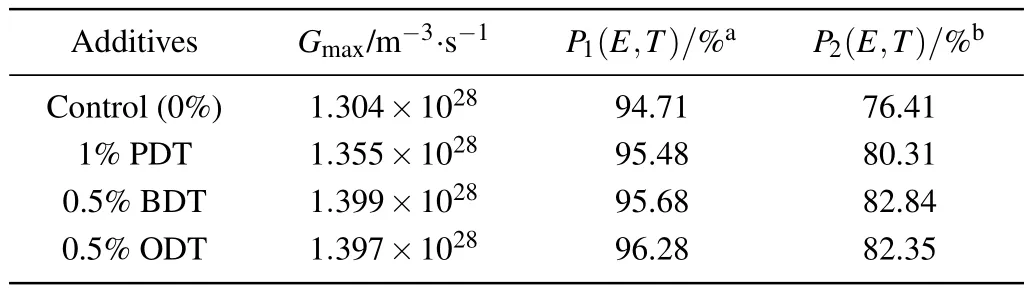
Table 3. The evaluated values of maximum exciton generation rate and charge dissociation probability.
In combination with the morphology result, this can be understood that the solvent additives effectively re-organize the structure in acceptor crystalline domain which promotes the exciton generation by minimizing bimolecular recombination, in which the latter is supported by the observation in the reduction in PL emission. The charge dissociation is enhanced. The investigation well explains the increase in JSCof the devices and the general increase in the EQE spectra.
4. Conclusions
This work investigates the effect of alkylthiol solvent additives(PDT,BDT,and ODT)on photovoltaic performance of PBDB-T:ITIC blended non-fullerene polymer solar cells. It is found that the addition of small fraction of solvent additives effectively improves the device performance. The additives are able to tune the lamellar structure in acceptor ITIC crystalline domain in the active layers,with an increase in correlation length from 197 ?A of the control device to 246 ?A of device having 0.5%ODT.The above result is an indication of the crystalline order improvement,extending lamellar structure in the crystalline phase of ITIC domain. The morphology order improvement may in turn increase the charge generation rate or enhance charge dissociation probabilities.A reduced charge recombination process has been observed from the photoluminescence reduction. The effect results in an enhancement in photocurrent and PCE of the device. The champion PCE of the solar cells reaches 9.44%from the device with 0.5%ODT in the active layer,which is a 16%improvement compared to the control device without additives.
Acknowledgment
Authors would like to express their gratitude to technicians of Medium Instrumental Laboratory, College of Chemistry and Molecular Engineering, Peking University for their kind assistances in PL measurements.

- Chinese Physics B的其它文章
- Study on the nitridation of β-Ga2O3 films?
- Thin-film growth behavior of non-planar vanadium oxidephthalocyanine?
- Monolithic semi-polar(1ˉ101)InGaN/GaN near white light-emitting diodes on micro-striped Si(100)substrate?
- Spectral properties of Pr:CNGG crystals grown by micro-pulling-down method?
- Quaternary antiferromagnetic Ba2BiFeS5 with isolated FeS4 tetrahedra
- Effects of oxygen vacancy concentration and temperature on memristive behavior of SrRuO3/Nb:SrTiO3 junctions?