Impacts of rainfall and catchment characteristics on bioretention cell performance
2019-07-24 07:34:44YnweiSunChristinePomeroyQingyunLiCundongXu
Water Science and Engineering 2019年2期
Yn-wei Sun *, Christine Pomeroy , Qing-yun Li Cun-dong Xu
a School of Water Conservancy, North China University of Water Resources and Electric Power, Zhengzhou 450011, China
b Department of Civil and Environmental Engineering, University of Utah, Salt Lake City, UT 84112, USA
Abstract Although many studies have evaluated the impacts of bioretention cell (BRC) design elements on hydrologic performance, few have investigated the roles played by site characteristics and rainfall patterns. The objectives of this study were to assess the impacts of rainfall and catchments with different characteristics on the hydrologic performance of BRCs and identify important factors in sizing bioretention when hydrologic performance was oriented for the design using a modeling approach. A 10-year record of rainfall data was used to identify the frequency and magnitude of rainfall events. The results showed that although the small and medium rainfall events were dominant they contributed less to the total rainfall depth than the large rainfall events. The ratio of runoff coefficient to imperviousness can be used as an indicator to explain why BRCs perform differently with the same design strategy under the same rainfall events.Rainfall patterns had significant impacts on the hydrologic performance of BRCs by influencing the overflow and underdrain flow.BRCs performed better for rainfall events with a longer duration and lower rainfall intensity because they generated smoother runoff processes into the BRCs.On the basis of these results,the runoff coefficient is suggested for BRC surface design.
Keywords: Bioretention cell; Rainfall; Runoff; Hydrologic model; Stormwater management model (SWMM)
1. Introduction
Many studies have shown that the larger impervious surface areas created by urbanization increase stormwater volume,discharge rate, and the flow of pollutants into waterways(Barco et al., 2008; Chen et al., 2017; Fletcher et al., 2013).The traditional approach to stormwater design is to treat stormwater as a nuisance and risk to be disposed of via engineered systems with little regard for the receiving waters.Nowadays, the management of urban stormwater is undergoing a transition from engineered systems for hydrologically efficient disposal to a philosophy that integrates a range of distributed, multi-functional elements (Segaran et al., 2014).In response, many regulatory agencies and researchers are recommending the use of a source control technique to manage stormwater runoff in areas under urbanization, and a retrofit technique in developed areas.
As the focus of new stormwater regulation rules shifts from past event peak flow control to novel stormwater control measures (SCMs), prioritizing water quality and annual hydrologic balance, in addition to peak flow reduction, infiltration and flood control are becoming necessary (NRC, 2008).These SCMs take advantage of natural processes, incorporating soil or other media and vegetation into the treatment,shifting the cycle back to more closely resemble the natural system, and encouraging infiltration and evapotranspiration(ET) of excess water (Davis et al., 2012).
Bioretention cells (BRCs), and related bioinfiltration facilities, are among the most commonly used SCMs in urbanized areas. BRCs offer a range of potential benefits through chemical, physical, and biological processes including infiltration increase, peak runoff reduction, contaminant attenuation, and temperature mitigation (Liu et al., 2014). A substantial number of field and laboratory studies have documented the hydrologic performance and water quality improvement of BRCs at various scales and geographic locations (Chapman and Horner, 2010; Chen et al., 2013; Dietz and Clausen,2005;Davis,2008;DeBusk and Wynn,2011;Jia et al., 2015; Jones and Davis, 2013; Hunt et al., 2012; Li and Davis, 2016; Lucas, 2010; Turk et al., 2017). The runoff reduction rate found in the literature mentioned above ranges from 40% to 99%, indicating the variation in hydrologic performance of BRCs.
There are many factors influencing the performance of a bioretention system, such as size of the system relative to its catchment, depth of the filter media, vegetation types, soil type, and construction and maintenance of the system (Nocco et al., 2016; Shrestha et al., 2018; Winston et al., 2016). Li et al. (2009) monitored the hydrologic performance of six BRCs with different surface areas and media depths in Maryland and North Carolina, and reported different hydrologic performances. The sizing of biofilters was also emphasized by Brown and Hunt (2012), who found greater reductions in runoff volume with greater media depth. A larger-sized BRC improves the performance because of the increased pool and media(pore)storage volume,known as the internal water storage(IWS)(Hunt et al.,2012).Carpenter and Hallam (2010) demonstrated that the percentages of sand,fines,and organic matter in BRC media strongly influence the hydrologic performance in field applications. Additionally,vegetation can promote infiltration in aging BRCs by creating macropores around root channels and decreasing antecedent moisture content through the ET of soil water between rainfall events(Li et al.,2009).BRCs constructed at sites with sandier underlying soils have greater exfiltration than those with tighter underlying soils,and hydrologic functions of BRCs are also affected by the proper soil mixture selection or placement and vegetation establishment (Lee et al., 2016; Brown and Hunt, 2011). Carpenter and Hallam (2010) showed that infiltration rates in bioretention systems are strongly influenced by construction practices, which in turn influence the hydrologic performance. Poor construction has been regarded as being responsible for the development of preferential flow paths within the soil media of a BRC (Roy-Poirier et al., 2010). In addition, during construction and post-construction, clogging has been identified as a primary cause of BRC failure in the absence of appropriate pretreatment and maintenance (Brown and Hunt, 2010; Gregory et al., 2006).
Extensive research on the design elements affecting flow control of BRCs and installation experiences has assisted in the evolution of bioretention design recommendations for a better hydrologic performance (Hunt et al., 2012). A wide range of sizing methods have been developed across the United States.Muthanna et al. (2007)provided a detailed description of eight approaches applying two common factors in all methods: site imperviousness and design rainfall depth. However, the design approaches based on a fixed area percentage may not appropriately address both water quality and water quantity objectives(Roy-Poirier et al.,2010).More recently,based on the fact that volume of bioretention media is the primary flow-control factor, Davis et al. (2012) suggested using the concept of bioretention abstraction volume(BAV),which is directly related to available media porosity and storage in the surface bowl, to examine the hydrologic performance of BRCs and their research can provide a quantitative design tool for bioretention in urban stormwater management.
While extensive research on the behavior and design strategies of BRCs has been published, little information is available on the impacts of rainfall pattern, magnitude, and catchment characteristics on the hydrologic performance.Clearly, rainfall intensity and pattern will both influence overflow and drainage performance. Regardless of configuration,intense rainfall of a long enough duration will exceed the infiltration rate of the bioretention media, leading to filling of the surface storage and eventual overflow. It is also clear that,for smaller storms, a significant benefit is that no runoff is released to the surface water (Davis et al., 2012). In addition,catchment characteristics are also an important factor influencing facilities.The catchment with a larger impervious area will generate more runoff for a similar rainfall event and consequently might need a larger-sized BRC. Therefore, not surprisingly, biorentention facility performance is primarily underpinned by these two external factors of rainfall and catchment characteristics since a BRC is always related to a specific area.
In this study, we used a modeling approach to predict the hydrologic performance of BRCs receiving runoff from different land use types and rainfall patterns.The objectives of this study were to (1) determine the impacts of rainfall and catchments with different characteristics on the hydrologic performance of BRCs, and (2) identify important factors in sizing bioretention when hydrologic performance was oriented for the design.
2. Methodology
2.1. Site description and approach
The 0.36-km2urban catchment in the Little Mill Creek Watershed, in East Lenexa, Kansas City, Missouri, was selected in this study. The catchment has medium-density residential land use, with 46% imperviousness and a conventional separated stormwater drainage system.A real catchment was used in this study to allow for realistic configurations of subcatchments and drainage elements,but hypothetical on-site BRCs were used. The location of the study area in the Little Mill Creek Watershed is illustrated in Fig. 1.
Using a theoretical modeling scenario, the study examined the differences in watershed response when BRCs were placed so as to treat all land use types, including impervious and pervious areas.The model was based on the existing condition modeled and implemented using the stormwater management model (SWMM) developed by the United States Environmental Protection Agency (EPA) (Karuppasamy et al., 2009;Postel et al., 2009). A time step of 15 min was chosen for the wet period, and a time step of 30 min was chosen for the dry period to stress the dry gaps between the rainfall events.

Fig. 1. Location of study area in Little Mill Creek Watershed.
2.2. Existing conditions
To improve the accuracy of the model, a base model was developed to represent the existing conditions of the study area where no SCMs were included. Field surveys were performed to collect information about existing stormwater practices. Information about pipes, soil attributes, open channels, and land use types was obtained for the study area.Subcatchments were then delineated with major intersection points throughout the network of the study area. These were determined using a geographic information system (GIS), aerial imagery, and field data.After being validated and entered into a GIS,the data were simplified and imported into the EPA SWMM,which was used for the hydrologic modeling in the study. This model did not include any SCM practices, although an existing drainage system was included. The model of the existing conditions was compared against measured flows for calibration. Nash-Sutcliffe efficiency coefficients for the flow of the selected six single rainfall events were greater than 0.78. Some of these errors may have been caused by a difference between the recorded precipitation and the actual precipitation falling across the watershed. Fig. 2 shows the measured and modeled flows for a 6.22-cm storm event that occurred on October 20, 2008.
2.3. BRC treatment model
The model was developed to test the performance of BRCs for different rainfall events and land use scenarios within the study area.To do this,a model of the BRCs was placed at the outlet of each subcatchment,and all runoff was routed through the cell before being discharged into the rest of system. In order to avoid water exchange between subcatchments, subcatchments were delineated based on their geographic location to allow an independent runoff process. Meanwhile, each subcatchment contained one BRC for the performance analysis. This resulted in the distribution of 19 BRCs throughout the watershed. Other than the addition of these practices, the model remained the same as the existing model.
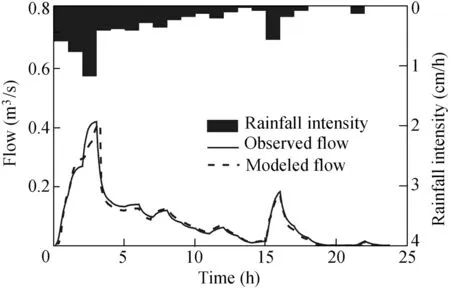
Fig. 2. Measured and modeled flows for storm event on October 20,2008.
Many of the BRCs received runoff from a subcatchment area greater than 1 hm2. In these cases, it is assumed that the modeled BRC is representative of several smaller-scale BRCs throughout each subcatchment.Several studies have supported the conclusion that BRCs may be larger-scale in this manner for modeling purposes (James and Dymond, 2012).
BRCs were sized using the bioretention design sheet for East Lenexa, Kansas City. It is a Darcy's law-based method considering both rainfall depth and site imperviousness, and BRCs are sized to capture water quality volume(VWQ).Table 1 illustrates different steps of the design procedure and the parameters used in this study. Modeled BRCs in this study used the recommended ponding depth of 15.2 cm,and a filter media hydraulic conductivity of 3.05 cm/h.The hydraulic conductivity rate of native soil was 0.64 cm/h,and the hydraulic conductivity of the root zone and storage zone was assumed to be 1 cm/h at a depth of 61 cm. Additionally, to simulate a typical BRC, the RECARGA model was used for sizing the underdrain to control the drawdown time to less than 48 h. Finally, 2.54 cm was selected as the underdrain diameter for BRCs.
The simulation results showed that the BRC sizing area approximated 6% of the impervious area for each subcatchment. However, the bioretention surface area with a 5%impervious area was used for all the subcatchments in this study due to the limited available area.The impervious area of the subcatchments ranged from 947 m2to 15349 m2,resulting in the BRC surface area ranging from 47 m2to 767 m2, as shown in Fig. 3. Of the 19 subcatchments S1 through S19,seven were residential, with imperviousness of less than 40%and the remaining 12 were commercial, with imperviousness of greater than 40%.
Bioretention modeling in this study only included the 15-cm surfacestorageportionofthepractice,atwhichpointflows were diverted through an outlet weir.Any runoff exceeding the ponding depth of 15 cm was discharged through an overflow structure.Because no water quality data for the modeled watershed existed at the time of this study for calibration purposes,the focus of the study remained on the hydrologic impacts of these practices.Outflows from the BRCs were routed to the junction located at the outlet of each subcatchment. Flows from each subcatchment were then routed by the drainage system represented by conduits in the SWMM. The SWMM-based model schematic diagram is shown in Fig.4,where SN1,SN2,and SN3 are subcatchments without BCRs.

Table 1Bioretention sizing method used by design sheet for East Lenexa, Kansas City.
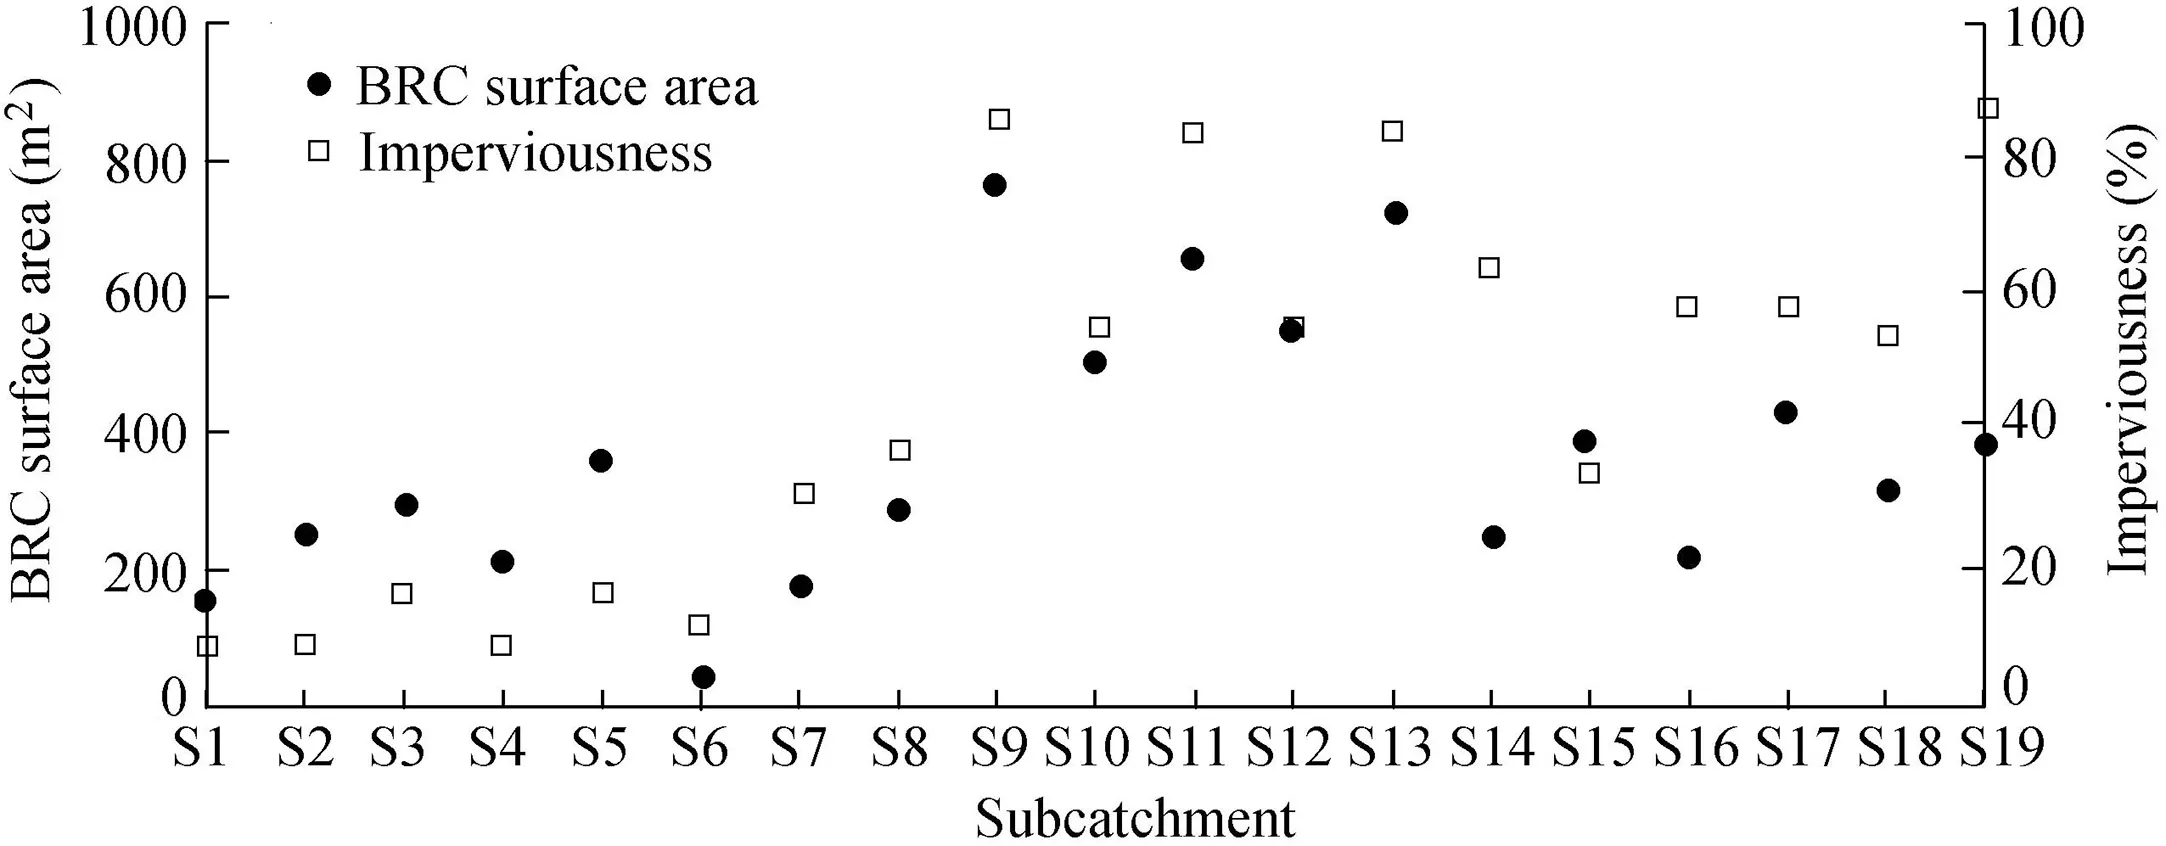
Fig. 3. Imperviousness and BRC surface area of subcatchments.
2.4. Rainfall and evaporation
Hourly rainfall data extending from August, 1948 to February,2010 for the Kansas City Downtown(KCD)Airport(gauge number 234359) are available from the National Climatic Data Center (NCDC). Rainfall patterns at the KCD gauge were assumed to closely approximate the rainfall patterns in the study area. The KCD precipitation record was analyzed to determine the appropriate 10-year period for the analysis. Considering the data gap, larger event distribution,and total rainfall depth,the period of the record spanning from 1968 to 1977 was chosen as the period for the continuous simulation analysis.The reason for the selection of this period was that the record during the full period contained the two largest rainfall events. In addition, the mean annual precipitation for this period is 94.84 cm,which is only 2.62 cm larger than the average annual precipitation for the full record.
The evaporation rate was modeled as a set of monthly average values.Final values of evaporation rate were obtained from the U.S. National Centers for Environmental Protection(NCEI). Table 2 shows the monthly average evaporation rates used for this study.The BRCs also used the evaporation values in Table 2 during the rainfall period and it was assumed that at the beginning of each rainfall event, the water content at the planting bed was at field capacity.
2.5. Data processing and analysis
Runoff volume control is the fundamental hydrologic consideration and component for SCMs because the most direct and obvious consequence of urbanization is the increase of surface runoff volume. Roverflow, Runderdrain, and Routflowwere chosen to express a direct knowledge of bioretention performance on the runoff volume control,defined as follows:
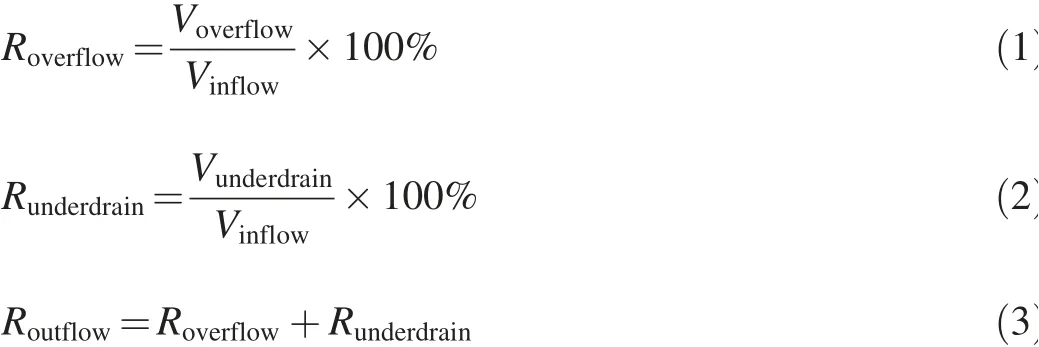
where Voverflowis the volume of stormwater runoff flowing out from the BRCs due to exceedance of the BRC ponding area for the entire period (this part of the stormwater flows out of the BRCs directly without infiltration or ponding in the facility); Vinflowis the volume of stormwater flowing into the BRCs for the entire study period; Vunderdrainis the volume of stormwater flowing out from the BRCs through the underdrain;and Routflowwas an indicator representing the ratio of stormwater flowing out from the BRCs,which included the overflow and underdrain flow.
Water that did not leave the BRCs as outflow or overflow was hypothesized to have left the cell via exfiltration or ET(although ET would be minimal during the winter months).Outflow from BRCs included both overflow and underdrain flow.

Fig. 4. Schematic diagram of SWMM model routing.
3. Results and discussion
3.1. Hydrologic performance
The model was run for the 10-year rainfall data series using a time step of 15 min.The overall hydrologic performance for the 19 simulated BRCs (B1 through B19) is shown in Fig. 5.Throughout the study period, a total of 1282480 m3water entered the BRCs, whereas 599180 m3exited the BRCs,producing a cumulative volume reduction of 53.28%. The volume reduction, when calculated for each individual BRC,ranged from 42.05% to 57.23%. According to the detailed discussion of BAV (Davis et al., 2012), an overflow occurs when the BAV is filled, or the intense rainfall exceeds the infiltration rate of the bioretention media after the surface storage is full. This can be caused by a medium event with a short duration and high intensity. The overall Roverflow,Runderdrain, and Routflowvalues in the study area were 30.55%,16.17%, and 46.72%, respectively. The mean values for Roverflow, Runderdrain, and Routflowwere found to be 31.71%(standard deviation (SD) was 4.79%), 16.72% (SD was 2.30%), and 51.95% (SD was 5.05%), respectively.
Statistical analyses verified that the water volume entering the BRCs was significantly greater than that leaving the BRCs(the significant test results showed that p = 2.40 × 10⁻⁷). As would be expected, statistical analysis also identified a negative linear relationship between inflow and outflow(R2= 0.979, where R2is the coefficient of determination). Apositive linear relationship is also noted between the inflow and overflow(R2=0.927),indicating that a larger inflow has a greater chance of producing outflow.

Table 2Monthly average evaporation rates.
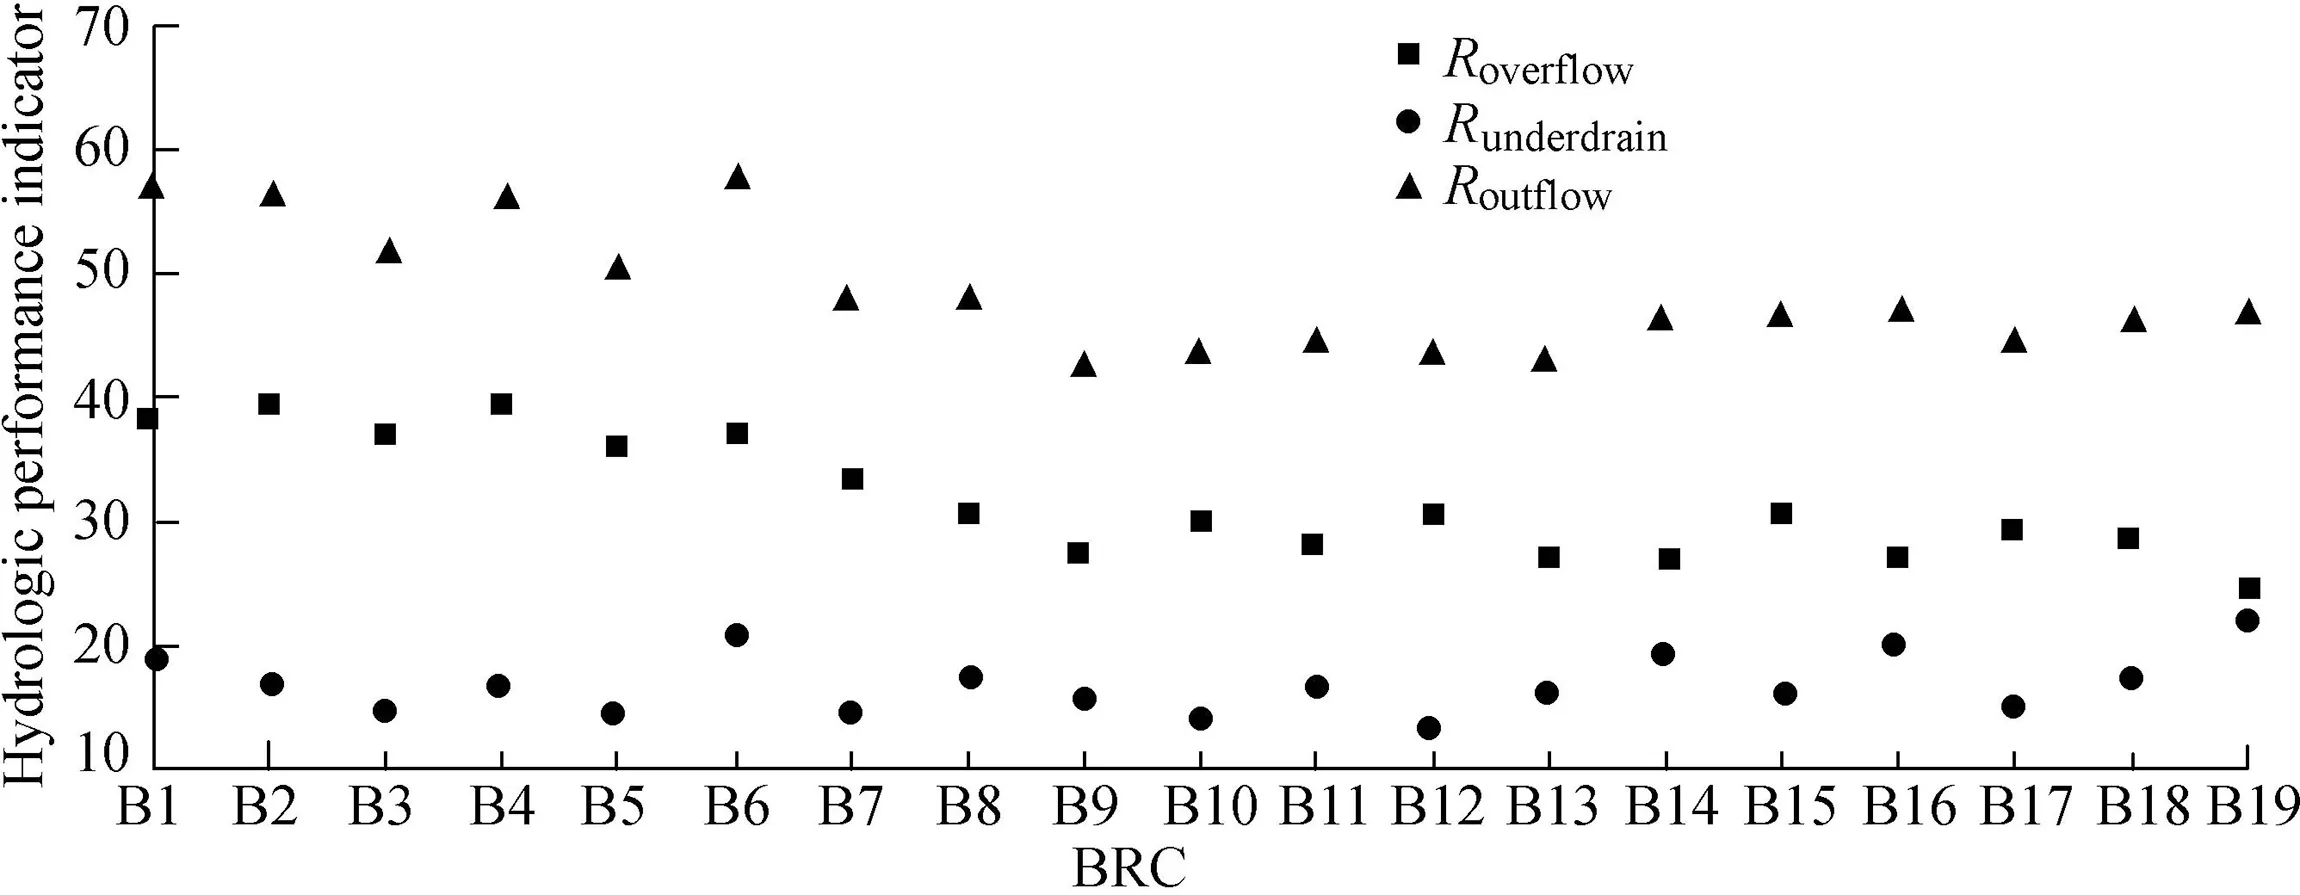
Fig. 5. Runoff control performance of BRC.
3.2.Impact of rainfall event characteristics on hydrologic performance
Clearly, rainfall patterns will influence the runoffgeneration process and result in different inflows into the BRCs.Regardless of configuration,intense rainfall with a long duration may cause the inflow to exceed the infiltration rate of the bioretention media, leading to filling of the ponding area and eventual overflow.However,current design criteria do not take rainfall characteristics such as rainfall intensity or rainfall duration into consideration, and only use the rainfall depth to calculate the BRC surface area. For example, a rainfall depth of 2.54 cm is a typical value used to calculate the BRC surface area, with the goal of treating all the runoff generated by rainfall depth less than 2.54 cm.However,the goal may not be accomplished when the rainfall event is short and intense,even with rainfall depths less than 2.54 cm.
To examine the impacts of rainfall duration and intensity on the hydrologic performance of BRCs, an analysis of 59 years(1950-2008) of rainfall data was conducted, and ten single rainfall events were selected, listed in Table 3. Selection took account of both the magnitude and duration of rainfall events.The selected rainfall events covered small, medium, and large episodes. Rainfall depth ranged from 1.27 cm to 7.47 cm,representing small events to large events. Two patterns of rainfall distribution were selected: short duration with high rainfall intensity, and long duration with relatively low intensity. These two types led to two different rainfall-runoff processes because the first pattern will generate a steeper hydrograph with greater peak flow and total runoff, while the second pattern will generate a gradual hydrograph. These ten single rainfall events can be classified into five groups. For each group,the rainfall events had the same rainfall depth but with different durations, indicating two different patterns of rainfall distributions. These ten single rainfall events were applied to the bioretention cell B1, in subcatchment S1. The surface area of B1 according to the design sheet for East Lenexa City, was 142 m2, with the goal of treating all the rainfall events less than 2.54 cm.The hydrologic performance for the different cases is shown in Table 3.
Table 3 confirmed previous findings that BRCs performed better for small rainfall events. When the rainfall depth was 1.27 cm,there was no overflow for the two patterns of rainfall events. However, the hydrologic performance of the BRCs showed significant differences when the rainfall depth exceeded 1.27 cm. When the rainfall depth was 2.54 cm, a rainfall event lasting 3 h resulted in 20.75% overflow and 58.74%outflow. Despite the fact that most of the small rainfall events were dominant, the large rainfall events contributed most of the rainfall volume. A total of 883 rainfall events were recorded at the Kansas City Downtown Airport from January 1960 to December 1969. The events that produced less than 0.038-cm rainfall depth did not create any runoff, or else contributions to the BRCs were assumed negligible.To assess the impact of rainfall characteristics on hydrologic performance of BRCs,rainfall depth and frequency were analyzed to examine the distribution of the events.
Of the evaluated 883 events, 455 were classified as small events (with rainfall depth ranging from 0.038 to 0.635 cm),accounting for 51.5% of the total; medium events (with rainfall depth ranging from 0.635 to 1.27 cm and from 1.27 to 2.54 cm, respectively), accounting for 32.2%; large events(with rainfall depth ranging from 2.54 to 5.08 cm),accounting for 11.9%; and very large events (with rainfall depth greater than 5.08 cm), accounting for only 4.4% of the data set(Fig.6).Most of the rainfall events selected were classified as small and medium rainfall events. Numerous studies have confirmed that bioretention provides better performance for small events. The rainfall statistics presented in this study confirmed previous findings, but it was interesting to find that although the small and medium rainfall events were dominant(accounting for 83.7% of the total rainfall events) among the storm events analyzed, they only contributed approximately 42.3%to the total rainfall depth.The events with rainfall depth greater than 5.08 cm accounted for 4.4%in number of events,but contributed 39% to the total rainfall depth. This finding may imply that if the BRCs or other SCMs focus on controlling small or medium rainfall events, it will be difficult to mimic the predeveloped hydrologic regime because the large events still contribute most of the surface runoff.
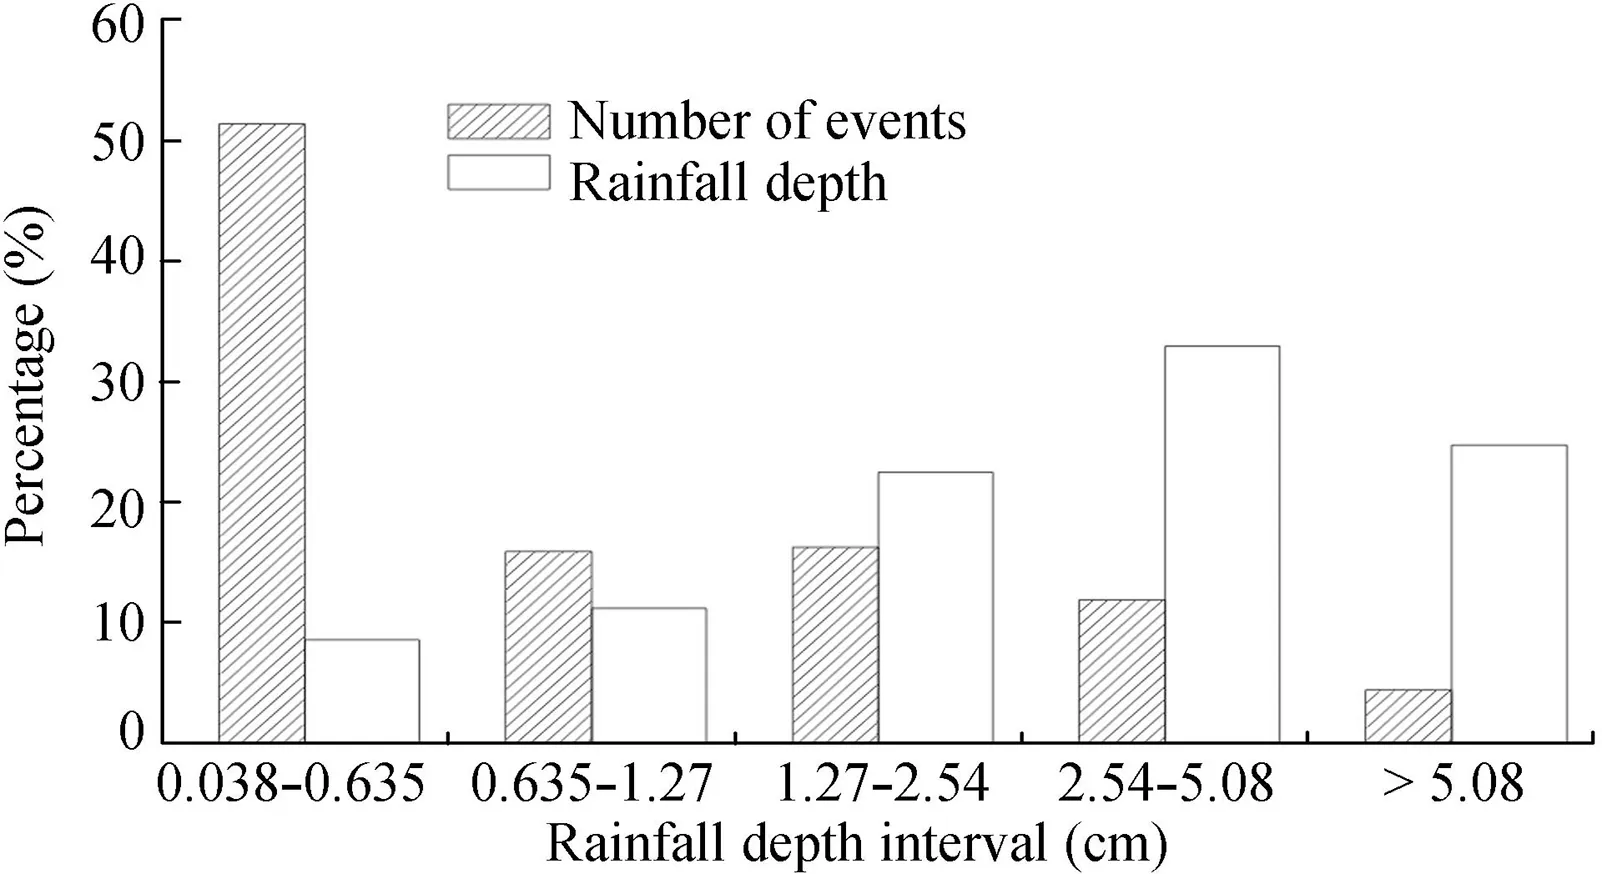
Fig.6.Fractions of number of rainfall events in different categories to total rainfall events and rainfall depth in different categories to total rainfall depth.
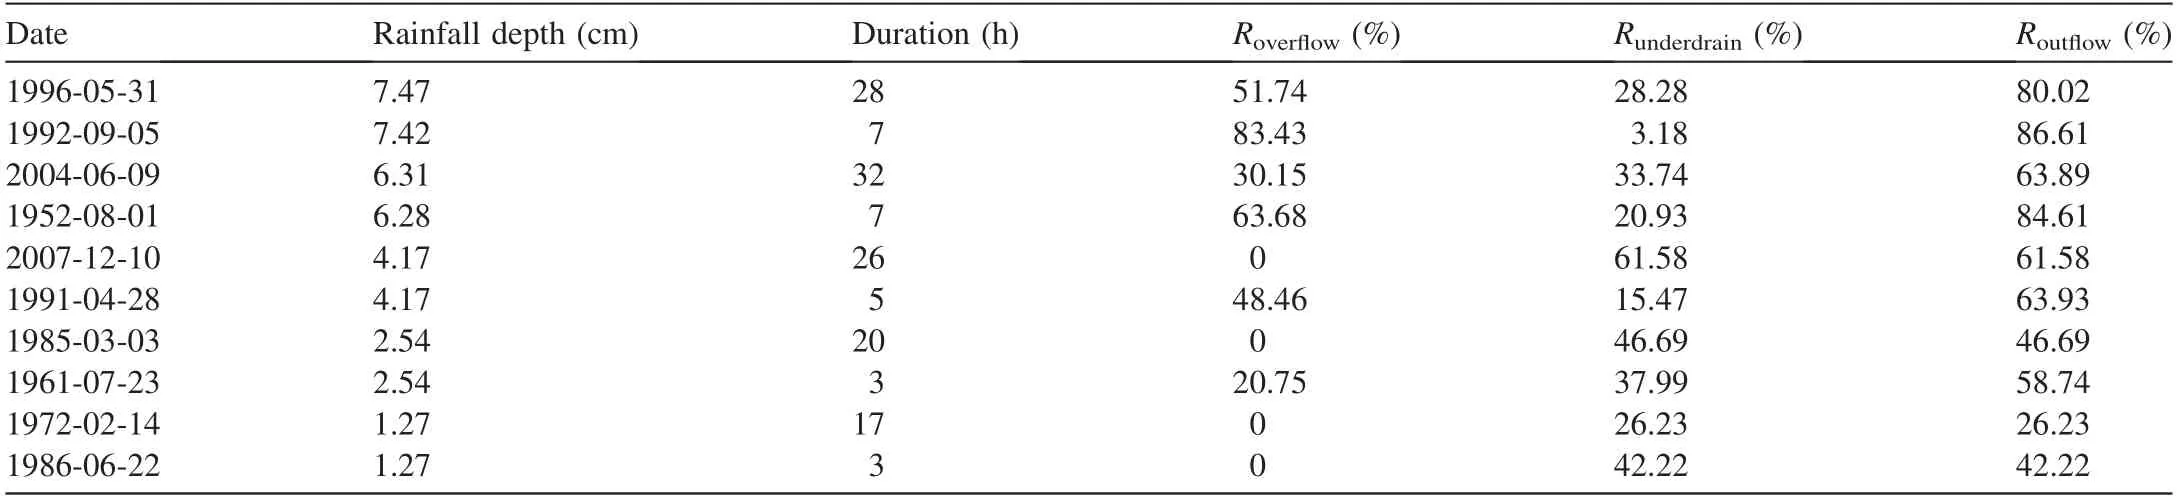
Table 3Runoff control performance of selected single rainfall events.
It is also demonstrated that duration can have a significant impact on the hydrologic performance of the BRC. When the rainfall depth was 2.54 cm, the rainfall event with a duration of 20 h generated no overflow and all the runoff was treated,as expected by the design goal.However,when the duration was 3 h,21%of the runoff became overflow without being treated,and the goal of treating all the runoff generated by rainfall events with depths less than 2.54 cm failed. The same conclusions were found for the rainfall depths of 4.17 cm,6.28 cm, and 7.42 cm. These findings indicate that rainfall patterns have a significant influence on the BRC performance and short and intense rainfall events may cause the design goal of the BRCs to fail. One possible reason is that the rainfall intensity is much greater than the infiltration rate of the media soil and native soil.
It was consequently important to understand rainfall distribution in the study area. A duration analysis covering 566 rainfall events was conducted, and rainfall events of short duration accounted for a significant proportion, especially for the small and medium events(Fig.7).For events with rainfall depth ranging from 2.54 to 5.08 cm,a duration of less than 4 h contributed approximately 28%of the total rainfall depth.For the rainfall events with rainfall depth greater than 5.08 cm, a duration of less than 7 h accounted for approximately 37% of the total rainfall depth. It is consequently recommended that an analysis be conducted to determine the rainfall pattern for the study area,and that the intense rainfall events with a short duration should be taken into consideration to achieve the best performance for all the rainfall events.

Fig. 7. Fractions of total rainfall depths that matched designated rainfall depth and duration.
Underdrain pipes, though easily ignored, are important when the designers focus on water quality improvement of the BRC. The flow through an underdrain, although it contributes to the surface flow eventually, is treated by the BRC media,and the water quality is improved. Table 3 shows that rainfall distribution influenced the underdrain flow significantly for a rainfall event with a depth greater than 1.27 cm.For example,when the rainfall depth was 2.54 cm, Routflowwas 46.69% for the rainfall event lasting 20 h, and 58.74% for the rainfall event lasting 5 h. For the longer-duration events, the outflow,though still significant, consisted of underdrain flow, which flowed through the BRC media and the water quality was improved. For a rainfall depth of 4.17 cm, differences in underdrain flow for the two rainfall events with different durations were more significant, and were found to be 61.58%and 15.47%,respectively.Similar findings were also found for the very large rainfall events with rainfall depths of 6.28 cm and 7.42 cm. For rainfall events with a long duration and low rainfall intensity,BRC will yield a smaller Roverflowand larger Runderdrain, which are beneficial for both water quantity and water quality control.
3.3.Impacts of imperviousness on hydrologic performance
A clear difference was observed for all the hydrologic performance metrics among the 19 BRCs simulated. All the BRCs had the same design elements of ponding depth, root zone depth and soil, and native soil, except for surface area.Additionally, all the BRCs received runoff from the same rainfall events. As would be expected, the bioretention surface area is a factor influencing the performance of BRCs.Logarithmic regression equations were used to evaluate relationships of BRC surface area versus Roverflow, Runderdrain,and Routflow, as shown in Fig. 8. However, no strong relationships were found with R2values smaller than 0.562,indicating that BRC surface area might not be the dominant factor influencing the runoff volume control performance of BRCs.When different land use scenarios are considered for a specific area, a larger BRC surface area will generate less outflow and overflow.
Considering that the BRC surface area is 5% of the impervious area for each subcatchment, it is to be expected that imperviousness, instead of BRC surface area, is the dominant factor influencing the performance of BRCs. The logarithmic regressions confirmed that there are significant relationships between subcatchment imperviousness and Roverflowand Routflow, and the greater the imperviousness, the better the hydrologic performance (Fig. 9). These results indicate that BRCs installed at locations with greater imperviousness may result in better hydrologic performance when the BRC surface area is calculated simply with the subcatchment imperviousness. However, no strong relationships between Runderdrainand subcatchment imperviousness or BRC surface area were noticed. A possible reason might be that the component of the underdrain flow is much more complicated, as it is related to the inflow, BAV of BRC, and soil properties like saturated hydraulic conductivity.
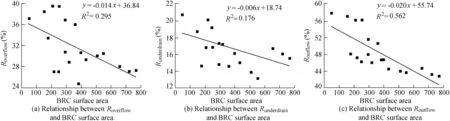
Fig. 8. Linear relationships between BRC surface area and hydrologic performance indicators.
Taking a close look and exploring the reasons why imperviousness, instead of BRC surface area, influences hydrologic performance of BRCs leads to a consideration of the design methods used for the BRC surface area. In this study, for the BRCs, all the design elements except surface area were the same.When the inflow into the BRCs exceeded its infiltration rate, ponding and overflow occurred. Obviously, in this case,the hydrologic performance of the BRCs was a function of both the inflow and bioretention surface area, and consequently,differences in inflow depth over the BRC surface area were the reason why BRCs were found to perform differently.BRCs with greater inflow depth over the surface area were more likely to generate a lower percentage volume reduction because of the larger denominator values.Strong relationships between inflow depth and Roverflowand Runderdrainwere noticed,with higher R2values (Fig. 10). The conclusion was reached that inflow depth is the dominant factor in determining the outflow and overflow of BRCs when the BRCs have been sized. However, no significant relationship was found for the underdrain flow, due to the complicated influencing factors.
The inflow depth per unit surface area of BRC can be expressed as


Fig. 9. Linear relationships between subcatchment imperviousness and hydrologic performance indicators.
where D is the inflow depth over the BRC surface area, A is the drainage area of the subcatchment, C is the runoff coefficient, P is the rainfall depth for each single rainfall event,and m is the imperviousness.ACP is the calculated total generated inflow to the BRC for a single rainfall event, while 5%Am is the calculated BRC surface area. The equation can be written as

Eq. (5) indicates that the inflow depth over the BRC surface is dependent on three factors: runoff coefficient, rainfall depth, and subcatchment imperviousness. A higher inflow depth over the BRC surface area may consequently generate more overflow and outflow. Considering that all the subcatchments and BRCs shared the same rainfall depth, it was clear that only the two factors of runoff coefficient and imperviousness caused the differences in performance of the different BRCs. Though imperviousness has been used frequently to calculate the BRC surface area, the runoff coefficient, on the other hand, has rarely been mentioned. The runoff coefficient in a catchment for a given rainfall depth is a function of a series of site characteristics, such as slope,Manning's roughness coefficient n on the pervious and impervious areas, depression depth on the pervious area, and imperviousness of the catchment. Consequently, it is believed that incorporating the runoff coefficient into the BRC design would generate a more satisfactory result when different land use scenarios exist in the study area. This is an important finding regarding the reasons that BRCs may perform differently when the rainfall events and design criteria are the same.
Furthermore,the BRC surface area was calculated using the runoff coefficient, instead of imperviousness, and the results showed that residential areas will generate a larger BRC surface area while commercial areas will generate a smaller BRC surface area. The threshold of imperviousness in this study was 38%, indicating that, when the imperviousness of the subcatchment was less than 38%, it generated a larger BRC surface area and vice versa. Taking the study area as an example, of the 19 subcatchments only six fell into the category of imperviousness less than 38%, accounting for 31.6%.In addition, the model was run again with the BRC surface area generated by a runoff coefficient-based design,and it was found that the overall Roverflow,Runderdrain,and Routflowvalues in the study area were 28.56%, 15.98%, and 43.76%, respectively. The mean values for Roverflow, Runderdrain, and Routflowwere 29.65% (SD was 2.12%), 15.98% (SD was 0.96%) and 48.97% (SD was 1.59%), respectively. The overall performance improved slightly but the SD values have decreased significantly, indicating that the application of a runoff coefficient may have a significant impact on different land use scenarios.
4. Conclusions
The EPA SWMM was used to model the hydrologic performance of BRCs and obtain a modeled estimate of the percentages of overflow, outflow, and underdrain flow.Although the BRC surface area was only 5% of the subcatchment impervious area,BRCs were successful in reducing flow volumes.Based on the 10-year long-term simulation, the cumulative outflow was found to be 599180 m3, accounting for 46.72% of the total inflow, resulting in a cumulative volume reduction of 53.28%with significant potential recharge to groundwater. Underdrain flow accounted for 16.17% of total inflow,though it became outflow eventually,and resulted in an improvement in water quality since it flowed through the media zone, which is the dominant factor for water quality improvement of the bioretention cell.
In addition to magnitude, rainfall distribution had a significant impact on the hydrologic performance of the BRC for a given rainfall depth. Rainfall events with longer durations and lower rainfall intensity resulted in less overflow, less outflow, and more underdrain flow. Furthermore, they generated a lesser inflow depth to the BRCs, which also promoted infiltration in the BRC media zone and native soil. This study also highlighted the fact that inflow depth was the dominant factor influencing the hydrologic performance of BRCs.When the BRC was sized using imperviousness,the inflow depth was related to three factors, including runoff coefficient, rainfall depth, and imperviousness. The impervious area contributed most of the runoff and,consequently,the imperviousness ratio was used as an important parameter to calculate the BRC surface area.However,a runoff coefficient based on more site characteristics, such as slope, Manning's n (on the pervious and impervious areas), depression depth on the pervious area,imperviousness of the catchment, and rainfall event characteristics,may be used as the design parameters to calculate the BRC surface area.
In conclusion, rainfall patterns and site characteristics generate different inflow distributions to the BRCs and cause a variation in hydrologic performance,and consequently may be used for the design of BRCs.
 Water Science and Engineering2019年2期
- Water Science and Engineering的其它文章
- Flume experimental study on evolution of a mouth bar under interaction of floods and waves
- Porosity and permeability variations of a dam curtain during dissolution
- Numerical simulation of flow separation over a backward-facing step with high Reynolds number
- Possibilities and challenges of expanding dimensions of waterway downstream of Three Gorges Dam
- River bank protection from ship-induced waves and river flow
- Submerged flexible vegetation impact on open channel flow velocity distribution: An analytical modelling study on drag and friction