基于土壤水分異質性的小麥滴灌試驗小區布設方法
2017-12-15 02:48:26王鵬翔陳智芳申孝軍王景雷
農業工程學報 2017年22期
王鵬翔,宋 妮,陳智芳,王 峰,申孝軍,王景雷
?
基于土壤水分異質性的小麥滴灌試驗小區布設方法
王鵬翔1,2,宋 妮1,陳智芳1,王 峰1,申孝軍1,王景雷1※
(1. 中國農業科學院農田灌溉研究所/農業部作物需水與調控重點開放實驗室,新鄉 453002; 2.中國農業科學院研究生院,北京 100081)
科學合理地確定適宜的試驗小區規格,對于經濟、高效地獲取具有較高精度和代表性的試驗數據具有重要現實意義。該研究以確定滴灌條件下適宜的試驗小區規格為目標,采用冪函數建立土壤含水率方差與不同小區面積之間的相關關系,計算土壤水分異質性指數以表征試驗小區內土壤含水率的相關程度;利用土壤含水率異質性指數,采用Hatheway法確定小麥滴灌試驗小區適宜的面積和重復數;根據不同方向上土壤含水率異質性指數研究形狀對試驗結果的影響,確定試驗小區適宜的長寬比。結果表明:增大試驗小區面積可以提高試驗數據的準確性,但不同面積區間數據離散程度的降低幅度變化較大:面積由1 m2增大到50~100 m2,灌水定額30 mm處理田塊間土壤含水率方差降低77.4%~82.6%,灌水定額45 mm處理降低78.6%~83.7%,面積從100 m2增加到500 m2,方差降低幅度顯著變小,灌水定額30 mm處理降低17.4%,灌水定額45 mm處理降低16.3%;增加試驗重復數可以增加試驗對處理間土壤含水率差異的區分能力,試驗小區面積在50~100 m2時,重復數由2增加到3能檢測出的處理間土壤含水率差異由23.2%~26.5%提高到13.1%~15.0%,表明增加試驗重復數可以檢測出試驗處理間更小的土壤含水率差異,提高試驗精度。通過研究滴灌試驗小區土壤水分異質性指數與滴灌試驗小區規格之間的關系,綜合考慮試驗精度、代表性和田間實際操作得出以下結論:若試驗為高、低水2處理時,試驗布設宜為3重復,每重復小區面積為50 m2,可在80%的概率下檢測出15%的真實差異;若試驗為高、中、低3處理時,試驗布設宜為3重復,每重復小區面積為100 m2,可在80%的概率下檢測出12%的真實差異。滴灌試驗小區適宜的形狀為沿滴灌帶方向布設的長方形,長寬比在1:1到5:1之間可使試驗小區所得數據更具代表性。
土壤水分;異質性;布設;試驗小區規格;重復數;滴灌;小麥
0 引 言
節水灌溉是促進農業高產穩產,提高農業用水效率的主要措施,對于保障中國糧食安全、水安全及生態安全具有重要意義。節水灌溉規劃中需要的作物需水量、灌溉管理中作物灌水控制指標以及效益評價的水分利用效率等基礎數據需要精準地進行灌溉試驗才能確定。灌溉試驗結果受外部環境因素影響較大,為了經濟準確地獲取相關參數,除了對相關監測設施在時間和空間上進行必要的優化外,還要求選取的試驗小區規格必須具有一定的代表性,因此科學合理地確定試驗小區規格不僅直接關系到試驗誤差的控制[1],還可節省大量人力、物力和財力,提高工作效率,有利于灌溉試驗的標準化。
冬小麥是中國北方的重要糧食作物,生育期內降水較少,不能滿足其生長需要,對灌溉的依賴性較強。北方地區水資源較少,其他行業用水激增,使得農業用水資源量逐年縮減,滴灌設施以及相應技術的發展使得冬小麥滴灌成為可能。目前冬小麥滴灌試驗主要集中于灌水量、灌水時間的合理分配以及提高水分利用效率等模式的研究[2-4],其試驗小區規格多參照灌溉試驗規范執行[5]。灌溉試驗規范中僅根據作物的高矮和灌溉方法界定了一個范圍,沒有給出該范圍提出的依據,同時,在實際操作中通常是根據試驗區總面積和處理數隨機確定,這使得試驗結果的統一性較差,缺乏代表性。
目前,確定試驗小區最優面積的方法可分為最大曲率法和Hatheway法2種。最大曲率法是根據田間試驗數據的變異系數(coefficient of variation,CV)與試驗小區面積大小的關系曲線來確定試驗小區面積。當試驗小區面積增大時,CV最初下降快,之后下降速度逐漸減慢,CV與小區面積的關系曲線在曲率最大處的小區面積為試驗小區的適宜面積[6-11]。由于此方法確定的小區面積為最小面積,對應的CV隨著面積增加還有較大的下降空間。因此,又有學者提出了采用CV的相對減少值作為衡量曲線趨于平緩的標準來確定適宜面積[12]。Hatheway法是由Hatheway[13]基于Cochran等[14]的數理統計公式結合Smith[15]的關于土壤異質性經驗公式提出的通過土壤異質性指數、土壤含水率變異系數、兩處理間真實差異來確定試驗小區面積及重復數的一種方法。2種方法各有優缺點,最大曲率法簡單易行,但所考慮的影響因素比較單一。Hatheway法可以在考慮土壤異質性的條件下確定試驗的重復數和適宜小區面積,較最大曲率法考慮因素更為全面,是目前最為提倡的一種方法[16-20]。國內外學者在試驗小區適宜規格的確定中已做了大量工作,但所確定的規格大多只考慮作物及產量的影響[21],考慮滴灌等局部灌溉造成的土壤水分空間變異對試驗小區適宜規格的研究尚未見報道。
對于試驗小區形狀,小區土壤水分分布如果是各向同性的,小區形狀不會對試驗結果造成影響,但滴灌是局部灌溉,并且實際中試驗小區土壤特性也多是各向異性的[22],試驗小區的布設規則一般是在小區長邊沿著土壤特性差異大的方向布設,使得試驗小區能夠包含更多的空間變異,試驗小區所得數據更具有代表性,減少小區重復間差異[23-25]。對于小區適宜長寬比的具體布設范圍,大都是引入Smith異質性指數,由于試驗小區橫向、縱向上的土壤水分異質性指數是不同的,土壤水分變異程度大的方向土壤水分異質性指數大,因此可通過土壤水分異質性指數研究各向異性土壤相較于各向同性土壤不同規格下試驗小區對試驗結果產生的影響[26-27],確定試驗小區適宜規格。
本研究的主要目的是通過研究試驗小區土壤水分變異性、土壤水分異質性指數與試驗小區面積間的關系來確定試驗小區適宜面積、重復數以及形狀,從而確定灌溉試驗小區適宜規格。這對灌溉試驗標準化及提高試驗數據的代表性具有重要意義。
1 材料與方法
1.1 研究區概況
試驗于2016年3月—2017年5月在中國農業科學院農田灌溉研究所七里營試驗基地進行,該試驗點位于河南省新鄉市(35°19′N、113°53′E,海拔73.2 m)。多年平均氣溫14.1 ℃,無霜期210 d,日照時數2 398.8 h,光熱資源豐富,以一年兩熟耕作制度為主;多年平均降水量為582 mm,7-9月占全年降水量的70%~80%;多年平均蒸發量2 000 mm。供試土壤質地為粉壤土,地下水埋深大于5 m,試驗地為常年耕作地,由于常年進行深翻、平整,水平方向土壤質地變化較小。1 m土體內土壤性質見表1。
1.2 試驗設計
試驗設置30、45 mm共2個灌水定額處理,各處理試驗地長50 m(沿滴灌帶方向),寬10 m(圖1),每條滴灌帶間隔0.5 m,共20條滴灌帶,每米滴灌帶上3個滴孔。成熟期以前,根據計劃濕潤層(0~60 cm)的土壤含水率下限來確定灌水時間,以灌水定額45 mm處理(即田持的65%)作為灌水下限控制因素,當灌水定額45 mm處理達到田持的65%后2個處理同時灌水。試驗期間共灌水4次,灌水日期分別為3月19日、4月13日、4月26日、5月8日。參考當地傳統的施肥管理模式,在冬小麥返青期(3月19日)、拔節期(4月13日)進行追肥,每處理追施滴灌專用尿素225 kg/hm2。
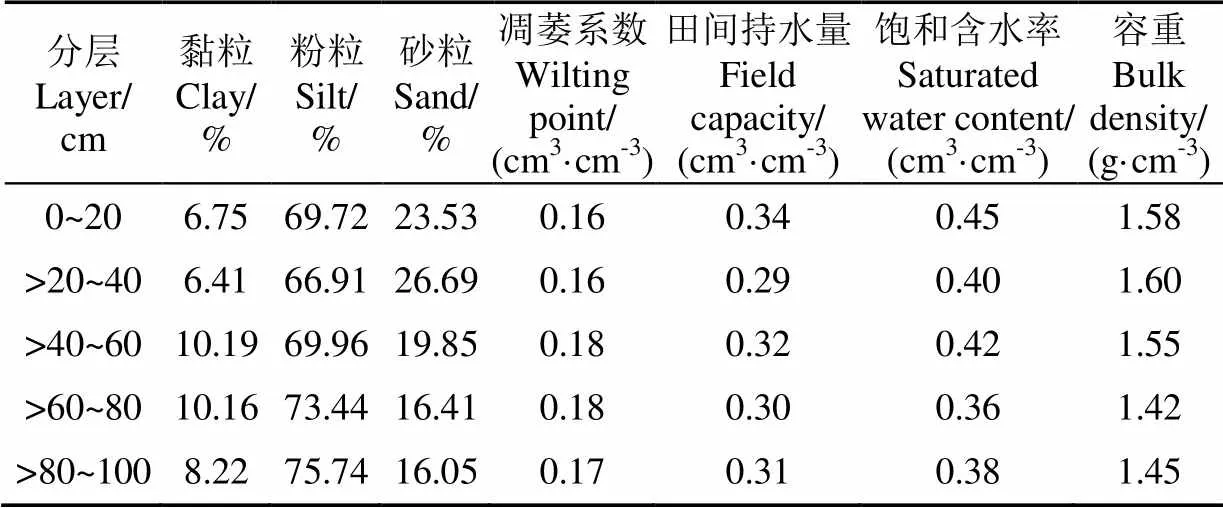
表1 試驗區土壤性質
采樣點取土位置的優化選取:為了研究土壤水分空間變化需要計算小區內每m2單元格土壤含水率,對于滴灌土壤含水率的計算,一般采用9點平均值計算,試驗地面積500 m2,如果仍采用9點法計算必將對土壤結構產生破壞,影響空間上土壤的采樣,且工作量較大實施困難。因此選用誤差分析法[28]對每條滴灌帶與試驗地對角線相交處采用9點法測量得土壤含水率(20條滴灌帶,共40個取土點)對采樣點取土位置進行優化,取土點布設如圖1所示。

圖1 采樣點及其取土位置布設
采樣點空間布設:確定過采樣點取土的優化位置后,對試驗地采用網格化均勻劃分為500個1 m2單元格(橫向隔行選取滴灌帶,縱向沿滴灌帶方向每1 m劃分,即每個單元格為2行×1 m=1 m2)每個單元格內采樣點圍繞優化選取后的取土位置(距滴灌帶12.5 cm,深20~30 cm處)進行9點取樣取土研究小區內土壤水分異質性,土壤含水率用烘干法測定。
1.3 試驗方法
1.3.1 采樣點取土位置優化分析
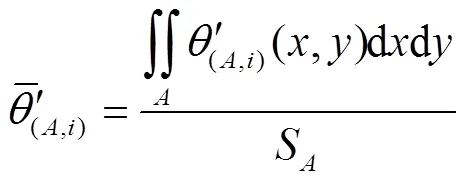
1.3.2 土壤水分異質性指數的確定
根據試驗小區面積將小區平均劃分為相同面積的單元格,即將500 m2的試驗小區按1、2、4、5、10、20、25、50、100、125、250、500 m2分別劃分為500、250、125、100、50、20、10、5、2、1個田塊。通過計算田塊土壤質量含水率方差與田塊面積之間的關系,計算試驗小區的土壤水分異質性。異質性指數由Smith[15]經驗公式得出
V=V1/S(3)
式中為小區所劃分田塊的面積;V為田塊面積為的田塊間方差;1是最小田塊(面積為1 m2的基本田塊)間的方差;土壤異質性指數,表示土壤水分之間的相關性,如果1則構成試驗小區的基本田塊完全不相關;相對地,如果=0,則小區基本田塊間完全相關且V=V1,小區面積增加不會對試驗結果造成影響。通常情況下在0和1之間,對于土壤異質性指數不為0的試驗小區,小區面積越大則所包含的數據變異越多,較大的試驗小區面積有利于提高試驗精度。1個田塊時方差為0。
1.3.3 小區面積與重復數的確定
試驗小區的適宜面積不僅與土壤水分異質性相關,還應考慮到重復數等影響因素,通過Hatheway公式[13]來估算試驗小區適宜的面積與重復數:

式中1指適宜小區大小;為土壤異質性指數,由Smith方程得出;1顯著水平所對應的值,取=0.05;2指2(1-)所對應的值,指試驗處理間真實差異能被鑒別出的概率,取=80%;CV指基本田塊(1 m2田塊)間的變異系數;指重復數;指期望通過試驗檢測出的處理間真實差異,%。
1.3.4 小區形狀的確定
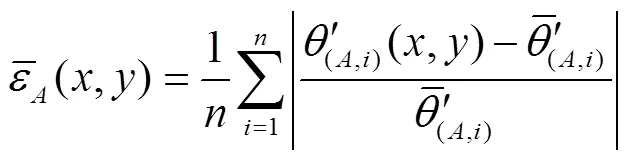
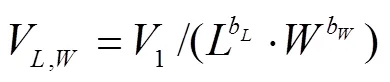
對于試驗小區形狀,不同方向上的土壤水分異質性影響試驗小區試驗結果的變異性與代表性,小區不同方向上的土壤水分異質性、試驗小區規格與試驗小區間方差的關系可由下式表示
2 結果與分析
2.1 采樣點取土位置優化分析
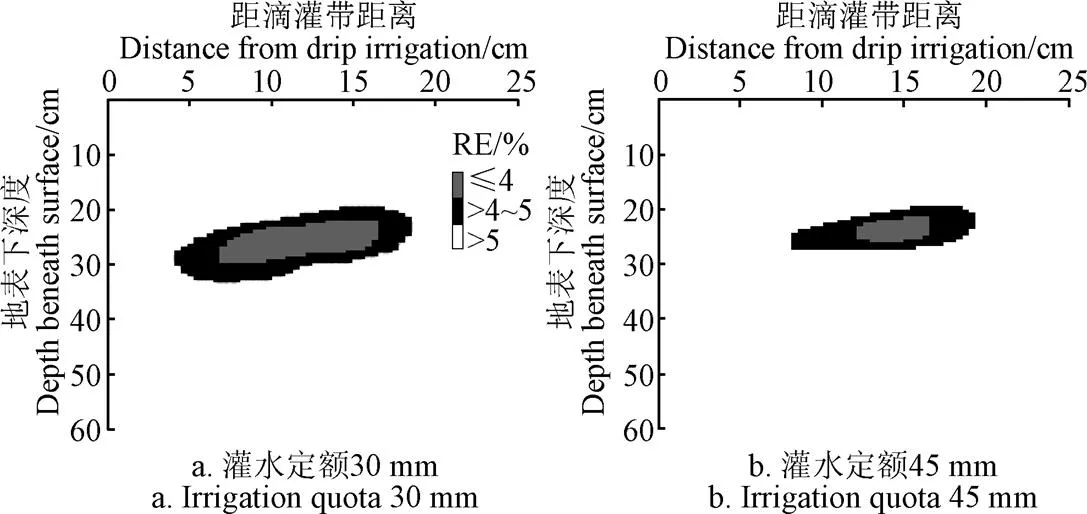
圖2 不同灌水定額土壤含水率平均相對誤差(RE)分布
由圖2可見,灌水定額為45 mm的處理誤差在5%和4%下的區域明顯小于灌水定額為30 mm處理的相同誤差區域。2個處理的最優區域(RE≤4%的區域)縱向均分布于地表以下20~30 cm處。相比灌水定額為30 mm,灌水定額為45 mm處理的最優區域橫向遠離滴灌帶,灌水定額為30 mm處理最優區域位于距滴灌帶8~15 cm處,灌水定額為45 mm處理的位于距滴灌帶12~16 cm處。由于2個灌水定額最優區域的縱向位置相近(20~30 cm),橫向位置接近,為方便田間操作,結合9點法取土分布,以距滴灌帶橫向距離為12.5 cm,地表下20~30 cm處為采樣點取土的最優位置,認為此位置土壤含水率能代表該取土點處9點法所得的平均土壤含水率。
2.2 土壤異質性指數的確定
根據相同面積下田塊土壤含水率平均數之間的方差,通過方差與田塊面積大小之間的冪函數關系,計算得到試驗小區的土壤異質性指數。結果及其變化規律如圖3所示。
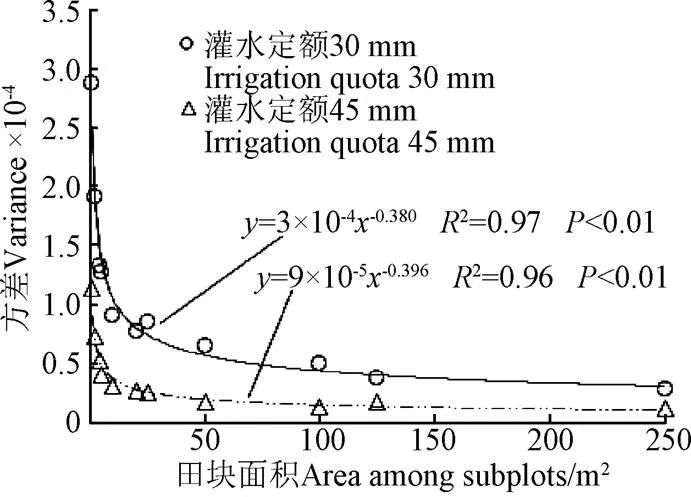
注:500 m2方差為0。
由圖3可知,灌水定額30 mm方差大于灌水定額45 mm方差,土壤水分的方差與田塊面積成反比,田塊面積增大方差減小,反之田塊面積縮小方差增大,即隨著試驗田塊面積的增加,土壤含水率數據的離散程度降低,所得試驗數據更加準確,但不同面積區間試驗方差降低的幅度有所不同,面積由1 m2增大到50~100 m2,灌水定額45 mm處理田塊間土壤含水率方差降低78.6%~83.7%,灌水定額30 mm處理降低77.4%~82.6%,之后田塊面積從100 m2增加到500 m2,灌水定額45 mm方差僅降低16.3%,灌水定額30 mm方差降低17.4%,對誤差的影響較小。即小區面積大于100 m2之后面積的增大對提高試驗數據的準確性是有限的。對方差與小區面積進行冪函數擬合,方程見圖3。由圖中方程可以得出,灌水定額30、40 mm試驗地塊的土壤異質性指數分別為0.380和0.396,表明2個水分處理的土壤水分異質性指數相差不大,基本單元間土壤水分相關性較強。
2.3 重復數及試驗小區面積的確定
處理數的不同影響處理間真實差異值,土壤質量含水率處理數增多,處理間真實差異減少。值和重復數共同影響試驗小區適宜面積,以灌水定額30 mm處理試驗數據為例(=0.380,CV=0.104),由Hatheway經驗公式得試驗在處理數為2(=2),不同重復數(=2、3、4)下值與適宜小區面積之間關系如圖4所示。由圖4可知,值越小,試驗小區面積越大,當其面積增大到一定程度后,單純依靠增加試驗小區面積來提高識別處理間差異的能力是有限的,還需要配合增加試驗重復數來增加對處理間差異的區分能力。當重復數增加時,相同面積下可以提高試驗精度,區分出處理間土壤含水率更小的真實差異,試驗小區面積在50~100 m2重復數由2增加到3能檢測出的處理間土壤含水率差異由23.2%~26.5%提高到13.1%~15.0%,重復數由3增加到4時,提高到10.3%~11.7%,不如重復數由2增大到3顯著。當試驗處理間真實差異較小時需要更大的試驗小區面積或者更多的試驗重復數。對于滴灌試驗水分處理通常分為2水平或3水平,若試驗前預期要達到的希望通過試驗能夠鑒別出統計意義上的各處理間真實差異的目標值即值為15.0%(2水平時)和12.0%(3水平時),不同處理數、重復數下適宜試驗小區面積(灌水定額30 mm:=0.380,CV=0.104;灌水定額45 mm:=0.396,CV= 0.066)計算結果如表2所示。

注:灌水定額30 mm。
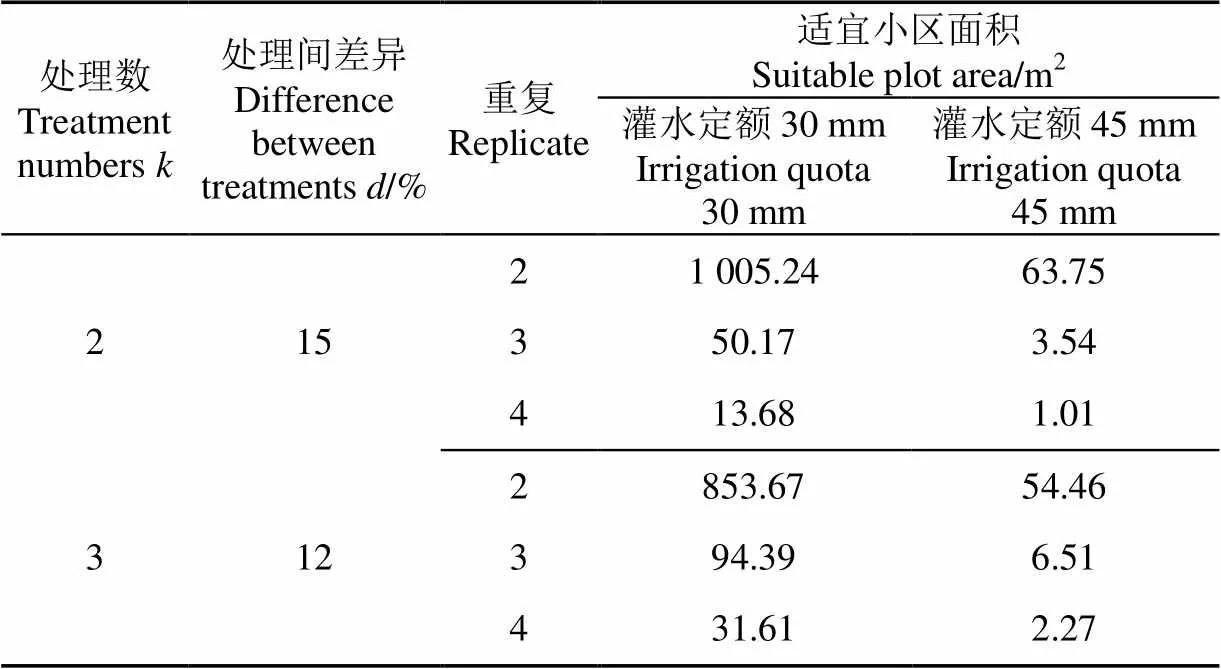
表2 不同處理數和重復數下適宜小區面積
由表2可知,對于灌水定額30 mm處理的試驗小區,2次重復要達到理想的試驗效果,由于土壤水分自身較大的變異性需要的小區面積較大。又重復為4次時所需小區面積較小,考慮到在土壤水分方差與試驗小區面積關系曲線中小區面積大于50 m2后方差降低70%以上,舍棄了面積較小的試驗布設方案,且面積太小不利于田間試驗設施的布設。綜合考慮,對于土壤含水率的監測適宜的試驗設計方案為3重復,每個重復試驗小區大小為50 m2。對于灌水定額45 mm處理,由于土壤水分變異系數較小,所需的試驗小區面積也較小,2重復即可滿足試驗精度要求,每個重復試驗小區大小為70 m2(63.75 m2取整)。當處理數增多,各處理間真實差異減少,應選取較大的試驗小區面積或較多的重復數。小區布設時,對于低水處理可以選擇3重復,每個重復100 m2(94.34 m2取整),或4重復,每個重復40 m2(31.61 m2取整),但是考慮到在土壤水分方差與試驗小區面積關系曲線中小區面積大于50 m2后方差降低70%以上,因此選擇3重復,每個重復100 m2。對于高水則可選擇2重復,每個重復60 m2(54.64 m2取整)。
2.4 適宜小區形狀的確定


圖5 不同灌水處理下方差與試驗小區面積間關系
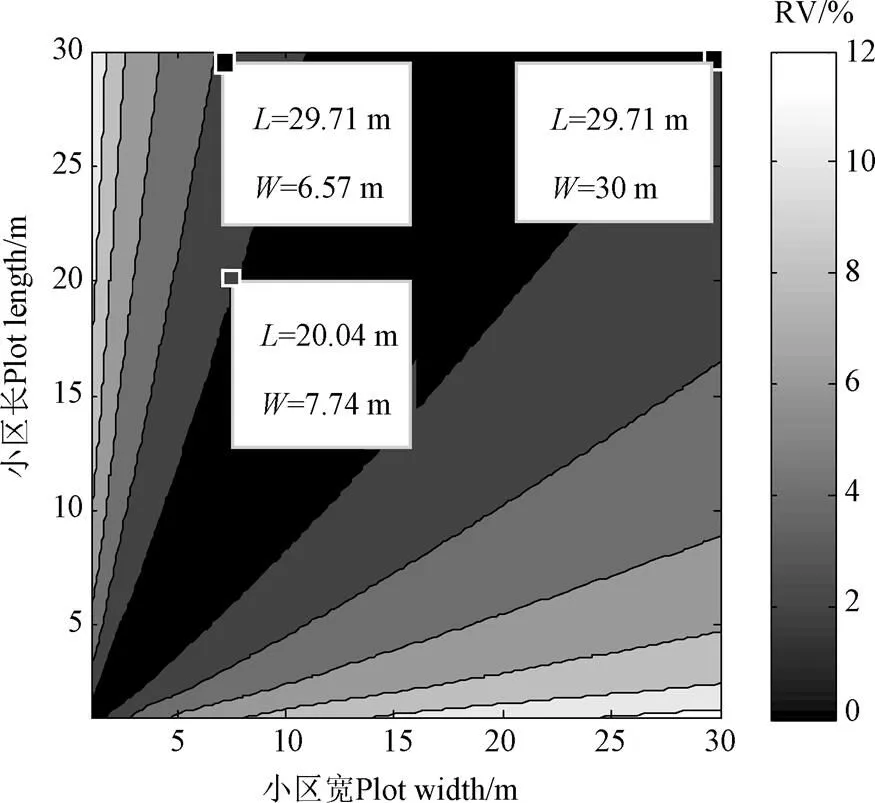
圖6 不同小區形狀下方差相對偏差RV的絕對值
由圖6可知當試驗小區、的比值過大或過小時試驗數據偏差均較大,因為b>b,所以方向(沿滴灌帶鋪設方向)上的異質性指數大于方向(垂直于滴灌帶方向)上的異質性指數,所以沿土壤異質性指數較的大的方向布設的試驗小區較其他形狀的試驗小區有更準確的結果(偏差更小)。當、比值在1∶1到3∶1之間時,偏差值較小,在0~2%之間,比值在1∶1到5∶1之間時,偏差值在0~4%之間,即在此比例下形狀對試驗數據的準確性影響較小,因為在此比例下,試驗小區能夠根據試驗小區不同方向上的變異程度均衡地包含地塊、方向上的土壤水分特性的變異,使試驗小區更具有代表性。
3 討 論
同產量數據一樣,滴灌土壤含水率數據方差與小區面積大小之間同樣存在冪函數關系,求得的值可以用來表征土壤含水率間的連續性,且通過土壤水分求得的值小于通過產量求得的值[16,27],這是因為滴灌土壤含水率數據相較于產量在空間分布上更為連續,隨著田塊面積的增大,田塊間土壤含水率方差減小,即隨著試驗小區面積的增加,土壤含水率數據的離散程度降低,所得試驗數據更加準確。對于試驗重復數,相同小區面積下增大重復數可提高試驗精度,區分出處理間土壤含水率更小的差異。增大試驗小區面積和試驗重復數均能提高試驗數據的準確性,增加試驗對處理間差異的區分能力。這與基于產量的研究是一致的[6-8],滴灌試驗處理數不同,水分處理不同時所需的重復數和試驗小區面積不同,處理數增多,各處理間真實差異減少,需要更大的試驗小區或更多的重復數來檢測出更小的試驗差異。高水處理與低水處理土壤水分異質性指數相差不大,但是低水處理土壤水分變異系數大,所以需要的小區面積較大或重復數較多。
對于小區形狀,試驗小區土壤水分分布是各向異性的,所以沿變異較大的方向布設的長方形試驗小區能包含更多的變異,使試驗小區更具代表性,重復間差異更小,此外為了讓試驗小區內數據更為穩定偏差更小,又要求試驗小區在適宜的長寬比下所包含數據變異系數較小[29-30],對于滴灌試驗沿滴灌帶鋪設方向土壤水分變異性大于垂直于滴灌帶方向土壤水分變異性,由表征兩方向上土壤水分變異性的異質性指數確定的試驗小區形狀能夠均衡的包含兩方向上的變異性使得試驗小區土壤含水率數據更加準確。。
4 結 論
研究結果表明,不同規格的試驗小區對滴灌試驗結果的準確性有很大影響,通過研究滴灌試驗小區土壤水分變異性、土壤水分異質性指數與滴灌試驗小區規格之間的關系得出以下結論:
為了試驗小區的統一布設,以低水處理的規格為統一標準,當試驗分為高低水2個處理時試驗布設宜為3個重復,各重復50 m2,可在80%的概率下檢測出15%的真實差異;當試驗為高中低3個處理時試驗布設宜為3個重復,各重復100 m2,可在80%的概率下檢測出12%的真實差異。
滴灌試驗小區適宜的形狀為沿滴灌帶方向布設的長方形,長寬比在1∶1到5∶1之間可使試驗小區所得數據更具代表性。
[1] 孔繁玲. 田間試驗與統計方法[M]. 北京:中央廣播電視大學出版社,1991.
[2] 王建東,龔時宏,高占義,等. 滴灌模式對農田土壤水氮空間分布及冬小麥產量的影響[J]. 農業工程學報,2009,25(11):68-73.
Wang Jiandong, Gong Shihong, Gao Zhanyi, et al. Effects of drip irrigation mode on spatial distribution of soil water and nitrogen and winter wheat yield[J]. Transactions of the Chinese Society of Agricultural Engineering (Transactions of the CSAE), 2009, 25(11): 68-73. (in Chinese with English abstract)
[3] 謝小清,章建新,段麗娜,等. 滴灌量對冬小麥根系時空分布及水分利用效率的影響[J]. 麥類作物學報,2015,35(7):971-979.
Xie Xiaoqing, Zhang Jianxin, Duan Lina, et al. Effect of drip irrigation amount on temporal spatial distribution of root and water use efficiency of winter wheat[J]. Journal of Triticeae Crops, 2015, 35(7): 971-979. (in Chinese with English abstract)
[4] 張娜,張永強,仵妮平,等. 滴灌量對冬小麥籽粒灌漿特性的影響研究[J]. 水土保持研究,2015,22(5):271-275.
Zhang Na, Zhang Yongqiang, Wu Niping, et al. Study on grain filling characteristic of winter wheat under different amounts of drip irrigation[J]. Research of Soil Water Conservation, 2015, 22(5): 271-275. (in Chinese with English abstract)
[5] 中華人民共和國水利部. 灌溉試驗規范:SL13-2015[S]. 北京:中國水利水電出版社,2015.
[6] Viana Anselmo Eloy S, Sediyama Tocio, Cecon Paulo Roberto, et al. Estimativas de tamanho de parcela em experimentos com mandioca estimates of plot sizes in experiments with cassava[J]. Horticultura Brasileira, 2002, 20(1): 58-63.
[7] Feijó, Sandra Storck, Lindolfo Lúcio, et al. Heterogeneity index of zucchini yield on a protected environment and experimental planning[J]. Horticultura Brasileira, 2008, 26(1): 1314-1377.
[8] José Lopes Sidinei. Plot size and experimental unit relationship in exploratory experiments[J]. Scientia Agricola, 2005, 62(6): 585-589.
[9] Lúcio Alessandro D, Haesbaert Fernando M, Santos Daniel, et al. Tamanhos de amostra e de parcela para variáveis de crescimento e produtivas de tomateiro Sample size and plot size for growth and productivity characteristics of tomato[J]. Horticultura Brasileira, 2012, 30(4): 660-668.
[10] 唐龍,郝文芳,孫洪罡,等. 黃土高原四種鄉土牧草群落種-面積曲線擬合及最小面積的確定[J]. 干旱地區農業研究,2005,23(4):83-88.
Tang Long, Hao Wenfang, Sun Honggang, et al. Fitting and assessment of species-area curves of four native pasture communities on Loess Plateau[J]. Agricultural Research in the Arid Areas, 2005, 23(4): 83-88. (in Chinese with English abstract)
[11] Mello R M, Lucio A D, Storck L, et al. Size and form of plots for the culture of the Italian pumpkin in plastic greenhouse[J]. Scientia Agricola, 2004, 61(4): 457-461.
[12] 李永寧,馬凱,黃選瑞. 金蓮花產量抽樣調查的樣地最小面積與形狀研究[J]. 草業學報,2011,20(4):61-69.
Li Yongning, Ma Kai, Huang Xuanrui. A study on the plot minimum area and shape for sampling Trollius chinensis yield[J]. Acta Prataculturae Sinica, 2011, 20(4): 61-69. (in Chinese with English abstract)
[13] Hatheway W H. Convenient plot size[J]. Agronomy Journal, 1961(4): 279-280.
[14] Cochran G, Cox Gertrude M. Experimental designs: 2nd ed[J]. Soil Science, 1957, 84(5): 164.
[15] Smith H Fairfield. An empirical law describing heterogeneity in the yields of agricultural crops[J]. Journal of Agricultural Science, 1938, 28(1): 1-23.
[16] Martin Thomas Newton, Storck Lindolfo, Lúcio Alessandro Dal’Col, et al. Bases genéticas de milho e altera??es no plano experimental maize genetic variability and modifications on the experimental plan[J]. Pesquisa Agropecuária Brasileira, 2005, 40(1): 35-40.
[17] Lorentz L H, Boligon A A, Storck L, et al. Plot size and experimental precision for sunflower production[J]. Scientia Agricola, 2010, 67(4): 408-413.
[18] Vallejo R L, Mendoza H A Plot technique studies on sweetpotato yield trials[J]. Journal of the American Society for Horticulturalence, 1992, 117(3): 508-511.
[19] Neto Henriques, Diolino Sediyama, TocioSouza, et al. Tamanho de parcelas em experimentos com trigo irrigado sob plantio direto e convencional[J]. Pesquisa Agropecuária Brasileira, 2004, 39(6): 517-524.
[20] 季蘭,駱建霞,苗保蘭,等. 蘋果田間試驗最適小區大小的初步研究[J]. 山西農業大學學報:自然科學版,1993,13(3):263-266.
Ji Lan, Luo Jianxia, Miao Baolan, et al. Study on estimating the optimum plot size of applefield experiment[J]. Journal of Shanxi Agricultural University: Natural Science Edition, 1993, 13(3): 263-266. (in Chinese with English abstract)
[21] Boyhan G E, Langston D B, Purvis A C, et al. Optimum plot size and number of replications with short-day onions for yield, seedstem formation, number of doubles, and incidence of foliar diseases[J]. Journal of the American Society for Horticultural Science American Society for Horticultural Science, 2003, 128(3): 409-424.
[22] 雷志棟. 土壤水動力學[M]. 北京:清華大學出版社,1988.
[23] Sangeda A Z, Malende Y H M B, Nzunda E F, et al. Determination of suitable plot shape and plot size for estimation of off-forest tree resources in Machame, Moshi-Tanzania[J]. Acta Facultatis Forestalis, 2002, XLIII(20): 287-294.
[24] Donou Hounsode Marcel T, Kaka? Romain Glélé, Azihou Akomian Fortuné, et al. Efficiency of inventory plot patterns for the estimation of woody vegetation recruit density in a tropical dense forest in Bénin[J]. African Journal of Ecology, 2015, 53(3): 355-361.
[25] Polson David Ernest. Estimation of Optimum Size, Shape,and Replicate number of Safflower Plots for Yield Trials[D]. Utah:Utah State University, 1964.
[26] Meier V D, Lessman K J. Estimation of optimum field plot shape and size for testing yield in crambe abyssinica hochst1[J]. Cropence, 1971, 11(5): 648-650.
[27] Zhang R, Warrick A W, Myers D E. Heterogeneity, plot shape effect and optimum plot size[J]. Geoderma, 1994, 62(1/2/3): 183-197.
[28] 王峰,孫景生,劉祖貴,等. 膜下滴灌棉田測墑點布設位置試驗研究[J]. 灌溉排水學報,2016,35(2):29-34.
Wang Feng, Sun Jingsheng, Liu Zugui, et al. Sensor placement of soil water monitoring in cotton filed using drip irrigation under plastic film mulch[J]. Journal of Irrigation and Drainage, 2016, 35(2): 29-34. (in Chinese with English abstract)
[29] Masood M A, Raza Irum, Yaseen Muhammad. Estimation of optimum field plot size and shape in paddy yield trial[J]. Pakistan Journal of Agricultural Research, 2012, 25(4): 280-287.
[30] Oliveira Gabriel Marcos Vieira, Mello José Márcio De, Lima Renato Ribeiro De, et al. Size and shape of experimental plots for Eremanthus erythropappus[J]. Cerne, 2011, 17(3): 327-338.
王鵬翔,宋 妮,陳智芳,王 峰,申孝軍,王景雷. 基于土壤水分異質性的小麥滴灌試驗小區布設方法[J]. 農業工程學報,2017,33(22):112-118. doi:10.11975/j.issn.1002-6819.2017.22.014 http://www.tcsae.org
Wang Pengxiang, Song Ni, Chen Zhifang, Wang Feng, Shen Xiaojun, Wang Jinglei. Plot layout method of wheat drip irrigation experiment based on soil water heterogeneity[J]. Transactions of the Chinese Society of Agricultural Engineering (Transactions of the CSAE), 2017, 33(22): 112-118. (in Chinese with English abstract) doi:10.11975/j.issn.1002-6819.2017.22.014 http://www.tcsae.org
Plot layout method of wheat drip irrigation experiment based on soil water heterogeneity
Wang Pengxiang1,2, Song Ni1, Chen Zhifang1, Wang Feng1, Shen Xiaojun1, Wang Jinglei1※
(1.453002;2100081)
The objective of this research was to improve the accuracy and representativeness of the experimental plot date by determining the optimum plot area and the replication number for the wheat drip irrigation. The heterogeneity of soil moisture in experimental plots was provided by Smith heterogeneity index. The relationship between the plot area and the repetition number of the wheat drip experimental plot was measured by Hatheway method. The effect of shape on the accuracy of experimental data was determined by studying the soil moisture heterogeneity index in the horizontal direction of drip tape and the vertical direction of drip tape in experimental plot. The results showed,when the plot area was increased, the variance of soil water in the field was reduced and the relationship between them was in power function . For the plot form 1 m2to 50-100 m2, the variance decreased significantly. The full irrigation treatment variance was decreased by 0.79-0.84, and the deficit irrigation treatment variance was reduced by 0.79-0.84. For the plot more than 100m2, the increase of plot area had a limited effect on the variance reduction. To determine the optimum size of the experimental plot you need take the factors as below into consideration, as the number of treatments increased, the real difference between treatments decreased, and the required size for the experimental increased. When the size of the plot increased to a certain value, improving the identification ability of test difference by increasing the area of experimental plot was limited and adding the repetition number to improve the distinguishing ability of the difference between treatments was necessary. For 50-100 m2of experimental plots, when the repetition was increased, the experimental accuracy could be improved with the same area to distinguish the smaller real difference between treatments. By increasing the number of repeats from 2 to 3, the differences of soil moisture between the treatments could be detected which increased from 23.2%-26.5% to 13.1%-15.0%. The recognition ability of the real difference among the treatments could be significantly improved. Hatheway method was used to calculate the optimal experimental plot of the full and deficit irrigation treatment. Due to its larger coefficient variation of soil moisture and heterogeneity index, the deficit irrigation treatment required larger testing area. In order to facilitate the layout of the field experiment, the unified standard of the plot was set up with the optimum specification of deficit irrigation treatment. When the experiment was divided into full and deficit irrigation treatment, the testing plot should be 3 replicates, and the size of each repeat plot should be 50 m2.When the irrigation experiment was divided into three treatments, the experiment layout should be 3 replicates, and the size of each replicate plot was 100 m2. For the experimental plot shape, according to the relationship between the variance of field block and the size of experimental plot, the Power function was fitted by whether the length is greater than the width to calculate the soil moisture heterogeneity index in horizontal the direction of drip tape and the vertical direction of drip tape. About the difference between two directions, the heterogeneity index of deficit irrigation treatment was greater than that of full irrigation treatment. The heterogeneity index in the horizontal direction of drip tape was greater than that in the vertical direction of drop tape. Therefore, the result of rectangular area arranged along the direction of the drip tape was more accurate (smaller deviation) than other shapes. The rectangular experimental plot with aspect ratio between 1:1 and 5:1 could balance the variability of both directions and made the experimental plot more representative. This paper provided a scientific basis for determining the specifications of drip irrigation experimental plot and the theoretical support for the standardization of irrigation experimental layout.
soil moisture; heterogeneity; layout; optimum plot area and shapes; number of replications; drip irrigation; wheat
10.11975/j.issn.1002-6819.2017.22.014
S3-33; S275.6
A
1002-6819(2017)-22-0112-07
2017-07-07
2017-10-10
水利部公益性行業科研專項(201501016);國家重點研發計劃(2016YFC0400208);國家自然科學基金項目(51609245);河南省基礎與前沿技術研究(16230010168);中央級科研院所基本科研業務費專項(FIRI2017-07)
王鵬翔,河南安陽人,主要從事作物水分生理與高效利用。 Email:798695991@qq.com
王景雷,河南開封人,研究員,主要從事新理論新技術在節水農業中的應用研究。Email:firiwjl@126.com
中國農業工程學會會員:王景雷(E041200185S)
