Kappa coefficient: a popular measure of rater agreement
2015-12-09 03:02:23WanTANGJunHUHuiZHANGPanWUHuaHE
上海精神醫(yī)學(xué) 2015年1期
Wan TANG*, Jun HU, Hui ZHANG, Pan WU, Hua HE,5
?Biostatistics in psychiatry (25)?
Kappa coefficient: a popular measure of rater agreement
Wan TANG1*, Jun HU2, Hui ZHANG3, Pan WU4, Hua HE1,5
interrater agreement; kappa coefficient; weighted kappa; correlation
1. Introduction
For most physical illnesses such as high blood pressure and tuberculosis, definitive diagnoses can be made using medical devices such as a sphygmomanometer for blood pressure or an X-ray for tuberculosis. However,there are no error-free gold standard physical indicators of mental disorders, so the diagnosis and severity of mental disorders typically depends on the use of instruments (questionnaires) that attempt to measure latent multi-faceted constructs. For example, psychiatric diagnoses are often based on criteria specified in the Fourth edition of theDiagnostic and Statistical Manual of Mental Disorders(DSM-IV)[1], published by the American Psychiatric Association. But different clinicians may have different opinions about the presence or absence of the speci fic symptoms required to determine the presence of a diagnosis, so there is typically no perfect agreement between evaluators. In this situation,statistical methods are needed to address variability in clinicians’ ratings.
Cohen’s kappa is a widely used index for assessing agreement between raters.[2]Although similar in appearance, agreement is a fundamentally different concept from correlation. To illustrate, consider an instrument with six items and suppose that two raters’ratings of the six items on a single subject are (3,5), (4,6),(5,7), (6,8), (7,9) and (8,10). Although the scores of the two raters are quite different, the Pearson correlation coefficient for the two scores is 1, indicating perfect correlation. The paradox occurs because there is a bias in the scoring that results in a consistent difference of 2 points in the scores of the two raters for all 6 items in the instrument. Thus, although perfectly correlated(precision), there is quite poor agreement between the two raters. The kappa index, the most popular measure of raters’ agreement, resolves this problem by assessing both the bias and the precision between raters’ ratings.
In addition to its applications to psychiatric diagnosis, the concept of agreement is also widely applied to assess the utility of diagnostic and screening tests. Diagnostic tests provide information about a patient’s condition that clinicians’ often use when making decisions about the management of patients.Early detection of disease or of important changes in the clinical status of patients often leads to less suffering and quicker recovery, but false negative and false positive screening results can result in delayed treatment or in inappropriate treatment. Thus when a new diagnostic or screening test is developed, it is critical to assess its accuracy by comparing test results with those from a gold or reference standard. When assessing such tests,it is incorrect to measure the correlation of the results of the test and the gold standard, the correct procedure is to assess the agreement of the test results with the gold standard.
2. Problems
Consider an instrument with a binary outcome, with‘1’ representing the presence of depression and ‘0’representing the absence of depression. Suppose two independent raters apply the instrument to a random sample ofnsubjects. Let and denote the ratings on thensubjects by the two raters fori=1,2,...,n. We are interested in the degree of agreement between the two raters. Since the ratings are on the same scale of two levels for both raters, the data can be summarized in a 2×2 contingency table.
To illustrate, Table 1 shows the results of a study assessing the prevalence of depression among 200 patients treated in a primary care setting using two methods to determine the presence of depression;[3]one based on information provided by the individual(i.e., proband) and the other based on information provided by another informant (e.g., the subject’s family member or close friend) about the proband. Intuitively,we may think that the proportion of cases in which the two ratings are the same (in this example, 34.5%[(19+50)/200]) would be a reasonable measure of agreement. But the problem with this proportion is that it is almost always positive, even when the rating by the two methods is completely random and independent of each other. So the proportion of overall agreement does not indicate whether or not two raters or two methods of rating are in agreement.

Table 1. Diagnosis of depression among 200 primary care patients based on information provided by the proband and by other informants about the proband
For example, suppose that two raters with no training or experience about depression randomly decide whether or not each of the 200 patients has depression. Assume that one rater makes a positive diagnosis (i.e., considers depression present) 80% of thetime and the other gives a positive diagnosis 90% of thetime. Based on the assumption that their diagnoses are made independently from each other, Table 2 represents the joint distribution of their ratings. The proportion that the two raters give the same diagnosis is 74% (i.e.,0.72+0.02), suggesting that the two raters are doing a good job of diagnosing the presence of depression. But this level of agreement is purely by chance, it doesnotreflect the actual degree of agreement between the two raters. This hypothetical example shows that the proportion of cases in which two raters give the same ratings on an instrument is inflated by the agreement by chance. This chance agreement must be removed in order to provide a valid measure of agreement.Cohen’s kappa coefficient is used to assess the level of agreement beyond chance agreement.
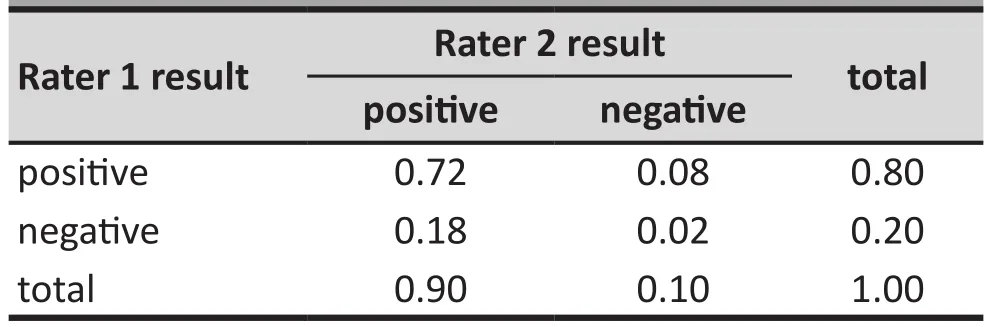
Table 2. Hypothetical example of proportional distribution of diagnoses by two raters that make diagnoses independently from each other
3. Kappa for 2×2 tables
Consider a hypothetical example of two raters giving ratings fornsubjects on a binary scale, with ‘1’representing a positive result (e.g., the presence of a diagnosis) and ‘0’ representing a negative result(e.g., the absence of a diagnosis). The results could be reported in a 2x2 contingency table as shown in Table 3. By convention, the results of the first rater are traditionally shown in the rows (x values) and the results of the second rater are shown in the columns(y values). Thus,nijin the table denotes the number of subjects who receive the rating ofifrom the first rater and the ratingjfrom the second rater. Let Pr(A) denote the probability of event A; thenpij=Pr(x=i,y=j) represent the proportion of all cases that receive the rating ofifrom the first rater and the ratingjfrom the second rater,pi+=Pr(x=i) represents the marginal distribution of the first rater’s ratings, andp+j=Pr(y=j) represents the marginal distribution of the second rater’s ratings.
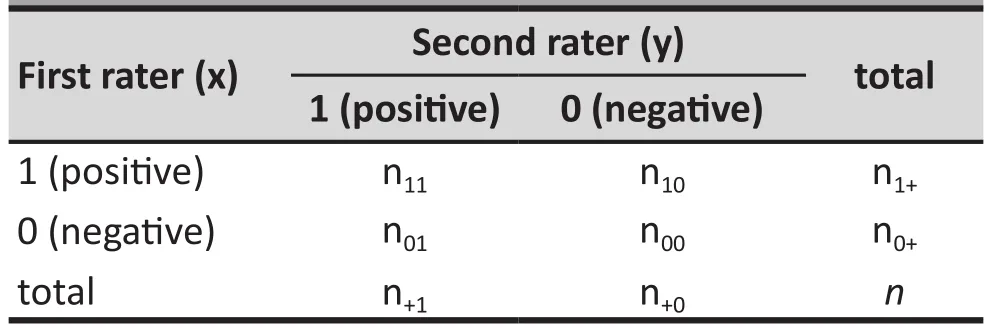
Table 3. A typical 2×2 contingency table to assess agreement of two raters
If the two raters give their ratings independently according to their marginal distributions, the probability that a subject is rated 0 (negative) by chance by both raters is the product of the marginal probabilitiesp0+andp+0. Likewise, the probability of a subject being rated 1 (positive) by chance by both raters is the product of the marginal probabilitiesp1+andp+1. The sum of these two probabilities (p1+*p+1+p0+*p+0) is the agreement by chance, that is, the source of in flation discussed earlier.After excluding this source of inflation from the total proportion of cases in which the two raters give identical ratings (p11+p00), we arrive at the agreement corrected for chance agreement, (p11+p00- (p1+*p+1+p0+*p+0)). In 1960 Cohen[1]recommended normalizing this chanceadjusted agreement as the Kappa coefficient (K):
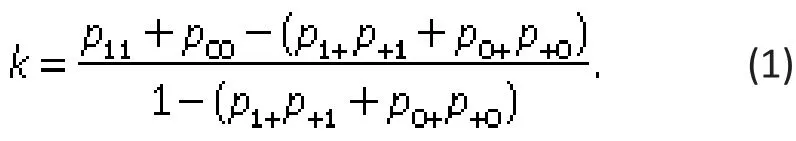
This normalization process produces kappa coefficients that vary between -1 and 1, depending on the degree of agreement or disagreement beyond chance. If the two raters completely agree with each other, thenp11+p00=1 andK=1. Conversely, if the kappa coefficient is 1, then the two raters agree completely. On the other hand, if the raters rate the subjects in a completely random fashion, then the agreement is completely due to chance, sop11=p1+*p+1andp00=p0+*p+0do (p11+p00-(p1+*p+1+p0+*p+0))=0 and the kappa coefficient is also 0. In general, when rater agreement exceeds chance agreement the kappa coefficient is positive, and when raters disagree more than they agree the kappa coefficient is negative. The magnitude of kappa indicates the degree of agreement or disagreement.
The kappa coefficient can be estimated by substituting sample proportions for the probabilities shown in equation (1). When the number of ratings given by each rater (i.e., the sample size) is large, the kappa coefficient approximately follows a normal distribution. This asymptotic distribution can be estimated using delta methods based on the asymptotic distributions of the various sample proportions.[4]Based on the asymptotic distribution, calculations of confidence intervals and hypothesis tests can be performed. For a sample with 100 or more ratings, this generally provides a good approximation. However, it may not work well for small sample sizes, in which case exact methods may be applied to provide more accurate inference.[4]
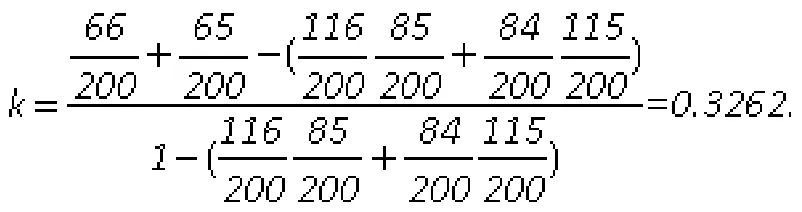
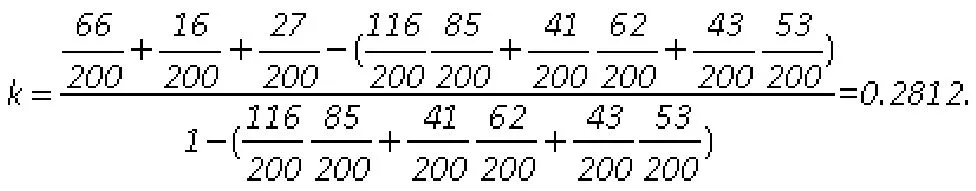
Example 1.Assessing the agreement between the diagnosis of depression based on information provided by the proband compared to the diagnosis based on information provided by other informants (Table 1), the Kappa coefficient is computed as follows:
The asymptotic standard error of kappa is estimated as 0.063. This gives a 95% confidence interval of κ, (0.2026, 0.4497). The positive kappa indicates some degree of agreement about the diagnosis of depression between diagnoses based on information provided by the proband versus diagnoses based on information provided by other informants. However, the level of agreement,though statistically signi ficant, is relatively weak.
In most applications, there is usually more interest in the magnitude of kappa than in the statistical significance of kappa. When the sample is relatively large (as in this example), a low kappa which represents relatively weak agreement can, nevertheless, be statistically significant (that is, significantly greater than 0). The degree of beyond-chance agreement has been classified in different ways by different authors who arbitrarily assigned each category to specific cutoff levels of Kappa. For example, Landis and Koch[5]proposed that a kappa in the range of 0.21-0.40 be considered ‘fair’ agreement, kappa=0.41-0.60 be considered ‘moderate’ agreement, kappa=0.61-0.80 be considered ‘substantial’ agreement, and kappa >0.81 be considered ‘a(chǎn)lmost perfect’ agreement.
4. Kappa for categorical variables with multiple levels
The kappa coefficient for a binary rating scale can be generalized to cases in which there are more than two levels in the rating scale. Suppose there areknominal categories in the rating scale. For simplicity and without loss of generality, denote the rating levels by 1,2,...,k.The ratings from the two raters can be summarized in ak×kcontingency table, as shown in Table 4. In the table,nij,pij,pi+, andp+jhave the same interpretations as in the 2x2 contingency table (above) but the range of the scale is extended toi,j=1,…,k. As in the binary example,we first compute the agreement by chance, (the sum of the products of thekmarginal probabilities, ∑pi+*p+ifori=1,…,k), and subtract this chance agreement from the total observed agreement (the sum of the diagonal probabilities, ∑piifori=1,...,k) before estimating the normalized agreement beyond chance:
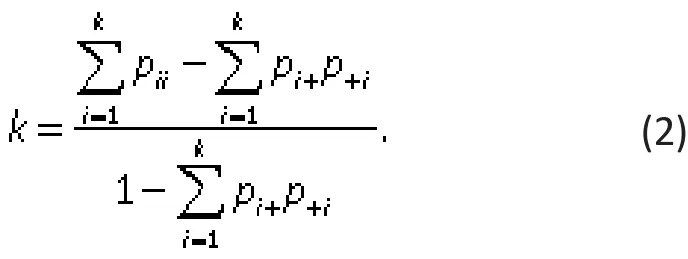
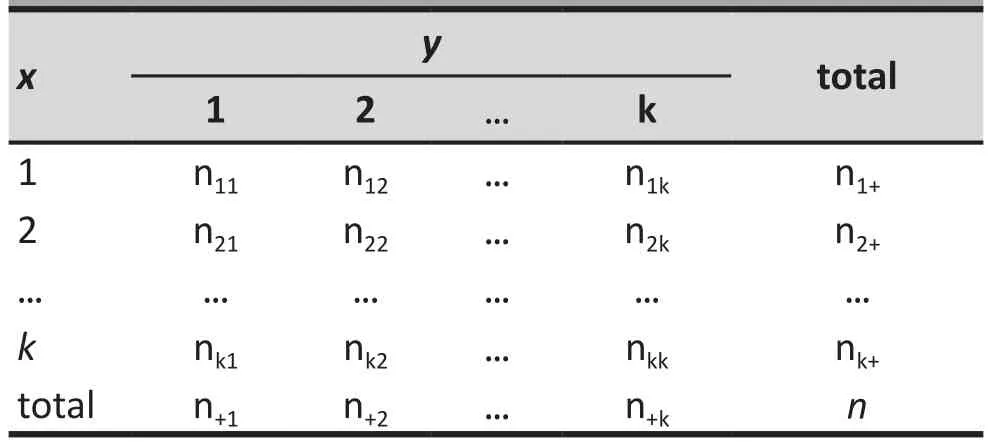
Table 4. Model KxK contingency table to assess agreement about k categories by two different raters
As in the case of binary scales, the kappa coefficient varies between -1 and 1, depending on the extent of agreement or disagreement. If the two raters completely agree with each other (∑pii=1, fori=1,…,k), then the kappa coefficient is equal to 1. If the raters rate the subjects at random, then the total agreement is equal chance agreement (∑pii=∑pi+*p+i, fori=1,…,k) so the kappa coefficient is 0. In general, the kappa coefficient is positive if there is agreement or negative if there is disagreement, with the magnitude of kappa indicating the degree of such agreement or disagreement between the raters. The kappa index in equation (2) is estimated by replacing the probabilities with their corresponding sample proportions. As in the case of binary scales, we can use asymptotic theory and exact methods to assess con fidence intervals and make inferences.
5. Kappa for ordinal or ranked variables
The definition of the kappa coefficient in equation(2) assumes that the rating categories are treated as independent categories. If, however, the rated categories are ordered or ranked (for example, a Likert scale with categories such as ‘strongly disagree’,‘disagree’, ‘neutral’, ‘a(chǎn)gree’,and ‘strongly agree’), then a weighted kappa coefficient is computed that takes into consideration the different levels of disagreement between categories. For example, if one rater ‘strongly disagrees’ and another ‘strongly agrees’ this must be considered a greater level of disagreement than when one rater ‘a(chǎn)grees’ and another ‘strongly agrees’.
The first step in computing a weighted kappa is to assign weights representing the different levels of agreement for each cell in the KxK contingency table.The weights in the diagonal cells are all 1 (i.e.,wii=1,for alli), and the weights in the off-diagonal cells range from 0 to <1 (i.e., 0<wij<1, for alli≠j). These weights are then added to equation (2) to generate a weighted kappa that accounts for varying degrees of agreement or disagreement between the ranked categories:
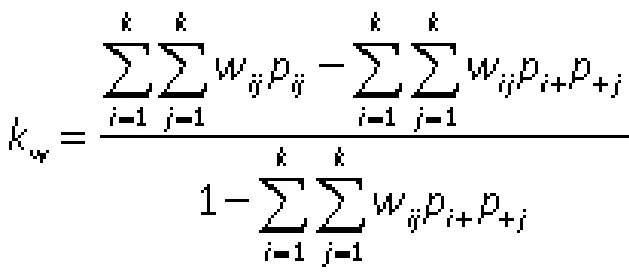
The weighted kappa is computed by replacing the probabilities with their respective sample proportions,pij,pi+, andp+i. Ifwij=0 for alli≠j, the weighted kappa coefficient Kwreduces to the standard kappa in equation (2). Note that for binary rating scales, there is no weighted version of kappa, since κ remains the same regardless of the weights used. Again, we can use asymptotic theory and exact methods to estimate con fidence intervals and make inferences.
In theory, any weights satisfying the two defining conditions (i.e., weights in diagonal cells=1 and weights in off-diagonal cells >0 and <1) may be used.In practice, however, additional constraints are often imposed to make the weights more interpretable and meaningful. For example, since the degree of disagreement (agreement) is often a function of the difference between theith andjth rating categories,weights are typically set to reflect adjacency between rating categories, such as bywij=f(i-j), wherefis some decreasing function satisfying three conditions: (a)0<f(x)<1; (b)f(x)=f(-x); and (c)f(0)=1. Based on these conditions, larger weights (i.e., closer to 1) are used for weights of pairs of categories that are closer to each other and smaller weights (i.e., closer to 0) are used for weights of pairs of categories that are more distant from each other.
Two such weighting systems based on column scores are commonly employed. Suppose the column scores are ordered, sayC1≤C2…≤Crand assigned values of 0,1,…r. Then, the Cicchetti-Allison weight and the Fleiss-Cohen weight in each cell of the KxK contingency table are computed as follows:

Example 2. If depression is categorized into three ranked levels as shown in Table 5, the agreement of the classi fication based on information provided by the probands with the classification based on information provided by other informants can be estimated using the unweighted kappa coefficient as follows:
Applying the Cicchetti-Allison weights (shown in Table 5) to the unweighted formula generates a weighed kappa:
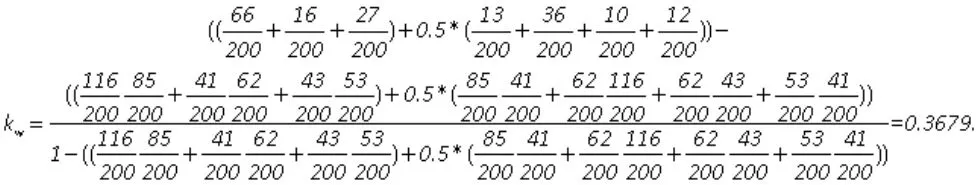
Applying the Fleiss-Cohen weights (shown in Table 5) involves replacing the 0.5 weight in the above equation with 0.75 and results in a Kw of 0.4482.Thus the weighted kappa coefficients have larger absolute values than the unweighted kappa coefficients. The overall result indicates only fair to moderate agreement between the two methods of classifying the level of depression. As seen in Table 5, the low agreement is partly due to the fact that a large number of subjects classified as minor depression based on information from the proband were not identified using information from other informants.
6. Statistical Software
Several statistical software packages including SAS,SPSS, and STATA can compute kappa coefficients. But agreement data conceptually result in square tables with entries in all cells, so most software packages will not compute kappa if the agreement table is nonsquare, which can occur if one or both raters do not use all the rating categories when rating subjects because of biases or small samples.
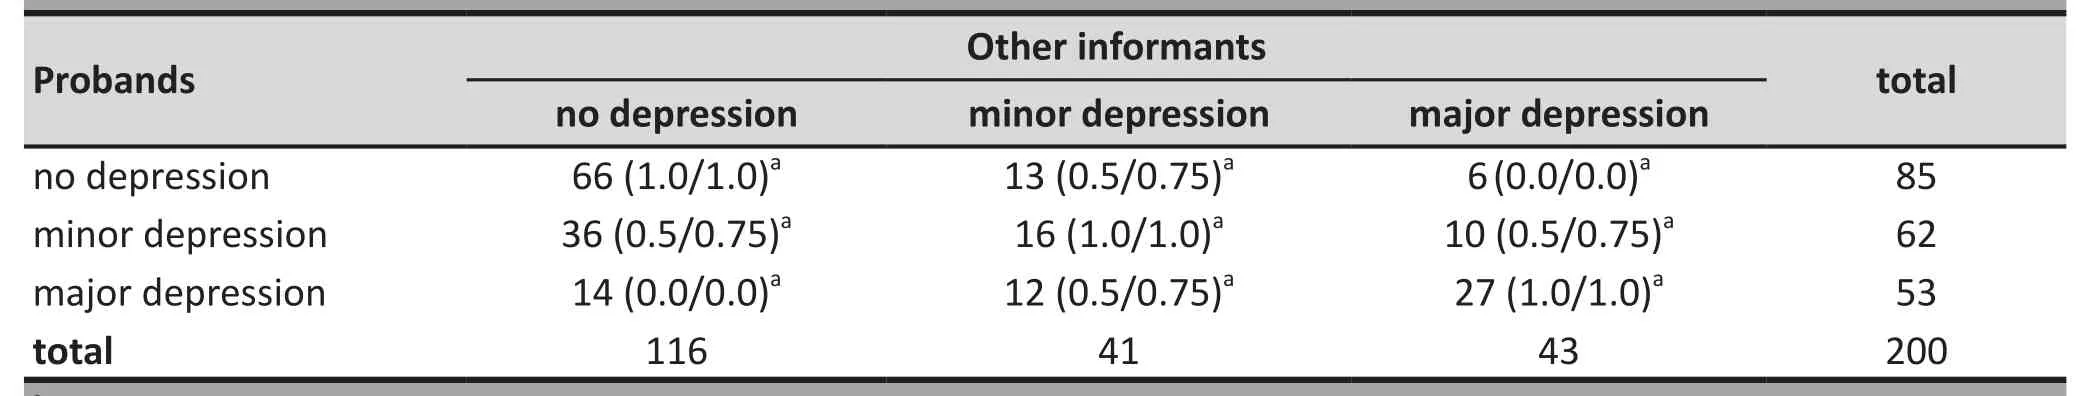
Table 5. Three ranked levels of depression categorized based on information from the probands themselves or on information from other informants about the probands
In some special circumstances the software packages will compute incorrect kappa coefficients if a square agreement table is generated despite the failure of both raters to use all rating categories. For example, suppose a scale for rater agreement has three categories, A, B, and C. If one rater only uses categories B and C, and the other only uses categories A and B,this could result in a square agreement table such as that shown in Table 6. This is a square table, but the rating categories in the rows are completely different from those represented by the column. Clearly, kappa values generated using this table would not provide the desired assessment of rater agreement. To deal with this problem the analyst must add zero counts for the rating categories not endorsed by the raters to create a square table with the right rating categories, as shown in Table 7.
校校共建。不同于建在社區(qū)由社會組織運(yùn)營的“希望來吧”,南通市陸洪閘小學(xué)的“希望來吧”建在校內(nèi),由學(xué)校行政人員、黨員、團(tuán)員及骨干教師組成“希望來吧”工作小組,協(xié)同南通大學(xué)、南通航運(yùn)學(xué)院及諸多企事業(yè)單位的熱心志愿者百余人,定期為外來務(wù)工人員子女開展教學(xué)輔導(dǎo)、心理咨詢、主題活動。如“兒童心理健康教育”“為新小市民過集體生日”“新小市民親情聊天”等,讓孩子們走進(jìn)“希望來吧”,就仿佛走進(jìn)了如家一般溫馨的港灣。
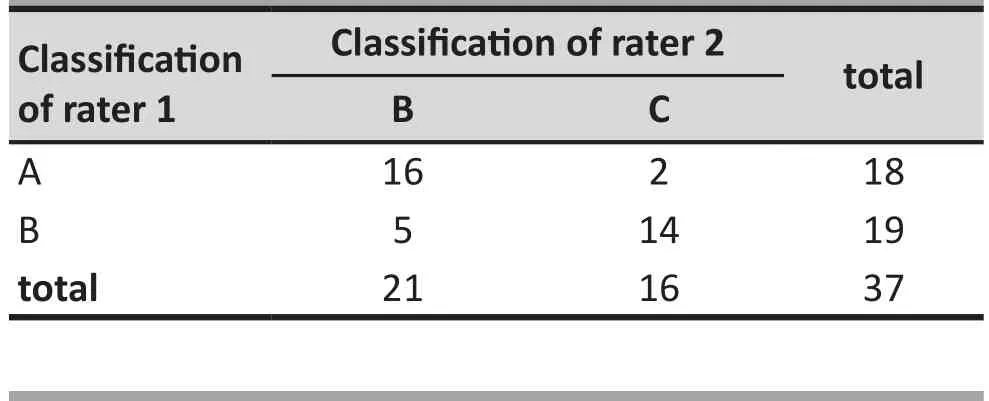
Table 6. Hypothetical example of incorrect agreement table that can occur when two raters on a three-level scale each only use 2 of the 3 levels
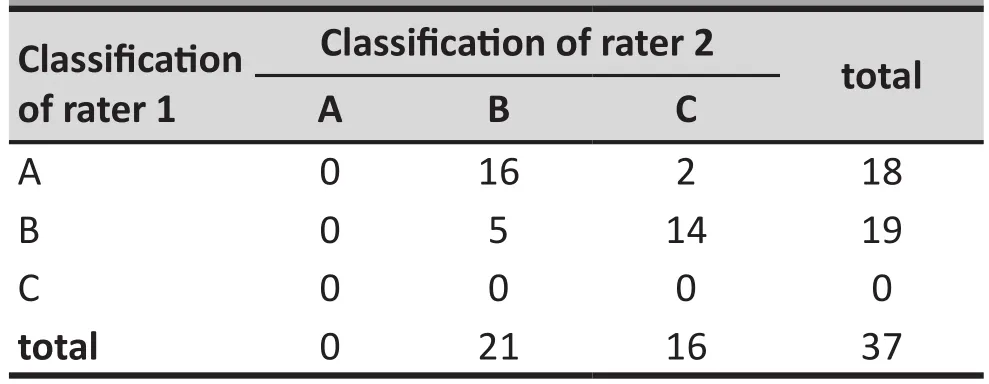
Table 7. Adjustment of the agreement table (byadding zero cells) needed when two raters on a three-level scale each only use 2 of the 3 levels
6.1 SAS
In SAS, one may use PROC FREQ and specify the corresponding two-way table with the “AGREE” option.Here are the sample codes for Example 2 using PROC FREQ:
PROC FREQ DATA = (the data set for the depression diagnosis study); TABLE (variable on result using proband) * (variable on result using other informants)/ AGREE; RUN;
PROC FREQ uses Cicchetti-Allison weights by default. One can specify (WT=FC) with the AGREE option to request weighted kappa coefficients based on Fleiss-Cohen weights. It is important to check the order of the levels and weights used in computing weighted kappa. SAS calculates weights for weighted kappa based on unformatted values; if the variable of interest is not coded this way, one can either recode the variable or use a format statement and specify the“ORDER = FORMATTED” option. Also note that data for contingency tables are often recorded as aggregated data. For example, 10 subjects with the rating ‘A’ from the first rater and the rating ‘B’ from the second rater may be combined into one observation with a frequency variable of value 10. In such cases a weight statement“weight (the frequency variable);” may be applied to specify the frequency variable.
6.2 SPSS
In SPSS, kappa coefficients can be only be computed when there are only two levels in the rating scale so it is not possible to compute weighted kappa coefficients.For a two-level rating scale such as that described in Example 1, one may use the following syntax to compute the kappa coefficient:
CROSSTABS
/TABLES=(variable on result using proband) BY
(variable on result using other informants)
/STATISTICS=KAPPA.
An alternatively easier approach is to select appropriate options in the SPSS menu:
1. Click on Analyze, then Descriptive Statistics, then Crosstabs.
2. Choose the variables for the row and column variables in the pop-up window for the crosstab.
3. Click on Statistics and select the kappa checkbox.
4. Click Continue or OK to generate the output for the kappa coefficient.
7. Discussion
In this paper we introduced the use of Cohen’s kappa coefficient to assess between-rater agreement, which has the desirable property of correcting for chance agreement. We focused on cross-sectional studies for two raters, but extensions to longitudinal studies with missing values and to studies that use more than two raters are also available.[6]Cohen’s kappa generally works well, but in some specific situations it may not accurately re flect the true level of agreement between raters.[7]. For example, when both raters report a very high prevalence of the condition of interest (as in the hypothetical example shown in Table 2), some of the overlap in their diagnoses may reflect their common knowledge about the disease in the population being rated. This should be considered ‘true’ agreement, but it is attributed to chance agreement (i.e., kappa=0).Despite such limitations, the kappa coefficient is an informative measure of agreement in most circumstances that is widely used in clinical research.
Cohen’s kappa can only be applied to categorical ratings. When ratings are on a continuous scale, Lin’s concordance correlation coefficient[8]is an appropriate measure of agreement between two raters,[8]and the intraclass correlation coefficients[9]is an appropriate measure of agreement between multiple raters.
Conflict of interest
The authors declare no con flict of interest.
Funding
None.
1. Spitzer RL, Gibbon M, Williams JBW.Structured Clinical Interview for Axis I DSM-IV Disorders. Biometrics Research Department: New York State Psychiatric Institute; 1994
2. Cohen J. A coefficient of agreement for nominal scales.Educ Psychol Meas.1960;20(1): 37-46
3. Duberstein PR, Ma Y, Chapman BP, Conwell Y, McGriff J,Coyne JC, et al. Detection of depression in older adults by family and friends: distinguishing mood disorder signals from the noise of personality and everyday life.Int Psychogeriatr.2011; 23(4): 634-643. doi: http://dx.doi.org/10.1017/S1041610210001808
4. Tang W, He H, Tu XM.Applied Categorical and Count Data Analysis. Chapman & Hall/CRC; 2012
5. Landis JR, Koch GG. The measurement of observer agreement for categorical data.Biometrics.1977; 33: 159-174. doi: http://dx.doi.org/10.2307/2529310
6. Ma Y, Tang W, Feng C, Tu XM. Inference for kappas for longitudinal study data: applications to sexual health research.Biometrics.2008; 64: 781-789. doi: http://dx.doi.org/10.1111/j.1541-0420.2007.00934.x
7. Feinstein AR, Cicchetti DV. High agreement but low kappa:I. The problems of two paradoxes.J Clin Epidemiol. 1990;43(6): 543-549. doi: http://dx.doi.org/10.1016/0895-4356(90)90158-L
8. Lin L. A concordance correlation coefficient to evaluate reproducibility.Biometrics.1989; 45(1): 255-268. doi: http://dx.doi.org/10.2307/2532051
9. Shrout PE, Fleiss J. Intraclass correlations: Uses in assessing rater reliability.Psychol Bull. 1979; 86(2): 420-428
, 2015-01-28; accepted, 2015-02-04)

Dr. Tang is a Research Associate Professor of Biostatistics in the Department of Biostatistics at the University of Rochester. His research interests are in semi-parametric modeling of longitudinal data with missing values, smoothing methods, and categorical and count data analysis and applications of statistical methods to psychosocial research. Dr. Tang received his PhD in Mathematics from the Department of Mathematics at the University of Rochester in 2004.
Kappa系數(shù):一種衡量評估者間一致性的常用方法
唐萬,胡俊,張暉,吳攀,賀華
評估者間一致性,Kappa系數(shù),加權(quán)Kappa,相關(guān)性
Summary: In mental health and psychosocial studies it is often necessary to report on the between-rater agreement of measures used in the study. This paper discusses the concept of agreement, highlighting its fundamental difference from correlation. Several examples demonstrate how to compute the kappa coefficient - a popular statistic for measuring agreement - both by hand and by using statistical software packages such as SAS and SPSS. Real study data are used to illustrate how to use and interpret this coefficient in clinical research and practice. The article concludes with a discussion of the limitations of the coefficient.
[Shanghai Arch Psychiatry. 2015; 27(1): 62-67.
10.11919/j.issn.1002-0829.215010]
1Department of Biostatistics and Computational Biology, University of Rochester, Rochester, NY, United States
2College of Basic Science and Information Engineering, Yunnan Agricultural University, Kunming, Yunnan Province, China
3Department of Biostatistics, St. Jude Children’s Research Hospital, Memphis, TN, United States
4Value Institute, Christiana Care Health System, Newark, DE, United States
5Center of Excellence for Suicide Prevention, Canandaigua VA Medical Center Canandaigua, NY, United States
*correspondence: wan_tang@urmc.rochester.edu
概述:在精神衛(wèi)生和社會心理學(xué)研究中,常常需要報告研究使用某一評估方法的評估者間的一致性。本文討論了一致性的概念,強(qiáng)調(diào)一致性與相關(guān)性的本質(zhì)區(qū)別。Kappa系數(shù)是衡量一致性的一個常用統(tǒng)計方法。我們用幾個例子說明如何通過手工計算或統(tǒng)計軟件包SAS、SPSS等計算Kappa系數(shù),用真實(shí)的研究數(shù)據(jù)說明如何在臨床研究和實(shí)踐中使用和解釋這個系數(shù)。最后文章討論了該系數(shù)的局限性。
本文全文中文版從2015年03月25日起在www.shanghaiarchivesofpsychiatry.org/cn可供免費(fèi)閱覽下載
猜你喜歡
公民與法治(2022年5期)2022-07-29 00:47:28
體育科技文獻(xiàn)通報(2022年3期)2022-05-23 13:46:54
教學(xué)考試(高考物理)(2021年5期)2021-11-08 10:31:22
遼金歷史與考古(2021年0期)2021-07-29 01:06:54
中醫(yī)眼耳鼻喉雜志(2021年1期)2021-07-22 07:38:14
科技傳播(2019年22期)2020-01-14 03:06:54
民用飛機(jī)設(shè)計與研究(2019年4期)2019-05-21 07:21:24
Coco薇(2016年2期)2016-03-22 02:42:52
燕山大學(xué)學(xué)報(2015年4期)2015-12-25 02:19:49
Coco薇(2015年1期)2015-08-13 02:47:34
- 上海精神醫(yī)學(xué)的其它文章
- Brief Chinese version of the Family Experience Interview Schedule to assess caregiver burden of family members of individuals with mental disorders
- Case report of rabies-induced persistent mental symptoms
- Attenuated psychosis syndrome: bene fits of explicit recognition
- Psychosis risk syndrome is not prodromal psychosis
- Comparison of the personality and other psychological factors of students with internet addiction who do and do not have associated social dysfunction
- Social media and suicide prevention: findings from a stakeholder survey