基于模型的農業非點源污染最佳管理措施效率評估研究進展
2014-08-10 12:26:40耿潤哲王曉燕趙雪松陳永娟
生態學報 2014年22期
耿潤哲,王曉燕,2,*,趙雪松,陳永娟
(1. 首都師范大學資源環境與旅游學院,北京 100048; 2. 首都圈水環境研究中心,北京 100048;3. 河北省豐寧滿族自治縣統計局,豐寧 068350)
基于模型的農業非點源污染最佳管理措施效率評估研究進展
耿潤哲1,王曉燕1,2,*,趙雪松3,陳永娟1
(1. 首都師范大學資源環境與旅游學院,北京 100048; 2. 首都圈水環境研究中心,北京 100048;3. 河北省豐寧滿族自治縣統計局,豐寧 068350)
隨著點源污染的逐步控制,農業非點源污染已成為世界范圍內關注的熱點,由于其特有的時空異質性特點導致對其進行有效控制較為困難,最佳管理措施(BMPs,Best Management Practices)是實現流域農業非點源污染控制的有效手段,對擬實施的BMPs效率進行評估是實施流域非點源污染BMPs配置的前提。通過模型模擬的方法可對擬采用的不同措施的削減效率及經濟成本進行評估以獲取最具成本-效益的BMPs空間配置方案,為措施有效選擇提供依據。通過對多種模型在工程型和管理型BMPs評估方面的研究進行論述表明,通常概念化模型多用于對污染源控制類措施進行評估,而機制類模型則可用于對不同時空尺度下的過程控制類BMPs進行評估;措施效率發揮的時間滯后性及模型模擬不確定性是模型模擬過程中需要重點考慮的問題,可通過增加野外監測點數量、監測頻率、優化監測點位置并選擇合適的評估指標以降低模型評估BMPs過程中滯后效應的影響;此外BMPs實施時間與空間位置的不匹配、時空尺度異質性、污染物形態及生態系統服務功能轉換風險均需在BMPs評估過程中加以考慮。模型模擬是BMPs效率評估(包括非點源污染關鍵源區的時空識別)、污染物遷移轉化以及成本效益分析的有效工具,同時對于流域非點源污染管理控制及BMPs實施利益相關者有效參與問題的分析也具有重要意義。
最佳管理措施(BMPs);削減效率;模型;非點源污染
在中國、歐盟以及美國的大部分水體中均存在藻類的過量繁殖和溶解氧含量過低等問題[1- 3],其中農業非點源污染的貢獻量達到了污染負荷總量的半數以上[4- 5]。雖然已采取大量的控制措施,但受限于普遍存在的措施可執行性、效率滯后性[6- 7]、配置方案和實施時間的合理性以及時空尺度轉換等因素的影響導致河流水體的整體水質狀況并未達到預期的治理目標[4]。
BMPs的有效實施能夠提高其污染物削減效率及經濟效益,同時還可減少土地占用。因此BMPs 削減效率的準確評估是決定措施是否適用的關鍵步驟[8]。美國農業部自20世紀80年代起提出采用BMPs對全國范圍內的農業非點源污染進行控制,并制定了相應的評估方案,如切薩皮克海灣BMPs控制計劃(Chesapeake Bay Program)就采用了小尺度代表流域監測與大尺度模型模擬相結合的方式來對該流域內的BMPs效率進行評估,并以此為實施藍本在美國其他流域內進行評估方法的推廣;在歐洲,BMPs也得到了廣泛的應用,如希臘Arachtos 河流域保護規劃中的BMPs模型評估工作、德國Ems河流域所采用的與GIS技術相結合的基于可視化評估平臺的BMPs配置及效果評估工作等;在我國,隨著政府對農業非點源污染控制逐步重視,在BMPs研究方面也逐步深入,代表性工作如長江三峽流域的BMPs評估及優化方案的提出、長春石頭口門水庫流域的BMPs配置方案的實地監測及模型評估以及北京密云水庫流域BMPs空間配置方案的優選以及BMPs評估工具箱的構建。目前流域BMPs的配置研究已經發展到采用多尺度控制技術同優化模擬算法相結合的綜合控制階段,但是BMPs效率評估作為流域整體配置的基礎仍具有不可忽視的重要作用,以上這些研究均可對BMPs評估工作提供一定的借鑒意義。
BMPs在所實施區域的本地化效應可以通過地塊尺度的實驗監測工作來實現,但是對大尺度流域內BMPs的評估工作卻很難以通過有效實地監測實驗來完成。目前來看模型模擬是應用最為廣泛的非點源污染最佳管理措施的評估技術,在流域綜合管理方案的設計執行過程中扮演著非常重要角色,尤其是對于擬實施措施的選擇和本地化應用、環境效益以及實現河流水質物理化學及生態質量明顯提升所需的時間等預測方面具有重要的用途。如:歐盟WFD計劃的初始階段,就將模型模擬技術作為擬實施BMPs潛在效率評估的首選方法。Cherry等基于不同的評估目標和研究尺度對不同的BMPs評估方法進行劃分,建議采用實地監測、模型模擬、風險評估以及養分平衡法相結合的耦合模型系統來對擬實施的BMPs進行評估,且在措施的設計和配置階段也多通過模型模擬與實地監測網絡構建相結合的方式來進行必要的決策支持[9]。但是受限于多模型數據采集以及模型操作人員技術程度等因素的限制,耦合模型在實際操作方面還存在一定的困難。
本文通過對國內外BMPs模型評估方面的相關研究進行總結,分析不同模型在BMPs評估方面的適用性,及存在的問題,以對流域綜合管理中模型評估BMPs工作研究提供理論支持和建議。
1 BMPs模型評估
按照模型運行復雜程度、適用的時空尺度,可將BMPs削減效率評估模型劃分為經驗模型、概念化模型及機制型模型[9]。在本文中按照以下兩種不同層次對模型進行劃分;1)根據模型運行機制的不同將模型分為經驗模型、概念化模型以及物理機制模型,包括不同復雜程度的實際模擬過程;2)根據可模擬BMPs運行機制的不同將模型劃分為源頭控制類措施模型和過程控制類措施模型。具體劃分情況見圖1。
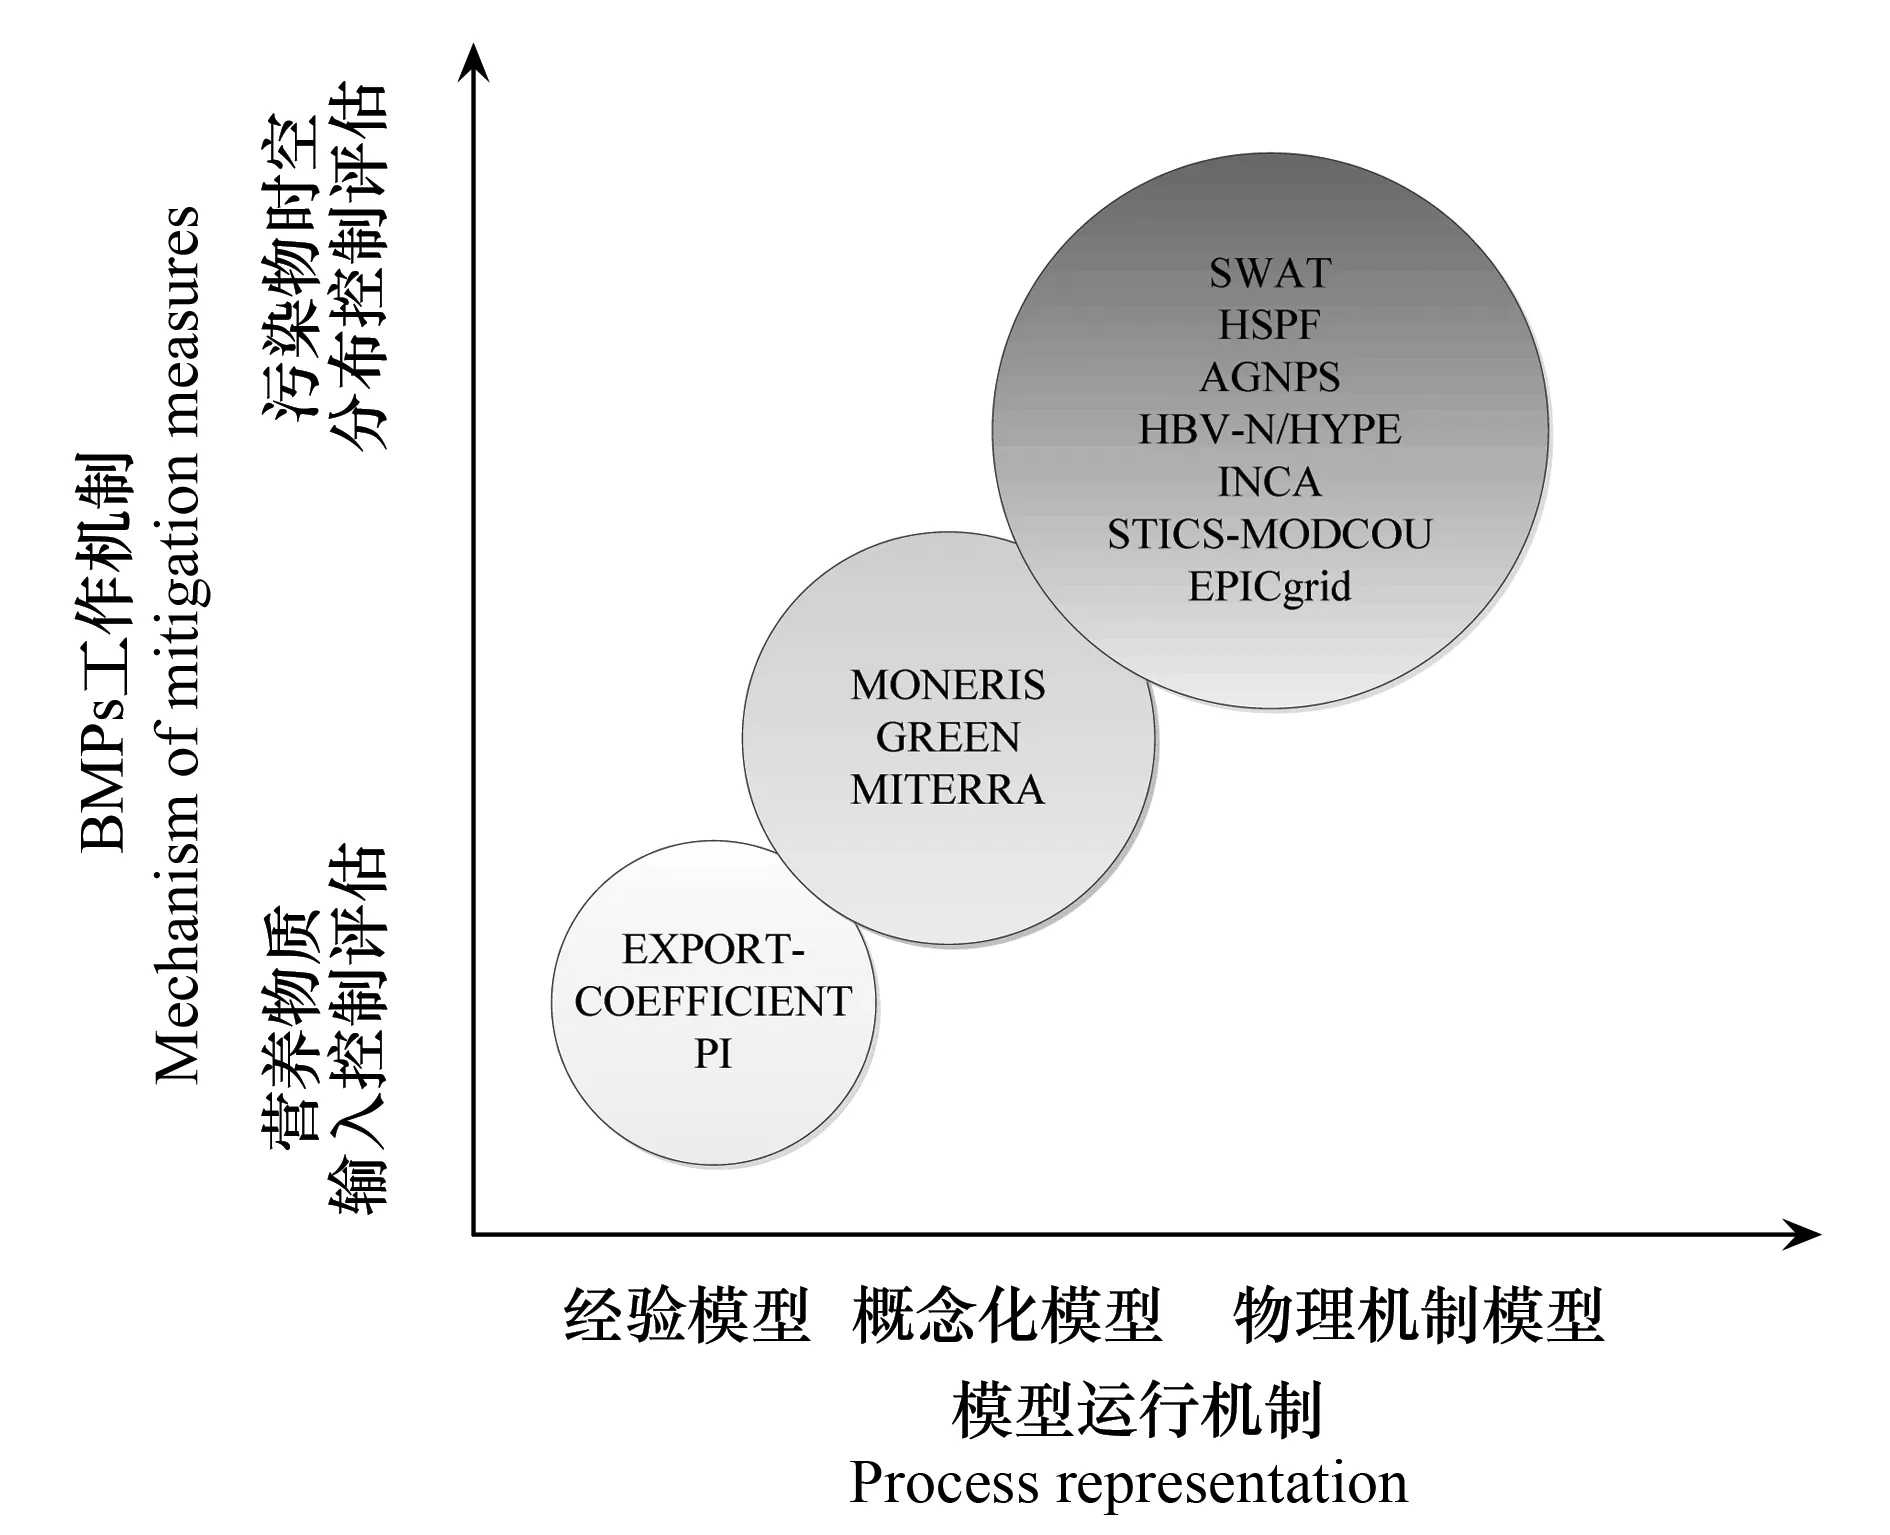
圖1 BMPs (Best Management Practices)評估模型分級圖Fig.1 Classification map of modelsSWAT: Soil and Water Assessment Tool; HSPF: Hydrological Simulation Program-Fortran; AGNPS: Annualized Agricultural Non-Point Source Pollution;HBV-N/HYPE: Hydrological Predictions for the Environment; STICS-MODCOU: Simulateur Multidiscplinaire pour les Cultures Standard; EPICgird: Erosion Productivity Impact Calculator; MONERIS: Modelling Nutrient Emissions in River Systems; GREEN: Geospatial Regression Equation for European Nutrient losses; MITERRA: A tool for integrated assessment of N emissions from agriculture at regional; ECM: Export Coefficient Model; PI: Phosphorus Index
1.1 經驗-概念化模型
經驗模型又稱為“黑箱模型”,其不涉及復雜函數運算過程(即不考慮污染物的遷移轉化過程),僅以污染物輸入輸出間的量化關系為基礎進行模擬。具有工作原理及操作簡單且所需數據量少的特點。但經驗模型對異常值和極端事件的預測可能會產生較大的誤差。概念化模型相對而言要比經驗模型復雜一些,能夠對部分簡單的污染物傳輸過程進行表征,因此所需的數據量相比經驗模型也更多。
目前在BMPs評估方面應用較為廣泛的經驗-概念化模型主要有輸出系數模型(ECM,Export Coefficient Model)[10]、GREEN模型(Geospatial Regression Equation for European Nutrient losses)[11]、MONERIS模型(Modelling Nutrient Emissions in River Systems)[7]、磷指數法(Phosphorus Index,PI)[12- 13]以及MITERRA模型(A tool for integrated assessment of N emissions from agriculture at regional)[14]等。
1.2 機制模型
機制模型能夠對污染物的產生機理、遷移轉化過程以及較為復雜的時空傳輸過程進行詳盡的模擬,因此這類模型一般較為復雜,能夠對非點源污染“源—匯”過程及與之相關的控制措施進行模擬。在BMPs評估研究中有兩類機制模型應用較為廣泛。第一類由一維營養物循環模型、水文模型以及河道過程模擬模塊組合所構成的綜合模型;第二類為耦合的流域尺度模型,在這類模型中營養物質陸地循環與河道循環過程均可通過水文模擬模塊形成反饋回路流動系統。常見的BMPs評估機制型模型包括HYPE(Hydrological Predictions for the Environment)[15- 16]、SWAT(Soil and Water Assessment Tool)[17]、AGNPS(Annualized Agricultural Non-Point Source Pollution)[18]、SUSTAIN(System for Urban Stormwater Treatment and Analysis Integration Model)[19]、HSPF(Hydrological Simulation Program-Fortran)[20]等。相關模型模擬BMPs削減效率的研究案例及模型適用性和局限性分析見表1。
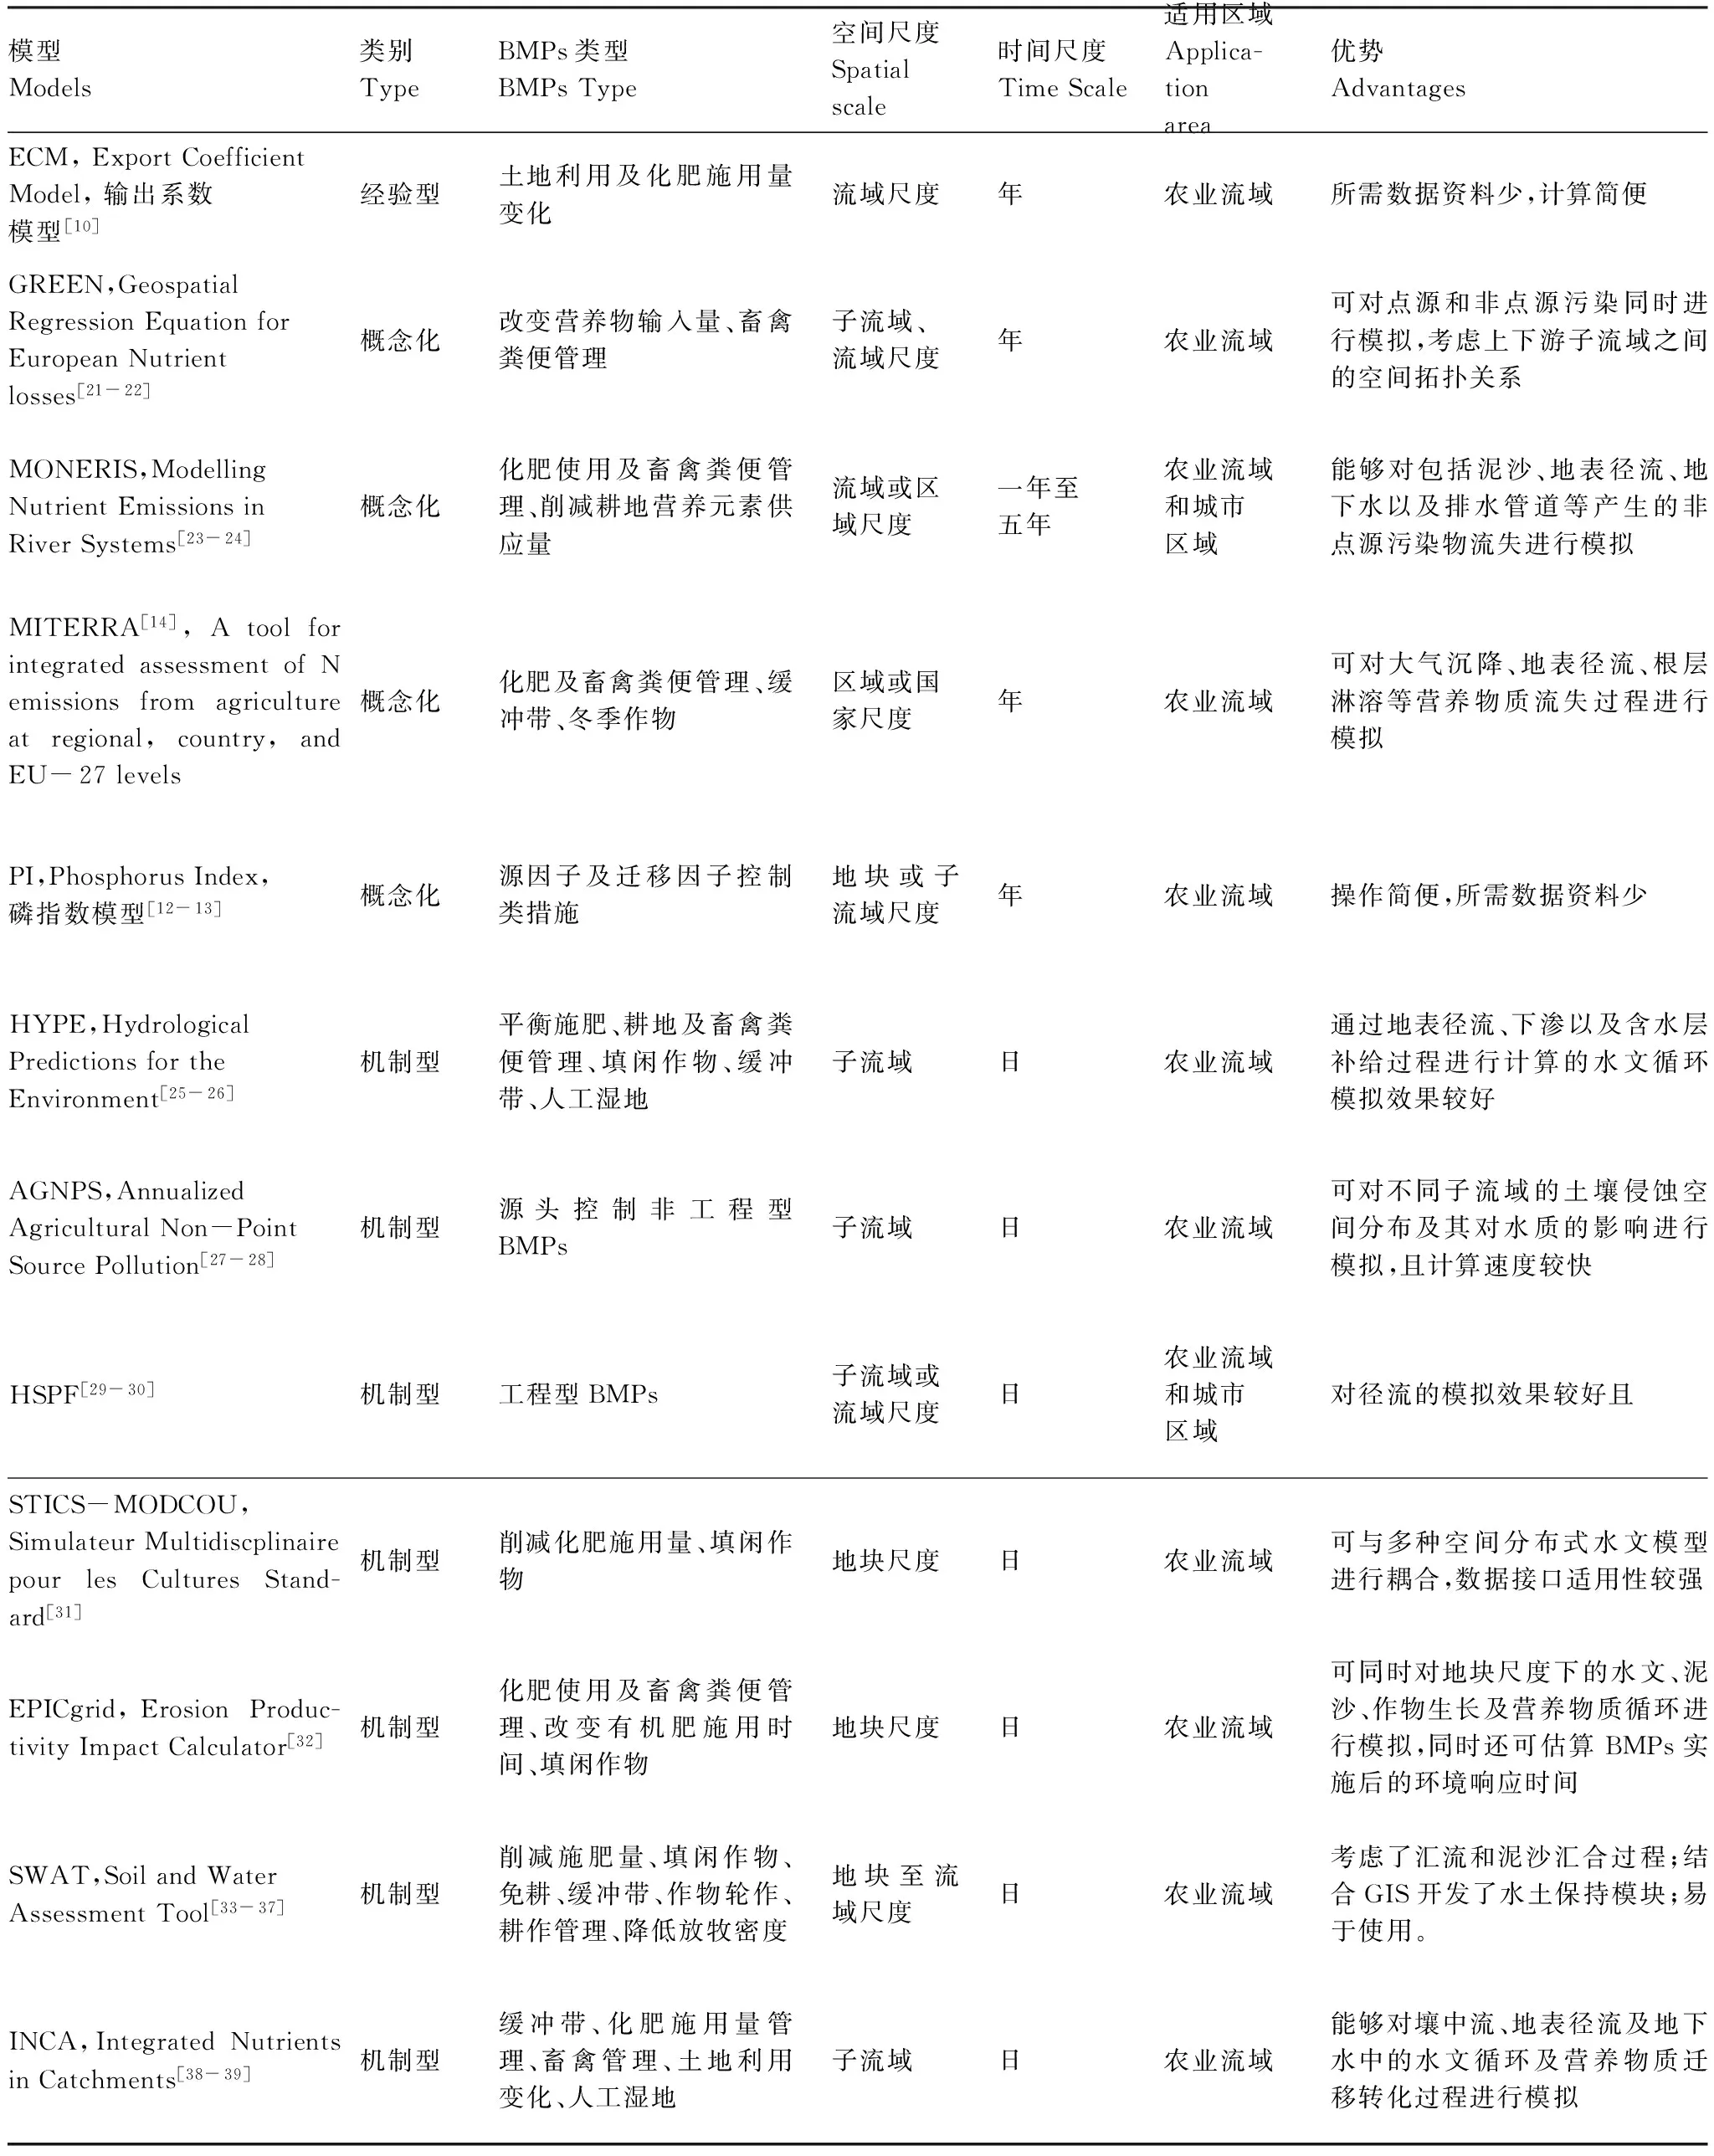
表1 模型及BMPs評估工作案例分析
2 BMPs效率模型評估中存在的問題
2.1 污染物滯留及流域響應時間
BMPs實施后水質顯著改善的響應時間主要受到措施類型、配置時間、空間位置、氣候條件以及當地的自然地理狀況等因素的共同影響。農業流域內營養物質主要通過地表徑流、壤中流以及地下水傳輸等過程到達受納水體。而壤中流和地下水流動傳輸受不同空間土壤亞層性質差異、含水層復雜動態效應的影響,措施作用的發揮可能需要一定的時間。另外,在營養物質的傳輸過程中可能還會受到反硝化作用(氮)、土壤吸附所導致的臨時儲存效應植物和微生物的吸附作用等的影響而延遲到達受納水體時間[40]。如河岸帶和濕地系統對于氮、磷等營養物質均具有較高的儲存效率,但是卻很難在流域尺度上對其效應進行評估。氣候條件、水動力環境(水土比、水力停留時間)以及化學物理特性(如:水體、沉積物以及水土界面中溶解氧濃度和光照等)均會使其對流域尺度營養物質的滯留效應產生較大的不確定性和復雜性。
通過實地監測對流域尺度營養物質傳輸和滯留效應進行研究具有一定難度,而模型模擬和養分平衡法更適用于這類研究。Meals等研究發現時間滯后性主要由3部分組成[41]:1)措施效用發揮所需的時間,如植被緩沖帶需要在措施完全設置完畢3a后才能夠發揮效用;2)BMPs所發揮的效用轉變為對水質的改善效用也需要一定時間;3)河流水體生態系統對于BMPs效用的響應所需要的時間。因此,在模型校準的過程中需考慮時間滯后性影響,在對模型校準時一定要明確所測得數據可能是措施實施后多年營養物濃度的混合值,并且長期的監測數據相比于臨時監測數據受時間滯后性的影響更大[41]。有學者采用模型模擬的方法對流域水質狀況對措施實施后效應的響應時間進行了評估。Behrendt等應用MONERIS模型對德國境內所實施的河岸帶非點源污染管理措施的評估結果表明,流域水質改善對措施效益的響應時間為10—30a不等[7]。Sohier等應用EPICgrid模型發現比利時Walloon流域在實施改善地下水水質的BMPs后由于受到蓄水層水力傳輸時間滯后性的影響,流域水質對BMPs效應的響應時間達到了15a之久[32]。 Fenton等所進行的研究表明措施實施后的流域響應時間最多可達到21a[42]。以上這些研究成果均表明應用模型對BMPs效率進行評估時應當考慮較長的河流水質響應滯后期,同時也可采用短期穩態模型以弱化時間滯后性的影響。
2.2 模型模擬的不確定性
很多學者在應用模型方法對流域BMPs進行評估時發現措施效率會受到特定區域氣候條件的影響,因此,沒有任何一種模型能夠具有普適性。各種不同的模型在特定區域使用時由于研究目的不同均會體現出一定的優勢和不足,同時不同的區域特征及數據的可獲取性也會對模型的不確定性產生影響,如歐盟WFD計劃中各成員國所采用的BMPs評估模型在歐洲南部區域使用時的不確定性要高于其他區域[40]。歐洲多國的研究表明由于模型模擬主要是以流域出口的實測數據為基準,而不是以營養物滯留過程及非點源污染物的排放為基準,因此在目標流域內建立合適的營養物滯留與排放過程模擬模型是較為困難的。實際上,在模型模擬過程中如果對營養物滯留與排放過程同時出現高估或低估的現象,那么模擬結果也可能是合理的。模型模擬過程中不同參數的組合也可能會出現相同的模擬結果,也即“異參同效”效應[9]。對模型的校準和營養物傳輸模擬過程的調整會對模型有效評估起到重要的控制作用。通過對基礎情景模擬結果和措施實施后模擬值之間均方根誤差進行比較,將有助于識別和降低措施實施后模型評估校準和驗證過程導致的污染物負荷量的變化隊評估結果的影響[43]。
2.3 措施實施的時間和位置
在BMPs的實際配置工作中首先需要采用模型模擬或風險評估的方法來對目標流域內非點源污染的關鍵源區(CSAs,Critical Source Areas)進行識別,這有助于提高措施配置目的性并獲得較高的成本效益比[9]。Vagstad等分別采用7種復雜程度不同的模型對恩扎河流域(意大利)和Zelivka河(捷克)流域內的BMPs評估結果的一致性及對流域出口水質狀況的影響進行評估。結果表明,不同類型措施對于不同模型工具的反映存在一定的差異,但是在兩個流域內組合實施的BMPs卻產生了相似的削減效果[44]。究其原因可能是由不同模型對不同類型措施進行模擬時內部參數設置差異所致。另外其研究結果還表明措施空間配置不同也會產生不同的效果(如土地利用變化措施中所需實施變化的土地利用的位置不同)。因此,在運用模型對措施進行評估時(如增加林地覆蓋面積或改變農作物種植類型),模型的參數化、對時空變化的敏感性等都會對措施效果的模擬結果產生影響[44]。部分學者還針對BMPs配置前進行CSAs識別的必要性以及哪些模型適用于CSAs識別進行了討論[45- 47]。Panagopoulos等就如何在有限的實測數據條件下運用SWAT模型進行流域非點源污染CSAs識別進而配置合適的BMPs問題進行了討論[36]。現有關于模型的研究大多僅關注單一措施實施后的效果的評估,但實際監測發現流域非點源污染治理目標的實現只有通過在合理的時空節點上進行BMPs的組合配置才能夠實現。
2.4 模型模擬的時空尺度
目前多數學者都對BMPs評估中的空間(如地塊、景觀、流域、區域)及時間尺度問題進行了討論[48- 50]。有研究表明措施設置的空間尺度(地塊尺度)與水質評價(河道水質狀況)之間本身就存在一定的尺度差異性[51]。通常情況下措施是在地塊尺度上實施,但卻以流域整體的水質狀況是否達標作為評價標準,同時在不同的空間尺度內還可能涉及不同的利益相關者。正如2.1節中所提到響應的時間滯后性,氣候變化等因素均會對不同時空尺度內的措施效果產生影響。空間尺度的差異也會對措施實施后所導致的污染物轉換風險產生影響[52- 53]。
通常根據研究區的空間尺度大小來選擇合適的BMPs評估模型,機制型模型適用于小尺度到大中尺度流域BMPs的評估,而區域尺度BMPs的評估則主要通過經驗型模型來完成,如GREEN、MONERIS、MITERRA、PI以及輸出系數模型等。隨著近年來全球環境基礎數據庫構建的不斷完善,也有部分學者采用機制型模型對區域或國家尺度上的非點源污染進行研究[54]。適用于大尺度農業系統中作物生長、土壤侵蝕以及營養物流失過程模擬的機制型模型(如EPIC、MITERRA模型等)也逐漸受到了較多的關注,但是這些模型對地下水及匯水區污染物對河流營養物負荷總量貢獻率的相關研究在大尺度區域內卻仍然存在一定的限制。
不同空間尺度流域內實測/調查數據(如:BMPs相關信息、基礎情景下營養物質輸入量、氣候環境特征以及用于模型校準的水質流量數據的時間序列)的可用性也會對模型模擬結果產生較大的影響。非點源污染模型可以對BMPs實施后對目標流域內污染物的遷移、轉化、緩沖以及滯留等過程進行模擬,但其模擬精度卻受到實測數據的可用性的影響而產生較大的差異。因此,精確模擬結果的獲取應當以構建完善的監測網絡及數據庫為基礎。然而,目前來看世界各地均存在多尺度水質監測網絡不足以支撐各類BMPs評估的問題[6],同時監測數據的可靠性還受到采樣頻率及實驗計算方法不同的影響[55]。即使是在監測數據缺乏的條件下,模型法在BMPs評估工作中仍然會發揮較大的作用,如Panagopoulos等和Maringanti等的研究中就是在有限的監測數據條件下實現了對CSAs的識別以及污染物不同季節變化趨勢的合理解釋,但是這些研究也僅僅是對措施實施后污染物負荷量及關鍵源區的整體變化趨勢進行了評估,并沒有獲得較為可靠的量化環境評估結果[35,36]。
2.5 污染物形態及生態系統服務功能轉換風險
流域水環境治理目標的實現需要對不同形態或類型的污染物同時進行有效控制,但是目前還沒有任何一種BMP能夠實現多種污染物的同時有效調控[52]。反而在BMPs的配置過程中可能會使得一種BMPs的實施可能會對某一種污染物起到控制削減作用,但同時可能會使得另一種或多種的污染物濃度或負荷量得到增加,或者是在對某種污染物的一種形態進行削減,但是導致污染物其他形態之間出現化學成分轉換或增加[52]。例如,在流域內設置以提高氮的反硝化作用為工作機制的BMPs后可能會使得水體中的硝酸鹽氮負荷量降低,但同時會使得排入大氣層中的亞硝態氮的負荷量增加,這會使得溫室氣體的效應風險得到增加。
應用模型對BMPs進行評估時的污染物形態轉換風險可以通過多模型耦合的方法來解決。這對于BMPs配置過程中的多目標優化決策問題具有重要的意義。然而,由于污染物形態轉換風險所涉及的多種污染物或同種污染物多種形態所導致對其進行準確模擬具有一定的復雜性和難度,目前關于BMPs配置過程中的污染物形態轉換風險的研究案例還不多[56]。僅有的研究來自Velthof等應用MITERRA模型對歐盟27國所采用的BMPs對氮的排放對地下水和大氣層的影響的削減效果進行了評估[14]。
另外,在進行流域非點源污染BMPs多目標配置工作中還應當考慮措施的實施對流域內不同生態系統服務功能的影響。因此,在今后的研究中,需要進一步建立能夠對生態系統服務功能轉換風險進行評估的模型[57]。多種措施的集成實施以及多學科模型研究的交叉應用也應當成為未來BMPs評估模型研究的方向。
2.6 成本-效益分析和優化
通過BMPs效率的評估已經不能夠在有限的資金資源條件下解決BMPs的有效配置問題,因此,成本-效益分析在BMPs配置工作中受到了越來越多的關注。目前來看成本-效益分析多通過非點源污染模型與經濟評估模型相結合構建成本-效益分析模擬系統的途徑來解決,如自然環境-經濟模型就是通過基于自然環境模擬機制的非點源污染模型與經濟評估模型組合而成,其所采用的經濟評估模型還能夠對不同措施實施后的環境效益進行貨幣化轉換[58- 59]。如:Ledoux等應用STICS模型對法國東北部小流域內所設置的不同BMPs組合的成本-效益進行分析[31];Volk等采用包括SWAT模型在內的4種不同的生物-物理機制模型建立了空間決策支持系統以評估不同的土地利用管理政策對德國埃姆斯河上游流域內污染物的削減情況進行成本-效益分析[49];Cools等將SWAT模型與經濟優化模型相結合來獲取成本-效益比較高的措施組合以對比利時境內的非點源污染負荷量進行削減[60]。以上這些研究都較好的提供了在不同的空間尺度下所適用的成本-效益分析耦合模型系統。
耦合模型是BMPs成本-效益分析過程中的空間尺度、氣候變化以及污染物形態轉換風險進行評估的有效途徑,但是該方法對于數據量及精度要求較高,同時還需要包括自然科學、社會科學、經濟科學以及利益相關者共同參與建立模型優化所需的環境和社會經濟目標。另外,由于自然邊界和行政邊界的不匹配性,在進行成本-效益分析時措施實施后的短期及長期環境效益的量化、空間分布等問題也會對BMPs的成本-效益分析工作及措施的最終實施帶來很大的影響。[54,61]。
2.7 BMPs利益相關者參與及可行性
在BMPs的適用性評估中,利益相關者對措施的可接受度評價是最重要的一部分內容。利益相關者包括決策者、農戶、河流管理機構、用水企業等。非點源污染模型能夠為其提供措施實施前后的水質改善信息、增加對相關措施的了解并獲取可視化評估結果以提高不同涉益群體對擬實施BMPs的接受度。許多研究發現模型對BMPs評估結果的可靠性、利益相關者之間的信任度、社會屬性以及模擬結果的表達方式等都會對BMPs的可接受度產生影響[62- 65]。不同部門的利益相關者可以參與到流域BMPs配置工作的各個階段包括:問題識別、模型設置及調校、BMPs情景制定以及模型預測結果討論等[64]。在BMPs模型評估工作中引入利益相關者參與機制具有以下幾方面優勢:1)縮短模擬工作準備時間:利益相關者參與有助于模型模擬者更好的獲取和理解所模擬流域的基本狀況;2)不確定性:利益相關者能夠對模擬結果提供反饋和相關信息,以降低模型模擬工作的不確定性;3)措施篩選:利益相關者參與有助于更快的識別當前的措施并選擇合適的模型以對措施的時間和空間過程進行評估;4)尺度方面:由于流域非點源污染評估的利益相關者均來自流域內不同的空間尺度單元,使其參與其中有助于模型操作者更快的獲取多尺度模擬方法以對不同措施的削減效率進行評估;5)污染物形態轉換風險:利益相關者參與是識別BMPs在特定區域所具有的特定控制效果、環境目標以及生態系統服務功能的基礎,因此有助于更加準確的獲取合適的BMPs配置方案;6)成本-效益分析:不同利益相關者對水資源或生態系統的價值具有不同的看法和觀點。因此,使其參與BMPs的模擬評估過程對于BMPs配置情景的成本分析及不同措施的可行性的評估具有重要的作用。
3 研究展望
BMPs削減效率的評估是順利實現高效的流域整體配置方案的基礎,模型技術是進行多尺度復雜條件下BMPs有效評估的重要手段。采用模型模擬法對BMPs進行評估應對措施實施時間和位置、成本效益、污染物形態以及生態系統服務功能轉換風險、利益相關者參與問題等加以考慮,以增加模擬結果的可靠性和措施的可接受度。模型的合理應用對于構建最具成本-效益的BMPs控制規劃、降低潛在的經濟社會成本、提高措施的可執行性具有重要的意義。
(1)BMPs削減效率的滯后性問題是模擬過程中非常重要的影響因素,在今后的研究中可在以下方面進行改進:1)提高流域特征識別的準確性(水文傳輸過程、自然地理過程以及污染源空間位置)以降低模型選擇以及措施配置失當所導致的滯后性;2)BMPs的合理選擇、優化空間配置方案以減少由于措施的不合理配置所導致的削減效率響應的滯后性;3)通過增加野外監測點的數量、監測頻率并優化監測位置(如:通過地表徑流監測可能會比河道監測更快的獲取作物輪作及化肥減施等措施的污染物削減效應)[66],并選擇合適的評估指標以降低滯后效應的影響[41]。
(2)模型的評估和驗證是降低模型應用過程中不確定性非常重要的步驟,在今后的研究中應通過完善監測網絡增加流域內的實測數據點以及對利益相關者進行調查以獲取相關參數對模型進行校準和驗證是提高模型對污染物傳輸機制進行合理模擬并實現模型參數化和本地化的良好途徑[40,44,67]。
(3)通過模型模擬的方法對不同措施及其組合實施后的協同效應、不同景觀特征之間關系以及合理的措施設置時間進行評估是下一步流域BMPs優化配置研究中的重點[68]。主要包括采用適用于不同運行機制、不同空間尺度的多模型相結合的方式來對BMPs進行評估[9],或是通過多步驟模擬相結合的方式開展BMPs評估工作。同時多模型耦合法也是應對污染物形態轉換風險的有效手段。
(4)流域BMPs配置研究涉及多學科、多目標以及多尺度條件下的綜合研究,因此僅考慮BMPs削減效率評估還不能夠滿足流域綜合管理研究的需求,需要將BMPs的環境效益同經濟評估相結合并考慮利益相關者參與以有效的解決BMPs優化配置過程中的滯后效應、多尺度條件下的BMPs時空配置問題、模型的不確定性以及污染物形態轉換風險等問題,實現成本-效益最優化的BMPs配置方案。
致謝:感謝中國科學院東北地理與農業生態研究所歐洋博士對寫作給予的幫助。
[1] Wang X Y. Study for the Non-point Source Pollution Mechanism and Its Mitigation Management: a Case of Miyun Reservoir Watershed. Beijing: Science Press, 2011.
[2] Voss M, Dippner J W, Humborg C, Hürdler J, Korth F, Neumann T, Schernewski G, Venohr M. History and scenarios of future development of Baltic Sea eutrophication. Estuarine, Coastal and Shelf Science, 2011, 92(3): 307- 322.
[3] Sutton M A, Howard C M, Erisman J W, Billen G, Bleeker A, Grennfelt P, Grinsven H V, Grizzetti B. The European Nitrogen Assessment: Sources, Effects and Policy Perspectives. Cambridge: Cambridge University Press, 2011.
[4] Bouraoui F, Grizzetti B. Long term change of nutrient concentrations of rivers discharging in European seas. Science of the Total Environment, 2011, 409(23): 4899- 4916.
[5] Grizzetti B, Bouraoui F, Aloe A. Changes of nitrogen and phosphorus loads to European seas. Global Change Biology, 2012, 18(2): 769- 782.
[6] Iital A, Pachel K, Deelstra J. Monitoring of diffuse pollution from agriculture to support implementation of the WFD and the Nitrate Directive in Estonia. Environmental Science & Policy, 2008, 11(2): 185- 193.
[7] Behrendt H, Huber P, Kornmilch M, Opitz D, Schmoll O, Scholz G, Uebe R. Nutrient emissions into river basins of Germany. Texte, 2000, 23: 261.
[8] Meng F D, Geng R Z, Ou Y, Wang X Y. A review for evaluating the effectiveness of BMPs to mitigate non-point source pollution from agriculture. Acta Ecologica Sinica, 2013, 33(5): 1357- 1366.
[9] Cherry K A, Shepherd M, Withers P J A, Mooney S J. Assessing the effectiveness of actions to mitigate nutrient loss from agriculture: A review of methods. Science of the Total Environment, 2008, 406(1- 2): 1- 23.
[10] Johnes P J. Evaluation and management of the impact of land use change on the nitrogen and phosphorus load delivered to surface waters: the export coefficient modelling approach. Journal of Hydrology, 1996, 183(3- 4): 323- 349.
[11] Grizzetti B, Bouraoui F, De Marsily G. Assessing nitrogen pressures on European surface water. Global Biogeochemical Cycles, 2008, 22(4), doi: 10.1029/2007GB003085.
[12] Mcdowell R, Sharpley A N, Folmar G. Phosphorus export from an agricultural watershed: linking source and transport mechanisms. Journal of Environmental Quality, 2001, 30(5): 1587- 1595.
[13] Sharpley A N, Kleinman P J, Jordan P, Bergstr?m L, Allen A L. Evaluating the success of phosphorus management from field to watershed. Journal of Environmental Quality, 2009, 38(5): 1981- 1988.
[14] Velthof G L, Oudendag D, Witzke H P, Asman W A H, Klimont Z, Oenema O. Integrated assessment of nitrogen losses from agriculture in EU- 27 using MITERRA-EUROPE. Journal of Environmental Quality, 2009, 38(2): 402- 417.
[15] Str?mqvist J, Arheimer B, Dahne J, Donnelly C, Lindstr?m G. Water and nutrient predictions in ungauged basins: set-up and evaluation of a model at the national scale. Hydrological Sciences Journal, 2012, 57(2): 229- 247.
[16] Singh V P. Computer models of watershed hydrology. Highlands Ranch, Colorado: Water Resources Publications, 1995.
[17] Arnold J G, Srinivasan R, Muttiah R S, Williams J R. Large area hydrologic modeling and assessment part I: Model development. JAWRA Journal of the American Water Resources Association, 1998, 34(1): 73- 89.
[18] Quinn P, Beven K, Chevallier P, Planchon O. The prediction of hillslope flow paths for distributed hydrological modelling using digital terrain models. Hydrological Processes, 1991, 5(1): 59- 79.
[19] Elliott A H, Trowsdale S A. A review of models for low impact urban stormwater drainage. Environmental Modelling & Software, 2007, 22(3): 394- 405.
[20] Donigan A S, Imhoff J C, Bicknell B R, Kittle J L. Application Guide for Hydrological Simulation Program: FORTRAN(HSPF). EPA- 600/3- 84-065 June 1984 Environmental Research Laboratory, Athens, GA 177 p, 19 fig, 17 tab, 3 app, 20 ref 68-01- 6207, 1984. URL: http://nepis.epa.gov/Exe/ZyPDF.cgi/2000HMKI.PDF?Dockey=2000HMKI.
[21] Grizzetti B, Bouraoui F, De Marsily G, Bidoglio G. A statistical method for source apportionment of riverine nitrogen loads. Journal of Hydrology, 2005, 304(1- 4): 302- 315.
[22] Thieu V, Bouraoui F, Aloe A, G B. Scenario analysis of pollutants loads to European regional seas for the year 2020. Part I: Policy options and alternative measures to mitigate land based emission of nutrients. Luxembourg: EUR 25159 EN, 2012. URL: http://publications.jrc.ec.europa.eu/repository/bitstream/111111111/23310/1/lbnb25159enn.pdf.
[23] Caille F, Riera J L, Rosell-Melé A. Modelling nitrogen and phosphorus loads in a Mediterranean river catchment (La Tordera, NE Spain). Hydrology and Earth System Sciences, 2012, 16(8): 2417- 2435.
[24] Mewes M. Diffuse nutrient reduction in the German Baltic Sea catchment: Cost-effectiveness analysis of water protection measures. Ecological Indicators, 2012, 22: 16- 26.
[25] Arheimer B, L?wgren M, Pers B C, Rosberg J. Integrated catchment modeling for nutrient reduction: scenarios showing impacts, potential, and cost of measures. AMBIO: A Journal of the Human Environment, 2005, 34(7): 513- 520.
[26] Arheimer B, Dahné J, Donnelly C. Climate change impact on riverine nutrient load and land-based remedial measures of the Baltic Sea Action Plan. Ambio, 2012, 41(6): 600- 612.
[27] Zhao G, Zhang T Z, Chen J N. Simulation of cropland erosion control strategies using the AGNPS model. Journal of Tsinghua University: Science and Technology, 2002, 42(5): 705- 707.
[28] Qi H H, Altinakar M S. A conceptual framework of agricultural land use planning with BMP for integrated watershed management. Journal of Environmental Management, 2011, 92(1): 149- 155.
[29] Xue Y F. Simulation of Non-point Source Pollution on the Basin of Chaohe River by HSPF Model [D]. Beijing: Capital Normal University, 2009.
[30] Mohamoud Y, Parmar R, Wolfe K. Modeling Best Management Practices (BMPs) with HSPF; proceedings of the Innovations in Watershed Management under Land Use and Climate Change Proceedings of the 2010 Watershed Management Conference, Madison, Wisconsin, USA, 23- 27 August 2010, F, American Society of Civil Engineers (ASCE), 2010, 892- 898, doi: 10.1061/41143(394)81.
[31] Ledoux E, Gomez E, Monget J M, Viavattene C, Viennot P, Ducharne A, Benot M, Mignolet C, Schott C, Mary B. Agriculture and groundwater nitrate contamination in the Seine basin. The STICS-MODCOU modelling chain. Science of the Total Environment, 2007, 375(1- 3): 33- 47.
[32] Sohier C, Degre A. Modelling the effects of the current policy measures in agriculture: an unique model from field to regional scale in Walloon region of Belgium. Environmental Science & Policy, 2010, 13(8): 754- 765.
[33] Lam Q D, Schmalz B, Fohrer N. The impact of agricultural Best Management Practices on water quality in a North German lowland catchment. Environmental Monitoring and Assessment, 2011, 183(1- 4): 351- 379.
[34] Laurent F, Ruelland D. Assessing impacts of alternative land use and agricultural practices on nitrate pollution at the catchment scale. Journal of Hydrology, 2011, 409(1): 440- 450.
[35] Maringanti C, Chaubey I, Arabi M, Engel B. Application of a multi-objective optimization method to provide least cost alternatives for NPS pollution control. Environmental Management, 2011, 48(3): 448- 461.
[36] Panagopoulos Y, Makropoulos C, Baltas E, Mimikou M. SWAT parameterization for the identification of critical diffuse pollution source areas under data limitations. Ecological Modelling, 2011, 222(19): 3500- 3512.
[37] Shen Z Y, Hong Q, Chu Z, Gong Y W. A framework for priority non-point source area identification and load estimation integrated with APPI and PLOAD model in Fujiang Watershed, China. Agricultural Water Management, 2011, 98(6): 977- 989.
[38] Flynn N J, Paddison T, Whitehead P G. INCA Modelling of the Lee System: strategies for the reduction of nitrogen loads. Hydrology and Earth System Sciences Discussions, 2002, 6(3): 467- 484.
[39] Rankinen K, Kenttomies K, Lehtonen H, Nenonen S. Nitrogen load predictions under land management scenarios for a boreal river basin in northern Finland. Boreal Environment Research, 2006, 11(3): 213- 228.
[40] Hejzlar J, Anthony S, Arheimer B, Behrendt H, Bouraoui F, Grizzetti B, Groenendijk P, Jeuken M H J L, Johnsson H, Porto A L, Kronvang B, Panagopoulos Y, Siderius C, Silgarn M,Venohr M, Zaloudlk J. Nitrogen and phosphorus retention in surface waters: an inter-comparison of predictions by catchment models of different complexity. Journal of Environmental Monitoring, 2009, 11(3): 584- 593.
[41] Meals D W, Dressing S A, Davenport T E. Lag time in water quality response to best management practices: A review. Journal of Environmental Quality, 2010, 39(1): 85- 96.
[42] Fenton O, Schulte R P O, Jordan P, Lalor S T J, Richards K G. Time lag: a methodology for the estimation of vertical and horizontal travel and flushing timescales to nitrate threshold concentrations in Irish aquifers. Environmental Science & Policy, 2011, 14(4): 419- 431.
[43] Hanratty M P, Stefan H G. Simulating climate change effects in a Minnesota agricultural watershed. Journal of Environmental Quality, 1998, 27(6): 1524- 1532.
[44] Vagstad N, French H K, Andersen H E, Behrendt H, Grizzetti B, Groenendijk P, Porto A L, Reisser H, Siderius C, Stromquist J, Hejzlar J,Deelstra J. Comparative study of model prediction of diffuse nutrient losses in response to changes in agricultural practices. Journal of Environmental Monitoring, 2009, 11(3): 594- 601.
[45] Collins A L, Str?mqvist J, Davison P S, Lord E I. Appraisal of phosphorus and sediment transfer in three pilot areas identified for the catchment sensitive farming initiative in England: application of the prototype PSYCHIC model. Soil Use and Management, 2007, 23(1): 117- 132.
[46] Lin Z, Radcliffe D E, Risse L M, Romeis J J, Jackson C R. Modeling phosphorus in the Lake Allatoona watershed using SWAT: II. Effect of land use change. Journal of Environmental Quality, 2009, 38(1): 121- 129.
[47] Shen Z Y, Liao Q, Hong Q, Gong Y W. An overview of research on agricultural non-point source pollution modelling in China. Separation and Purification Technology, 2012, 84: 104- 111.
[48] Quinn P. Scale appropriate modelling: representing cause-and-effect relationships in nitrate pollution at the catchment scale for the purpose of catchment scale planning. Journal of Hydrology, 2004, 291(3- 4): 197- 217.
[49] Volk M, Hirschfeld J, Dehnhardt A, Schmidt G, Bohn C, Liersch S, Gassman P W. Integrated ecological-economic modelling of water pollution abatement management options in the Upper Ems River Basin. Ecological Economics, 2008, 66(1): 66- 76.
[50] Wall D P, Murphy P N C, Melland A R, Mechan S, Shine O, Buckley C, Mellander P E, Shortle G, Jordan P. Evaluating nutrient source regulations at different scales in five agricultural catchments. Environmental Science & Policy, 2012, 24: 34- 43.
[51] Puustinen M, Turtola E, Kukkonen M, Koskiaho J, Linjama J, Niinioja R, Tattari S. VIHMA—A tool for allocation of measures to control erosion and nutrient loading from Finnish agricultural catchments. Agriculture Ecosystems & Environment, 2010, 138(3): 306- 317.
[52] Stevens C J, Quinton J N. Diffuse pollution swapping in arable agricultural systems. Critical Reviews in Environmental Science and Technology, 2009, 39(6): 478- 520.
[53] Stevens C J, Quinton J N. Policy implications of pollution swapping. Physics and Chemistry of the Earth, Parts A/B/C, 2009, 34(8- 9): 589- 594.
[54] De Roo A, Burek P, Gentile A, Udias A, Bouraoui F, Aloe A, Bianchi A, La N A, Kuik O, Elorza T J, Vandecasteele I, Mubareka S, Baranzelli C, Van Marcel, Lavalle C, Bidoglio G. A multi-criteria optimisation of scenarios for the protection of water resources in Europe: Support to the EU Blueprint to Safeguard Europe′s Waters, EUR -Scientific and Technical Research Reports, 2012, doi: 10.2788/55540.
[55] Skarb?vik E, St?lnacke P, Bogen J, B?nsnes T E. Impact of sampling frequency on mean concentrations and estimated loads of suspended sediment in a Norwegian river: Implications for water management. Science of the Total Environment, 2012, 433: 462- 471.
[56] Collins A L, Mcgonigle D F. Monitoring and modelling diffuse pollution from agriculture for policy support: UK and European experience. Environmental Science & Policy, 2008, 11(2): 97- 101.
[57] Schoumans O F, Chardon W J, Bechmann M E, Gascuel-Odoux C, Hofman G, Kronvang B, Rubk G H, Ulen B, Dorioz J M. Mitigation options to reduce phosphorus losses from the agricultural sector and improve surface water quality: A review. Science of the Total Environment, 2014: 468- 469: 1255- 1266.
[58] Booker J F, Michelsen A M, Ward F A. Economic impact of alternative policy responses to prolonged and severe drought in the Rio Grande Basin. Water Resources Research, 2005, 41(2): 1- 15.
[59] Gürlük S, Ward F A. Integrated basin management: water and food policy options for Turkey. Ecological Economics, 2009, 68(10): 2666- 2678.
[60] Cools J, Broekx S, Vandenberghe V, Sels H, Meynaerts E, Vercaemst P, Seuntjens P, van Hulle S, Wustenberghs H, Bauwens W, Huygens M. Coupling a hydrological water quality model and an economic optimization model to set up a cost-effective emission reduction scenario for nitrogen. Environmental Modelling & Software, 2011, 26(1): 44- 51.
[61] van der Veeren R J H M, Lorenz C M. Integrated economic-ecological analysis and evaluation of management strategies on nutrient abatement in the Rhine basin. Journal of Environmental Management, 2002, 66(4): 361- 376.
[62] Arheimer B, Andersson L, Alkan-Olsson J, Jonsson A. Using catchment models to establish measure plans according to the water framework directive. Water Science & Technology, 2007, 56(1): 21- 28.
[63] Olsson J A, Andersson L. Possibilities and problems with the use of models as a communication tool in water resource management. Water Resources Management. 2007, 21(1): 97- 110.
[64] Voinov A, Gaddis E J B. Lessons for successful participatory watershed modeling: a perspective from modeling practitioners. Ecological Modelling, 2008, 216(2): 197- 207.
[65] Grizzetti B, Porto A L, Barkved L J, Joy K, Paranjape S, Deelstra J, Bouraoui F, Manasi S. The science-policy-stakeholder interface in water pollution assessment // Science, Policy and Stakeholders in Water Management-An Integrated Approach to River Basin Management. Earthscan, 2010: 67- 77.
[66] Tomer M D, Burkart M. Long-term effects of nitrogen fertilizer use on ground water nitrate in two small watersheds. Journal of Environmental Quality, 2003, 32(6): 2158- 2171.
[67] Kronvang B, Andersen H E, B?rgesen C, Dalgaard T, Larsen S E, B?gestrand J, Blicher-Mathiasen G. Effects of policy measures implemented in Denmark on nitrogen pollution of the aquatic environment. Environmental Science & Policy, 2008, 11(2): 144- 152.
[68] Panagopoulos Y, Makropoulos C, Mimikou M. Decision support for diffuse pollution management. Environmental Modelling & Software, 2012, 30: 57- 70.
參考文獻:
[1] 王曉燕. 非點源污染過程機理與控制管理——以北京密云水庫流域為例. 北京: 科學出版社, 2011.
[8] 孟凡德, 耿潤哲, 歐洋, 王曉燕. 最佳管理措施評估方法研究進展. 生態學報, 2013, 33(5): 1357- 66.
[27] 趙剛, 張天柱, 陳吉寧. 用AGNPS模型對農田侵蝕控制方案的模擬. 清華大學學報: 自然科學版, 2002, 42(5): 705- 707.
[29] 薛亦峰. 基于HSPF模型的潮河流域非點源污染模擬研究 [D]. 北京: 首都師范大學, 2009.
A review: model estimations on effectiveness of best management practices for agricultural non-point source pollution control
GENG Runzhe1, WANG Xiaoyan1,2,*,ZHAO Xuesong3,CHEN Yongjuan1
1CollegeofResources,Environment&Tourism,CapitalNormalUniversity,Beijing100048,China2ResearchCenterofAquaticEovironmentintheCapitalRegion,Beijing100048,China3BureauofStatisticsofFengningManchuAutonomousCounty,Fengning068350,China
With the development of point source pollution control, Agricultural Non-point Source Pollution (AGNPS) issues have become increasingly prominent worldwide. Non-point source pollution is difficult to control because it comes from the everyday activities of many different people, such as fertilizing a lawn, using a pesticide, or constructing a road or building. Recently, the agricultural non-point source pollution control has become a hotspot in the water research. As a common tool used to reduce non-point source pollution, Best management practices (BMPs) have been widely adopted to improve water quality problems associated with agricultural nonpoint source pollution, however, there have been few realistic efforts to assess their effectiveness in reducing AGNPS pollution. The effectiveness of BMPs must be evaluated at various spatial and temporal scales before adoption. Models are more comprehensive that can reflect choice of mitigation at a widely range of scales and then to achieve the best cost-effectiveness selection and placement of BMPs for non-point source pollution control. In this paper, we review some models used to assess the effectiveness of BMPs for agricultural non-point source pollution control, including non-structure practices and structure practices. The conceptual models mostly used to evaluate the impact of source control measures, while the physically-based models used to evaluate the BMPs that through control the timing and location, the response time and the transport and transformation of pollutants. The lag time between adoption of management changes and the detection of measurable improvement in water quality in the target water body are extremely important for the BMPs estimation as well as the model evaluation and validation. Models can be served as an effective tool to identify timing and critical non-point source pollution areas for target actions at different spatial scales. Other issues of critical importance include minimizing pollution swapping and assessing the cost-effectiveness of the measures within multi-objectives, as well as the acceptance of the these measures by the stakeholders involved before performing an integrated assessment of BMPs implementation. These issues are all relevant and challenging for the implementation of water and environmental policies. For future research, approaches to deal with the inevitable lag time between implementation of management practices and water quality response lies in appropriately characterizing the watershed, considering lag time in selection, location, and monitoring of management measures including the selection of appropriate indicators and designing an effective monitoring programs to detect water quality response. Understanding of NPS model uncertainty has become a front edge topic, and future studies should focus on improvement of parameter calibration, optimization of data acquisition solutions, and uncertainty analysis. Regarding to the timing and location of measures, pollution and ecosystem service swapping, and optimization and placement of BMPs in watershed, the integration of NPS models with 3S technology (GPS, RS, GIS) should be proposed. Stakeholders may play important role in developing the mitigation plan and enhancing the communication, reciprocal understanding, trust and acceptance of modelling results.
BMPs; effectiveness estimation; models; non-point source pollution
國家自然科學基金項目(40971258,41271495,41201534);高等學校博士學科點專項科研基金聯合資助項目(20121108110006)
2013- 12- 31;
2014- 06- 16
10.5846/stxb201312313081
*通訊作者Corresponding author.E-mail: cnuwxy@gmail.com
耿潤哲,王曉燕,趙雪松,陳永娟.基于模型的農業非點源污染最佳管理措施效率評估研究進展.生態學報,2014,34(22):6397- 6408.
Geng R Z, Wang X Y,Zhao X S,Chen Y J.A review: model estimations on effectiveness of best management practices for agricultural non-point source pollution control.Acta Ecologica Sinica,2014,34(22):6397- 6408.
猜你喜歡
童話王國·奇妙邏輯推理(2024年5期)2024-06-19 16:03:38
今日農業(2021年9期)2021-11-26 07:41:24
中學生數理化·七年級數學人教版(2020年10期)2020-11-26 08:24:50
數學物理學報(2020年2期)2020-06-02 11:29:24
中學生數理化(高中版.高考理化)(2020年3期)2020-05-30 12:26:24
當代陜西(2019年7期)2019-04-25 00:22:18
領導決策信息(2018年26期)2018-10-12 02:18:26
豬業科學(2018年4期)2018-05-19 02:04:38
廣東飼料(2016年5期)2016-12-01 03:43:23
光學精密工程(2016年6期)2016-11-07 09:07:19
