A fringe jump counting method for the phase measurement in the HCN laser interferometer on EAST and its FPGA-based implementation
2024-04-24 06:17:26YuanYAO姚遠YaoYANG楊曜AngTI提昂YangSONG宋揚JiaminZHANG張家敏YanWANG王琰YaoZHANG張耀HaiqingLIU劉海慶andYinxianJIE揭銀先
Plasma Science and Technology 2024年4期
Yuan YAO (姚遠),Yao YANG (楊曜),*,Ang TI (提昂),Yang SONG (宋揚),Jiamin ZHANG (張家敏),3,Yan WANG (王琰),Yao ZHANG (張耀),Haiqing LIU (劉海慶) and Yinxian JIE (揭銀先)
1 Institute of Plasma Physics,Chinese Academy of Sciences,Hefei 230031,People’s Republic of China
2 Anhui Electrical Engineering Professional Technique College,Hefei 230022,People’s Republic of China
3 Institutes of Physical Science and Information Technology,Anhui University,Hefei 230601,People’s Republic of China
Abstract Electron density in fusion plasma is usually diagnosed using laser-aided interferometers.The phase difference signal obtained after phase demodulation is wrapped,which is also called a fringe jump.A method has been developed to unwrap the phase difference signal in real time using FPGA,specifically designed to handle fringe jumps in the hydrogen cyanide (HCN) laser interferometer on the EAST superconducting tokamak.This method is designed for a phase demodulator using the fast Fourier transform (FFT) method at the front end.The method is better adapted for hardware implementation compared to complex mathematical analysis algorithms,such as field programmable gate array (FPGA).It has been applied to process the phase measurement results of the HCN laser interferometer on EAST in real time.Electron density results show good confidence in the fringe jump unwrapping method.Further possible application in other laser interferometers,such as the POlarimeter-INTerferometer (POINT)system on EAST tokamak is also discussed.
Keywords: electron density,laser-aided interferometer,fringe jump unwrapping,FPGA,EAST
1.Introduction
Electron density is a fundamental parameter for magnetically confined fusion plasma.Density control is essential to achieve plasma discharges in fusion devices,including tokamaks,stellarators and inertial-confinement fusion devices.Laser-aided interferometers have become increasingly popular as designated diagnostics for real-time density measurement and feedback control in recent years.In tokamaks,the modulated Mach–Zehnder interferometer is a standard approach to provide electron density [1–6].As a superconducting tokamak aiming to operate with long-pulse/steady state,the Experimental Advanced Superconducting Tokamak (EAST) needs real-time density control with a highspeed phase demodulation system in the interferometer system.Currently,a discrete component-based nuclear instrument module (NIM) is employed in the interferometer system on EAST [7],to demodulate the phase information while fringe counting is implemented with a CPU.With this module,there is a relatively high risk of the process being unmaintainable since there is a huge increase in system commissioning and debugging complexity.
In this study,a fringe counting method has been developed for the phase measurement with fringe jumps in the laser-aided interferometer on EAST.It is conducted by a phase jump determination process with a localized phase jump signal threshold definition.The algorithm is introduced in section 2.A dedicated phasemeter hardware has also been developed and implemented on EAST.The phasemeter was designed and based on the FPGA technique,described in section 3 .It has been contributing to real-time density control on EAST since 2021.The experimental results,presented in section 4,show the well-corrected phase jump signal and associated plasma density signal.In this section,some remaining issues with this method will also be discussed.The paper concludes with a summary in section 5.
2.Fringe jump and its correction method
2.1.Fringe jump in the HCN interferometer on EAST
Outputs from the detectors of the Mach–Zehnder interferometer are sinusoidal signals that carry the variation of optical path difference from the electron density.The probing signal(VP) and the reference signal (VF) can be represented as follows:
whereAis the amplitude of the signals,Δωis the modulated frequency of the interferometer,Pstands for the probing signal,whileFstands for the reference signal.After analogto-digital conversion,the two signals are represented as follows,after transformation of equations (1) and (2):
where φP(n) and φF(n) are the phases of the digitized probing and reference signals.
The fast Fourier transform is an efficient algorithm to obtain phase information using digital devices,such as a data acquisition system (DAQ) [8]. φncan be obtained by multiplyingPnandFnin the conjugate form after FFT,wherePnandFnare the maximum values in the FFT sequence.Afterwards,the digital phase difference θncan be calculated by equation (5) [9]:
A well-known problem with this method is the fringe jump that arises from the phase comparison technique,due to the arcus-tangent function (when the phase difference reaches π or -π).To obtain a valid and reliable electron density,the phase information with a fringe jump needs to be unwrapped [10–16].Accurate and real-time fringe counting method is essential for the plasma control system (PCS),especially for electron density feedback control.Therefore,many real-time methods for fringe counting have been implemented,such as the real-time phase jump process(RPJP) method used in the HL-2A tokamak [15],and a fringe projection measurement method based on dual variable-frequency coded patterns from Shandong University[16].These methods,based on mathematical analysis and precise transition point determination,have yielded excellent results in their respective devices or data processing.The advantage of the method proposed in this paper relies in its real-time capability and its ability to meet the requirements of feedback control during experiments.Moreover,it can be adapted to interferometer signals in the EAST discharge campaigns through rapid adjustment of thresholds and other parameters.
A simulation for the FFT-based phase calculation algorithm has been performed.Two sinusoidal waves are generated with MATLAB software.The parameters of the reference signal remain unchanged,while the frequency of the probing signal is shifted by a constant.This frequency shift generates a continuous and linear change in phase difference between the two sinusoidal signals.The phase difference of the two sinusoidal waves is shown below in figure 1.The results show highly reasonable linearity and accuracy,which means that the FFT-based algorithm works well for phase determination.
It can be seen from figure 1 that fringe jump occurs when the phase difference reaches up to π or down to -π,due to the value range of the arcus-tangent function.Fringe counting is a necessary step that must be implemented for realtime feedback and control.The second section of this paper presents an electronical hardware-based method to count the fringe,to meet the requirements of accuracy and real time.
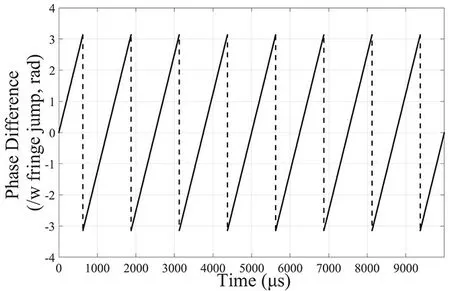
Figure 1.The diagram of the simulation results of the phase calculation algorithm.
An HCN laser-based interferometer,with a wavelength of 337μm and intermediate frequency at 10 kHz and 1 MHz after upgrade,provides the electron density measurement on EAST [6,7].In recent years,a digital phasemeter has been designed and employed to calculate the phase difference between the probing signal and reference signal [14].The phase difference calculation algorithm is mainly implemented via a Xilinx Kintex-7 FPGA inside a hardware system.The real-time phase signal with a fringe jump of shot#107095 discharge is shown in figure 2.As can be seen in figure 2,the phase changes back and forth from maximum to minimum near the jump point.Therefore,a fringe counting method is needed to unwrap the phase-difference information,after which the real-time electron density information could be recognized.
2.2.Fringe counting method
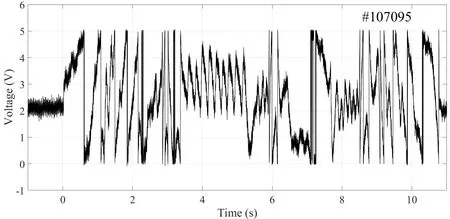
Figure 2.The diagram of the phase-difference (in volts) results from the HCN interferometer of shot #107095 discharge on EAST.
A flow chart of the fringe counting method is shown in figure 3 (the top half).There are two key parameters,one being the full amplitude (“FA” in the chart) whose voltage corresponds to 2 π (though there would be some slight deviations in practice),and the other being the noise threshold (“th”in the chart).O(i) stands for the original phase point (i.e.the phase with fringe jump) andL(i) stands for the line-integrated density (i.e.the total phase after fringe jump correction),which will then be output to PCS.
For each phase value,the difference between itself and the previous point is calculated.This difference needs to be repeatedly compared to the noise threshold (“th”) by adding integer multiples of the full amplitude (FA),as shown by the diamond tables in red in figure 3.The comparison process continues until the calculation result is smaller than the threshold.Then,the valueO(i)+N×FA will be output as the new density value,while the average value is used as the new output if none of the results meet the criteria,as shown in the bottom table in green in figure 3.It should be noted that “th” is an empirical value (typical value equal to 1 V for the HCN interferometer),related to the electronics of the detectors.The appropriate threshold can be confirmed after a few discharges to achieve the highest accuracy of fringe jump counting.Moreover,the number of comparisons depends on the magnitude of the density variation.For instance,20 jumps are sufficient for the upper density limit on EAST.In figure 3,multiple judgments stand for the comparison process from the 2nd comparison to the 19th one.
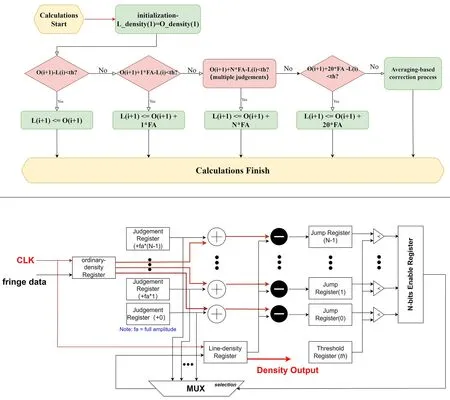
Figure 3.Flow chart detailing the implementation of the fringe jump correction method.
For the HCN interferometer on EAST,each jump represents an line-integrated density change of approximately 0.62×10¹⁹m-2,while considering the density upper limit (above 1020m-2) of the EAST device.The use of 20 multiplexers(MUXs) can completely cover the range of possible densities.
2.3.Algorithm implementation in FPGA
Field programmable gate arrays (FPGAs) are semiconductor devices that are based on a matrix of configurable logic blocks connected via programmable interconnects.FPGAs can be reprogrammed to the dedicated application or functionality requirements after manufacturing.They are suitable as a carrier of consequent algorithms.Part of the FFTbased study has been reported in [14] and the fringe counting algorithm is also well implemented in the FPGA.What needs to be pointed out is that the interpolation method is employed to lower the latency because the FFT part will significantly increase the time for calculation.On the other hand,the FFT-based algorithm,using 1024 points as the time window with a sampling rate of 62 MS/s,will greatly reduce the amount of processing data,which means that there is no need for external storage.The FPGA structure is shown in the lower part of figure 3.Accumulative data and phase difference are stored through registers and a MUX is used to select the formula that satisfies the condition.This logic has been implemented in a Kintex-7 FPGA and has been used to process the output of the HCN interferometer on EAST.
The system hardware is presented in figure 4,which includes one trigger input,five probing channels,one reference channel and the corresponding five line-integral density outputs.The structure diagram of the system employed in the diagnostics system is shown in the upper part of figure 4.As shown in the diagram,after the detection signal and reference signal output from the detector,the signal enters the FPGA by the conditioning circuit and analog-to-digital converters (ADCs) with high quality.After receiving the trigger signal,phase analysis is performed to obtain the wrapped phase information,which is then sent to the unwrapping module.Finally,it is converted into an analog signal and sent to the plasma control system (PCS).
3.Results and discussion
3.1.Correct unwrapping algorithm implementation
Using the real-time unwrapping algorithm described in section 2 with suitable voltage coefficients,the line-integrated electron density information can be obtained,as shown in the figure 5 below.As can be seen in the upper part of the figure,the algorithm identifies 11 valid upward flips(green circles) and 11 valid downward flips (red crosses),respectively.The upward and downward jumps in the wrapped signal are 11 and 11,respectively.
The statistical analysis for the wrapped signal is shown in table 1.The jumps caused by rising and falling densities are counted separately.That is,seven effective flips were identified from 152 flips caused by rising density,and seven effective flips were identified from 147 flips caused by falling density.Due to the signal noise,the maximum value of the voltage difference (ΔVd) will be very close to the threshold value,but it can be confirmed from the final density output results that the parameters are valid.
3.2.Incorrect unwrapping situation
For shot #105851,only one noise of original wrapped signal is generated on the wrapped signal at 14 s due to the impact on the optical path at the end of the discharge,because of rapid changes in current,magnetic field or other factors.When an inappropriate threshold is defined,multiple and diverse errors occur in the unwrapped density signal,as shown in figure 6.
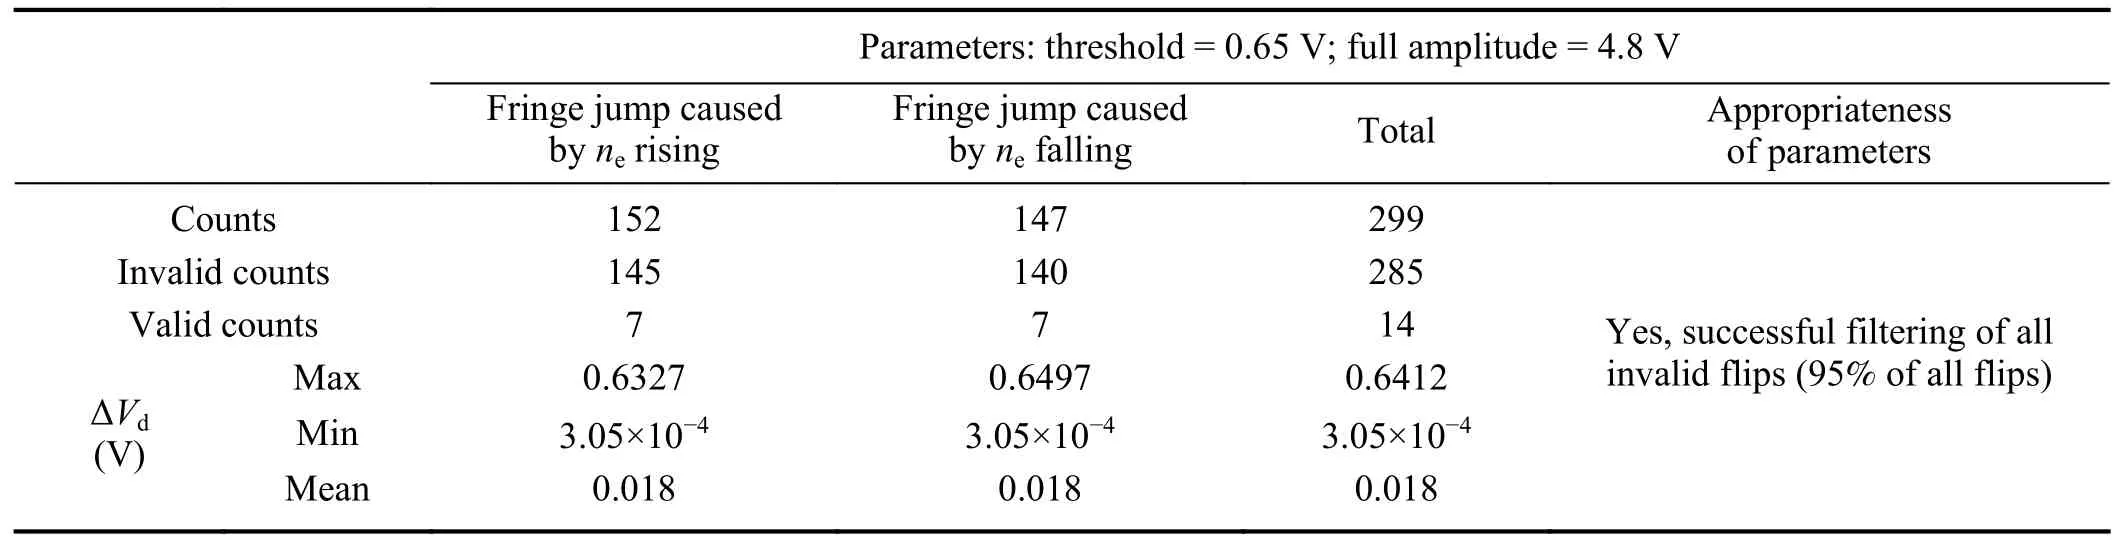
Table 1.Statistics of the validity of the fringe jump correction method for shot #107095.
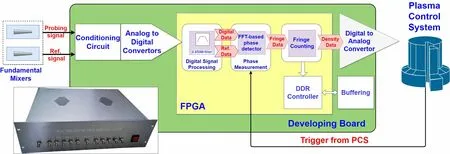
Figure 4.Structure of the electronics system with the fringe counting method in between the detectors and the PCS system.
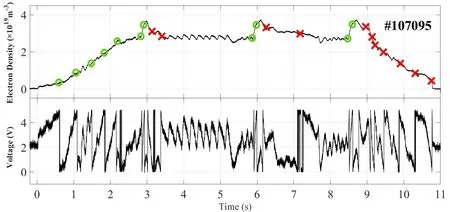
Figure 5.Electron density output after fringe counting of shot#107095 discharge on EAST.
It can be observed that during the initial phase of discharge,the noise,being outside the threshold detection range,forces the system to replace the true value with an average value.On the other hand,in the latter half of the discharge period,due to a decrease in the signal-to-noise ratio of the original enveloped signal,a noticeable enhancement of noise is observed in the unwrapped results as well.Finally,due to an erroneous determination of the inflection point,the final density is rendered meaningless with negative values.
Specific analysis for the wrapped signal of shot #105851 is shown in table 2.It is shown that three effective flips were selected from 71 flips caused by rising density and two effective flips were selected from 72 flips caused by falling density.
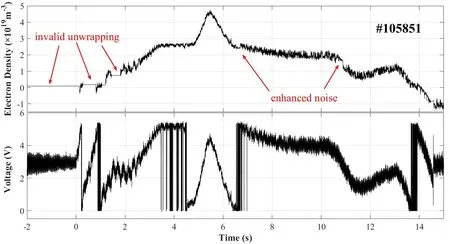
Figure 6.Electron density after fringe jump counting of shot#105851 discharge on EAST.
4.Discussion
In general,as shown in figure 5,the logic implemented in FPGA can count the fringe jumps of the HCN laser interferometer on EAST.If the threshold is set properly (in our system the threshold is 0.8–1.0 V),the vague part of the phase information in figure 5,and even in figure 6,can be eliminated.A good plasma density signal can be produced and implemented to the PCS system.The fringe jump correction method (algorithm+FPGA hardware) has been applied on EAST tokamak since 2021.In a recent statistical analysis,the rate of success of this method is 99.9%.The accuracy of fringe jump is of great importance for future fusion devices,when real-time density control is required in a long-pulse/steady-state operation scenario.
The quality of the phase difference signal from the detector strongly influences the fringe counting method.In section 4.2,a major reason for the failure of this method is presented.As mentioned in section 2,the threshold value is empirical and is closely linked to the signal from the detector.Setting an excessively high threshold can result in the ingress of significant noise into the processing system,whereas an excessively low threshold may lead to the inability to identify suitable intervals for the averaging processing,thereby potentially introducing calculation errors in the overall electron density.A calibration is needed between campaigns or when the detector is replaced.Another possible failure mechanism is that due to the rapid change of density,the interferometer cannot respond in real time,which can be called a fringe jump error.For instance,in figure 6,during a rapid density change before disruption,the rapid variations in the phase difference signal itself result inthe loss of density information,rendering subsequent processing steps completely ineffective.This means that the original sine wave signals can no longer provide the changes in plasma density.Consequently,we cannot obtain any meaningful density data by adjusting the threshold or full amplitude value parameters.In general,the quality of the wrapped signal is an important parameter for the proper operation of the unwrapped algorithm.Further detailed studies on the interaction between the signal from the detector and the phase correction method are in progress.
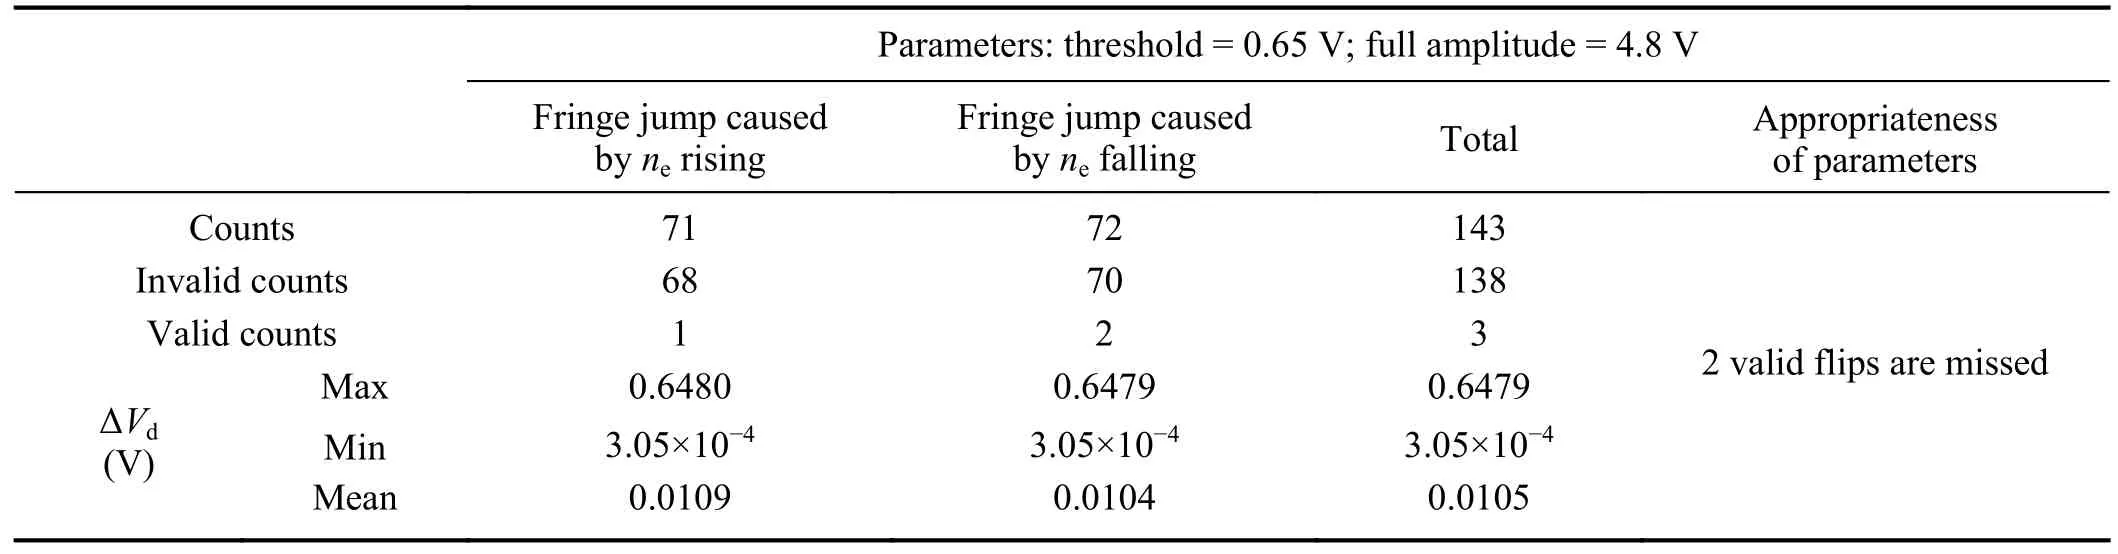
Table 2.Statistics of the validity of the fringe jump correction method for shot #105851.
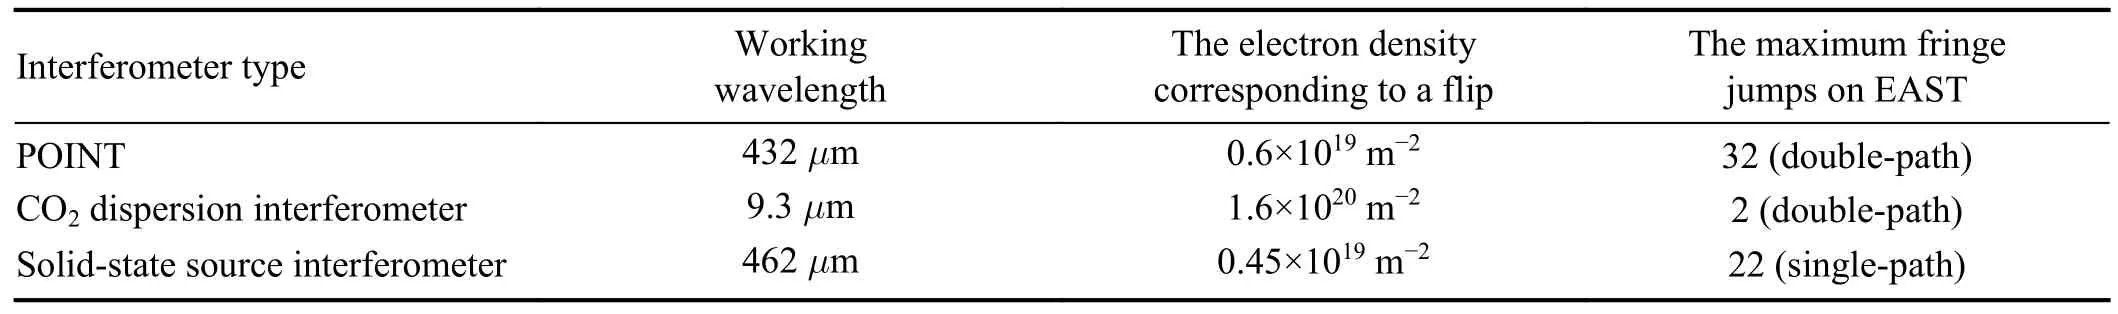
Table 3.Relationships between a single fringe jump and the working wavelength of the interferometers on the EAST facility.
On the other hand,time response is a fundamental requirement for plasma feedback control with PCS.The time consumption caused by the correction method mainly depends on the system clock.The implementation of the method is in the order of magnitude of hundreds of MHz,which can completely meet the millisecond level of PCS.For all the interferometers on EAST,there exists at least one fringe jump situation in principle because the initial phase could be near a jump point.Specifically,all the interferometers currently used on EAST are listed in table 3.It can be observed that the number of jumps is inversely proportional to the working wavelength.For devices that can operate at higher densities in the future,effectively addressing the flipping issue in interferometers is crucial to ensure accurate density measurements.
5.Conclusion
In summary,an FPGA-based fringe jump method has been implemented and tested on the HCN laser interferometer on EAST tokamak.The appropriate threshold has been determined for the wrapped signal of a certain signal-to-noise ratio in near discharge campaigns.The algorithm selected is relatively simple to implement and therefore can satisfy the requirement of real time feedback control.The importance of the phase difference signal from the detector has been discussed.Considering that all interferometers have the problem of signal wrapping,this study can be extended to other interferometers (such as POINT,solid-state source interferometer and even dispersion interferometer) on EAST and other fusion devices in the future.
Acknowledgments
This study was funded and supported by the Comprehensive Research Facility for Fusion Technology Program of China(No.2018-000052-73-01-001228),the HFIPS Director’s Fund (No. YZJJKX202301),Anhui Provincial Major Science and Technology Project (No.2023z020004) and Task JB22001 from the Anhui Provincial Department of Economic and Information Technology.
 Plasma Science and Technology2024年4期
- Plasma Science and Technology的其它文章
- Experimental results of a magnetic field modification to the radio frequency driver of a negative ion source
- Simulation of liquid cone formation on the tip apex of indium field emission electric propulsion thrusters
- Novel method for identifying the stages of discharge underwater based on impedance change characteristic
- Performance of pulsed plasma thruster at low discharge energy
- Dynamic propagation velocity of a positive streamer in a 3 m air gap under lightning impulse voltage
- On the evolution and formation of discharge morphology in pulsed dielectric barrier discharge