Development of a toroidal soft x-ray imaging system and application for investigating three-dimensional plasma on J-TEXT
2024-04-06 07:16:06ChuanxuZHAO趙傳旭JianchaoLI李建超XiaoqingZHANG張曉卿NengchaoWANG王能超YonghuaDING丁永華ZhoujunYANG楊州軍ZhongheJIANG江中和WeiYAN嚴偉YangboLI李楊波FeiyueMAO毛飛越ZhengkangREN任正康andtheTEXTTeam
Plasma Science and Technology 2024年3期
Chuanxu ZHAO (趙傳旭) ,Jianchao LI (李建超) ,Xiaoqing ZHANG (張曉卿) ,Nengchao WANG (王能超) ,Yonghua DING (丁永華) ,Zhoujun YANG (楊州軍) ,Zhonghe JIANG (江中和),Wei YAN (嚴偉),Yangbo LI (李楊波),Feiyue MAO (毛飛越),Zhengkang REN (任正康) and the J-TEXT Team,
1 International Joint Research Laboratory of Magnetic Confinement Fusion and Plasma Physics,State Key Laboratory of Advanced Electromagnetic Engineering and Technology,School of Electrical and Electronic Engineering and School of Physics,Huazhong University of Science and Technology,Wuhan 430074,People’s Republic of China
2 Hubei Key Laboratory of Optical Information and Pattern Recognition,Wuhan Institute of Technology,Wuhan 430205,People’s Republic of China
3 International Joint Research Laboratory of Magnetic Confinement Fusion and Plasma Physics,State Key Laboratory of Advanced Electromagnetic Engineering and Technology,School of Electrical and Electronic Engineering,Huazhong University of Science and Technology,Wuhan 430074,People’s Republic of China
Abstract A toroidal soft x-ray imaging (T-SXRI) system has been developed to investigate threedimensional (3D) plasma physics on J-TEXT.This T-SXRI system consists of three sets of SXR arrays.Two sets are newly developed and located on the vacuum chamber wall at toroidal positions ? of 126.4 ° and 272.6°,respectively,while one set was established previously at ?=65.5°.Each set of SXR arrays consists of three arrays viewing the plasma poloidally,and hence can be used separately to obtain SXR images via the tomographic method.The sawtooth precursor oscillations are measured by T-SXRI,and the corresponding images of perturbative SXR signals are successfully reconstructed at these three toroidal positions,hence providing measurement of the 3D structure of precursor oscillations.The observed 3D structure is consistent with the helical structure of the m/n=1/1 mode.The experimental observation confirms that the T-SXRI system is able to observe 3D structures in the J-TEXT plasma.
Keywords: SXR imaging,J-TEXT tokamak,three-dimensional measurement,MHD
1.Introduction
The soft x-ray (SXR) diagnostic system has been widely used in magnetic confinement fusion devices to reconstruct the two-dimensional (2D) SXR emission distribution for the investigation of plasma shape [1],magnetohydrodynamic(MHD) activities [2-5],impurity transport [6,7] and so on.For a toroidally symmetric tokamak plasma,several poloidal SXR arrays at certain toroidal locations are sufficient for tomography [8-10].However,when MHD activities occur in plasma,the plasma structure and the distribution of physical parameters are three-dimensional (3D).In this case,it is necessary to develop toroidally distributed SXR arrays to meet the needs of measuring 3D structure in plasma.
Toroidal SXR arrays have been equipped on JET [6],AUG [11],DIII-D [12] and EAST [13],and these toroidal SXR arrays consist of multiple arrays,each of which is located at a separated toroidal position,to measure impurity distribution or to determine the toroidal mode number of MHD behaviors.
On J-TEXT,a poloidal SXR diagnostic system has been utilized to observe MHD activities [14] when applying external resonant magnetic perturbations [15-23].Nevertheless,the toroidally asymmetrical plasma shape and MHD activities have 3D structures,and these structures can hardly be observed and reconstructed by just a single array at each toroidal position or multiple arrays at a single toroidal position.Hence,it is necessary to develop toroidally distributed SXR arrays including multiple arrays at each toroidal position to observe the 3D structures.
A toroidal soft x-ray imaging (T-SXRI) system has been developed on J-TEXT.The design of the diagnostic details is introduced in section 2 .The T-SXRI system has been applied to measure 3D MHD structures,as introduced in section 3.Finally,a discussion and summary are presented in section 4.
2.Design of the T-SXRI system
2.1.Physical parameter design
The T-SXRI system was developed to observe 3D structures in the J-TEXT plasma.The J-TEXT tokamak [24-26]is a medium-sized tokamak with a major radiusR=1.05 m and a minor radiusa=0.22-0.29 m and has a movable limiter.Its typical operating parameters are plasma currentIp~200 kA,toroidal on-axis magnetic fieldBT~2.0 T,core electron temperatureTe0~1 keV in an ohmically heated plasma and core line-averaged electron densityne0=(1-7) × 1019m-3.
For typical plasma parameters,the emitted SXRs are in the photon energy range of 0.3-6 keV within the normalized radial position ofr/a~ 0.8 in pure hydrogen plasma,and the MHD activities in J-TEXT,such as sawtooth,internal kink mode and tearing mode,have a frequency range from hundreds to tens of thousands of hertz and a perturbed radial width of several centimeters,and commonly emerge within the plasma regionr/a<0.8.
Considering a toroidal mode number resolution ofn=2 and installation in the vacuum vessel,the T-SXRI system is composed of three groups of SXR arrays located at ?=65.5°,?=126.4 ° and ?=272.6°,respectively,as shown in figure 1.Each group consists of three arrays viewing the plasma poloidally,with a poloidal mode number resolution ofm=2.These three arrays of the group at ?=272.6° are named SXG,SXH and SXI,with poloidal angles of 45°,-45° and-135°,respectively.The group at ?=126.4° contains three arrays named SXJ,SXK and SXL with poloidal angles of 45°,-45° and -90°,respectively.The three arrays of the group at ?=65.5° are named SXA,SXB and SXC with poloidal angles of 90°,12° and -78°,respectively;they have been previously established and described in detail in reference [14].
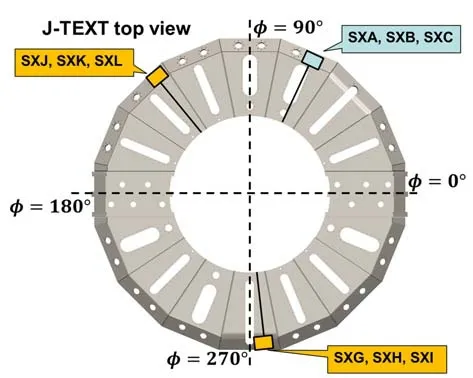
Figure 1.Schematic view of the toroidal locations of the T-SXRI system.
Each SXR array consists of a 35-channel photodiode linear array (Hamamatsu S4114-35N) with an active area of 0.9 mm × 4.4 mm,and the detector is placed behind an aperture covered with 7.6μm thick beryllium foil,which filters out photons emitted from the plasma with energies below roughly 500 eV.For engineering reasons to do with installation,only 26 intellectual channels of each detector are used.These channels can cover the plasma region from sight lines withinr/a≤ 0.82 (a=25.5 cm),where those MHD activities emerge,leading to a radial resolution of about 1.6 cm.Figure 2(a) displays the poloidal locations of the six arrays of the two new SXRI groups and the sight lines of the SXG(SXJ) and SXH (SXK) elements.These chord parameters can be displayed in (p,α) space as shown in figure 2(b),wherepis the distance from the geometric center of the vacuum chamber to the line of sight and α is the chord impact angle.
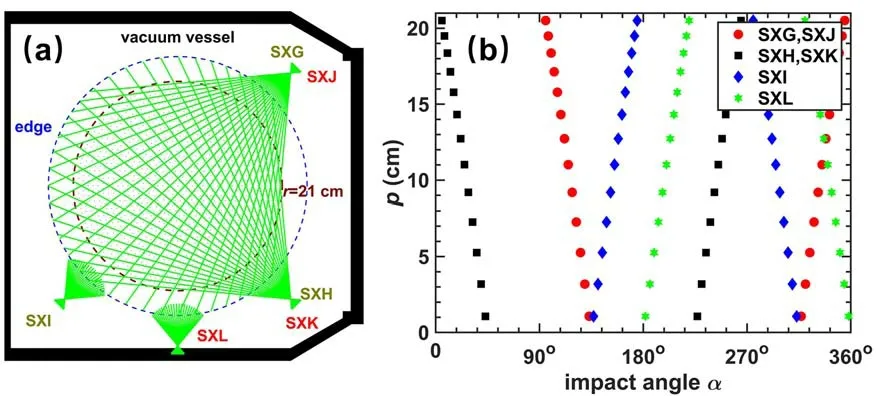
Figure 2.(a) Layout of the arrays.(b) Chord parameters of each array.
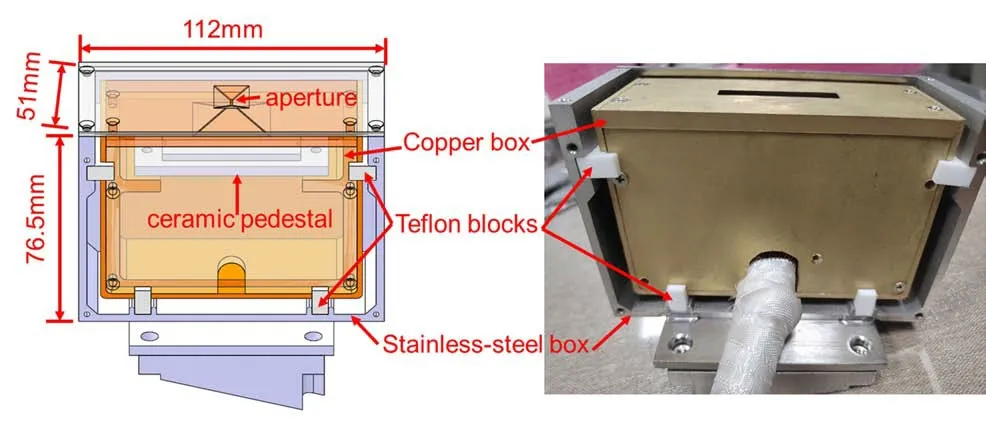
Figure 3.Engineering concept drawing of the module (left) and physical photo (right).
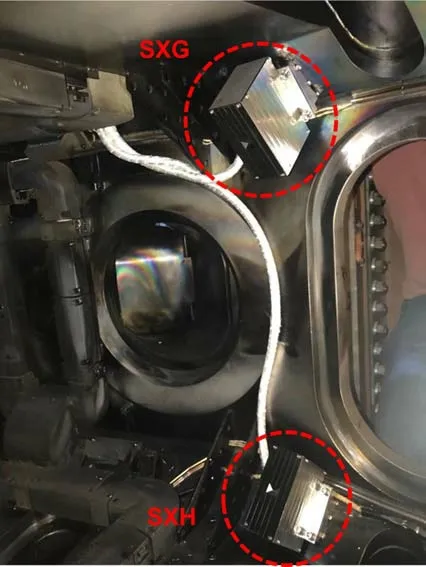
Figure 4.Photo of settled array SXG and array SXH at ?=272.6°.
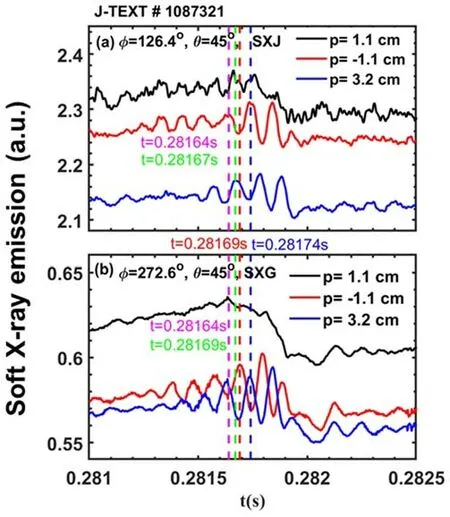
Figure 5.Raw signal waveforms of sawtooth instability measured by the T-SXRI array at toroidal angles of (a) ?=126.4° (SXJ) and(b) ?=272.6° (SXG) in a J-TEXT ohmic plasma.The time points t=0.28164 s,t=0.28167 s,t=0.28169 s and t=0.28174 s during an oscillation period are marked with dashed magenta,green,red and blue lines,respectively.The minus sign of the chord radius denotes that this line of sight is on the upper side of the high field.
In conclusion,the T-SXRI system can depict the evolution of 3D structures in the J-TEXT plasma,specifically plasma shape and MHD activities with a low mode number(m,n≤ 2) and radial scale lengths larger than 2 cm.
2.2.Engineering design
The T-SXRI system employs a modular detector box with a double-layer structure and a size of 76.5 mm × 112 mm ×51 mm,as shown in figure 3.An outer 3 mm thick stainlesssteel layer is mounted on the wall of the inner vacuum chamber,for both support and stability.The aperture in the stainless-steel box has the same size as that of the detector element,which can reduce the background noise [27].Considering the role of aperture and the low reflectivity of SXRs,the reflected photons from the opposite side of each of the 35-channel arrays can be ignored,and the inner layer is a 5 mm thick copper box for electromagnetic screen.These two layers are electrically insulated with Teflon blocks.The detector is mounted on a ceramic pedestal fixed in the copper box.The entire electronics system is electrically insulated with the vacuum chamber to further reduce electromagnetic interference.
The T-SXRI system employs amplifiers with a bandwidth of 100 kHz and three different gain factors of 200,500 and 1000 kV A-1,respectively.The signal is generated by the detector and transmitted through the electrical feedthroughs via a copper-shielded twisted-pair cable,then to the data acquisition (DAQ) system with a sampling rate of 500 kHz and a full-scale input range of ±10 V.The amplifiers and DAQ system are housed in metal cabinets,located outside the vacuum chamber,to avoid the impact of complex electromagnetic environments.The temporal resolution of the system is up to 10μs due to the limited bandwidth of the amplifier.
The T-SXRI system was successfully installed and two arrays in the system are displayed in figure 4.The signals are obtained with a high signal-to-noise ratio.In most situations,the background noise is less than 40 mV,while a typical SXR signal is at the level of around 2 V.Therefore,the TSXRI electronics system has a good performance and can meet the observational needs for future physics experiments.
3.Application of T-SXRI system for observing the 3D MHD structure
3.1.SXR tomography on J-TEXT
The signals detected by SXR arrays are chord-integrated SXR emissions,and hence tomography is needed to obtain the local SXR emissions.The chord-integrated ‘brightness’can be expressed by [9,28]
wherepand α are the chord radius and azimuth angle andg(r,θ)is local SXR emissivity.
There are two basic classes of methods to getg(r,θ)fromf(p,α) [28 ].The first is based on finite-element approaches,which divide the emitting region into a number of finite ‘pixels’ within which the emissivity is assumed to be constant,such as maximum entropy reconstruction [29],the minimum Fisher regularization method [30,31 ] and maximum likelihood expectation maximization [32,33].The second is based on analytic solutions,which expand the local SXR emissivity function using orthogonal complete polynomials and then fit the experimental data to obtain the polynomial coefficients,for example the Cormack method [34] and the Fourier-Bessel method [14,35].
The tomography method for SXR on J-TEXT employs the Fourier-Bessel method.In this method,g(r,θ) is expanded by Fourier series poloidally and Bessel series radially as
whereJm,l(r/λl+1) is themth-order Bessel function,λl+1is thelth zero point andam,l,bm,lare polynomial coefficients.Hence,each chord-integrated brightnessf(p,α) can be written as
Seventy-eight SXR channels on J-TEXT provide a set of equations similar to equation (3).To solve this equation set,the number of expansion coefficients,K=(2mmax+1)×(lmax+1),must be less than the number of chord measurements.
On J-TEXT,withmmax=2 andlmax=6,the 35 unknown coefficients can be obtained by the least-squares method,and finally the local emissivityg(r,θ) can be derived from equation (2).
3.2.Observation of precursor oscillations of sawteeth
The T-SXRI system has been applied to observe MHD activities in a typical discharge with a minor radius of 22 cm,a plasma current of 130 kA,a toroidal magnetic field of 2.2 T and a line-averaged electron density of 3×10¹⁹m-3.In this discharge,sawtooth oscillations occur spontaneously and the inversed radiusrinvis 3 cm.
The precursor oscillations of a sawtooth crash are clearly observed by the T-SXRI system.The SXR signals from the central chords of SXJ and SXG,i.e.from different toroidal locations,are shown in figures 5(a) and (b),respectively.The minus sign for the chord radius denotes that this line of sight is on the upper side of the high field,as shown in figures 6(b) and (c) with solid lines of the corresponding colors.In figure 5(a) the rotating precursor mode grows for several periods until the sawtooth crash,and the precursor oscillations measured on both sides of the magnetic axis (the red and blue solid lines) have opposite phases,indicating an odd poloidal mode number.SXJ and SXG measure sawtooth precursors at the same poloidal angle but different toroidal positions,hence providing a direct reflection of the toroidal symmetry of the sawtooth precursors.By comparing the signals at four time points (vertical dashed lines at 0.28164 s,0.28167 s,0.28169 s and 0.28174 s) within one oscillation period in figures 5(a) and (b),the toroidal phase difference in the range of 90°-180° can be observed.These observations indicate that the sawtooth precursors are asymmetric both poloidally and toroidally,i.e.they have a 3D structure.To further reveal their 3D structure,the SXR tomography method is utilized to reconstruct SXR emission profiles with total SXR arrays.
The perturbative SXR signals of precursor oscillations can be extracted using the singular value decomposition method [36,37] and inversed into a 2D emission distribution by the Fourier-Bessel method,depicting the evolution of these oscillations.Figure 6 shows the reconstructed SXR emission distribution at three different toroidal locations for four time points as marked in figure 5.As expected,them=1 mode is observed from all three toroidal locations.The reconstructed images of each column (with the same toroidal position) show a clockwise rotatingm=1 mode,and the rotational direction of the mode is marked by a blue arrow in figure 6(a).
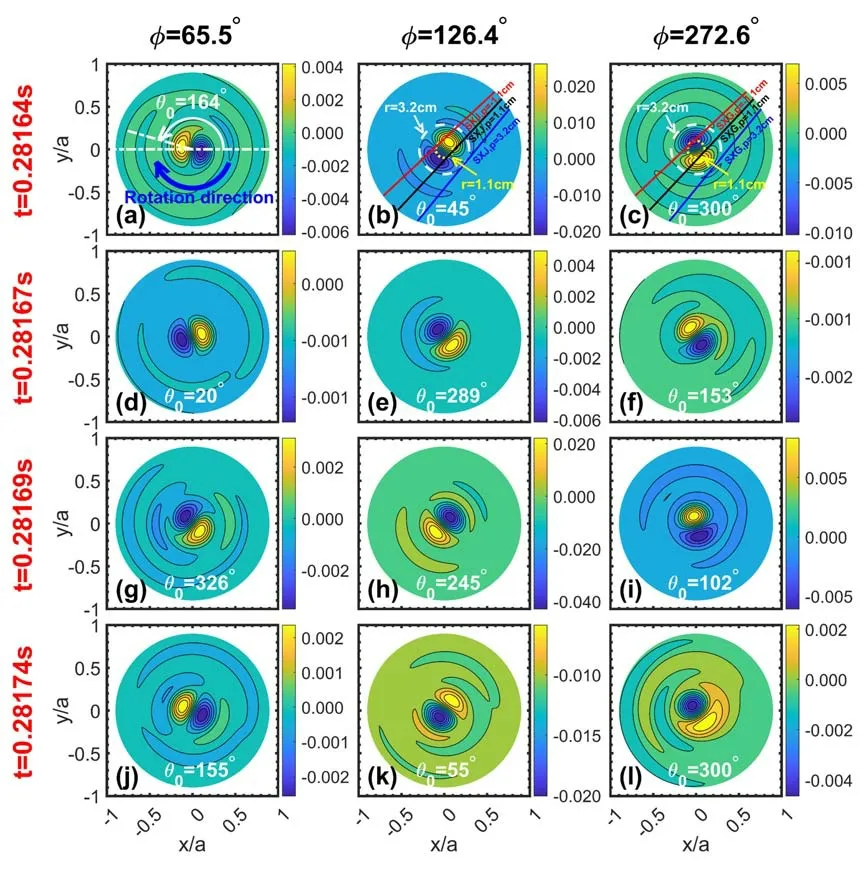
Figure 6.Reconstruction of sawtooth precursor oscillations in J-TEXT discharge #1087321.Four rows of images correspond to time points t=0.28164 s,0.28167 s,0.28169 s and 0.28174 s.The three columns of images correspond to toroidal locations ?=65.5 °,126.4°and 272.6 °.The white arrow points at the poloidal angle θ and the blue one points at the rotation direction of this mode.θ0 denotes the poloidal location of this mode.The red,black and blue solid lines show the chords at p=-1.1 cm,1.1 cm and 3.2 cm,respectively,corresponding to those in figure 5.
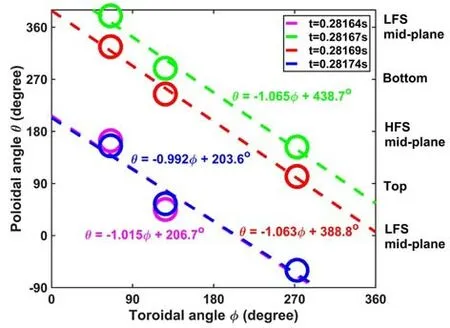
Figure 7.The poloidal location θ0 and the corresponding ? of sawtooth precursor oscillations.The magenta,green,red and blue circles represent the positions of this 1/1 mode reconstructed at t=0.28164 s,0.28167 s,0.28169 s and 0.28174 s,respectively.The linear fittings between poloidal and toroidal positions at four time points are shown by dashed lines.
The low-field side mid-plane is selected as the zero of the poloidal angleθand the anticlockwise direction as the positive direction ofθ,as indicated in figure 6(a) with white arrow.The poloidal location of them=1 mode,θ0,is defined by the peak of perturbed SXR intensity.At four fixed time points (corresponding to the marked time in figure 5),them=1 mode lies different poloidal positions for toroidal locations ?=65.5 °,126.4 ° and 272.6°,respectively.The relationships between θ0and the corresponding ? are shown in figure 7 .All four fitting curves provide θ=C?+constant(dashed line) with related coefficientsR2>0.99,where the values ofCare very close to -1,indicating that the toroidal moden=m=1.The confirmation of the helical 3D structure of them/n=1/1 mode is coincident with general understanding of the sawtooth precursor mode.
Therefore,the T-SXRI system on J-TEXT is able to measure the 3D structure of the plasma,being beneficial to 3D physics research.
4.Discussion and summary
A T-SXRI system has been designed and constructed to measure 3D structures for 3D plasma physics research on JTEXT.The system consists of 3×3 arrays at different poloidal and toroidal locations with a mode number resolution ofm,n=2,a radial resolution of 1.6 cm and a temporal resolution of 10μs.This system is available to measure the SXR emission distribution for observations of MHD activities.Combined with the Fourier-Bessel method for reconstructing emission profiles,the T-SXRI system can provide 3D structures such as the precursorm/n=1/1 mode,verifying the ability to observe toroidally asymmetric SXR emission.
In the future,the T-SXRI system will be further utilized to measure other MHD activities in the plasma core,such as them/n=2/2 mode,sawtooth crashes and 3D impurity distribution.In addition,T-SXRI tomography can provide 2D distributions of SXR emission at different toroidal positions.This capability might be used to study the 3D magnetic field configuration [17] in the future.
Acknowledgments
This work is supported by the National Magnetic Confinement Fusion Energy R&D Program of China (Nos.2018YFE0309100 and 2019YFE03010004) and National Natural Science Foundation of China (No.51821005).
 Plasma Science and Technology2024年3期
- Plasma Science and Technology的其它文章
- An improved TDE technique for derivation of 2D turbulence structures based on GPI data in toroidal plasma
- Inward particle transport driven by biased endplate in a cylindrical magnetized plasma
- Progress of Lyman-alpha-based beam emission spectroscopy (LyBES) diagnostic on the HL-2A tokamak
- Forward modelling of the Cotton-Mouton effect polarimetry on EAST tokamak
- Electron density measurement by the three boundary channels of HCOOH laser interferometer on the HL-3 tokamak
- Reconstruction of poloidal magnetic field profiles in field-reversed configurations with machine learning in laser-driven ion-beam trace probe