Improvement of energy resolution of x-ray transition-edge sensor using K-means algorithm and Wiener filter
2023-11-02 08:12:52QingxiaoMa馬卿效WenZhang張文PeizhanLi李佩展ZhengWang王爭ZhifaFeng馮志發(fā)XinkaiYang楊心開JiaqiangZhong鐘家強(qiáng)WeiMiao繆巍YuanRen任遠(yuǎn)JingLi李婧andShengcaiShi史生才
Chinese Physics B 2023年10期
Qingxiao Ma(馬卿效), Wen Zhang(張文), Peizhan Li(李佩展), Zheng Wang(王爭),Zhifa Feng(馮志發(fā)), Xinkai Yang(楊心開), Jiaqiang Zhong(鐘家強(qiáng)), Wei Miao(繆巍),Yuan Ren(任遠(yuǎn)), Jing Li(李婧), and Shengcai Shi(史生才)
1Purple Mountain Observatory,Chinese Academic of Sciences,Nanjing 210023,China
2College of Astronomy and Space Science,University of Science and Technology of China,Hefei 230026,China
Keywords: transition-edge sensors,energy resolution,K-means clustering,Wiener filter
1.Introduction
Superconducting transition-edge sensors (TESs) are extremely sensitive thermal detectors because of their sharp superconducting-to-normal transition, which can be used to detect photons from millimeter, near infrared through x-rays andγ-rays.[1]Large-format TES arrays with higher energy resolution (ΔE) are widely used in the fields of astrophysics and particle physics.For example, Athena x-ray observatory proposed by ESA is planned to launch in the 2030s.The x-ray integral field unit (X-IFU) on board of Athena is a cryogenic imaging spectrometer based on several thousands of TESs with ΔEbetter than 2.5 eV for photon energies up to 7 keV.[2]Ti/Au bilayer TES microcalorimeter exhibits a ΔEof 2.0 eV@5.9 keV.[3]By reducing critical temperature (TC) and pixel size, the best ΔEobtained up to date is 1.56 eV@5.9 keV.[4]A new process is developed to fabricate Mo/Cu bilayer TESs by breaking vacuum and introducing a patterning step between the deposition of the superconductor and normal metal layers, which can tuneTCacross a broad range.[5]TES fabrication process can be simplified by integrating the sensor patterning with the deposition of Mo/Au/Au trilayer films, and ΔEof 6.66 eV@5.9 keV is reported.[6]A 4×4 Mo/Cu TES array integrated with a 2.4-μm-thick bismuth absorber has been developed for the free-electron laser facility around ShanghaiTech University,which shows a quantum efficiency of 70% and ΔEof 5.2 eV at 5.9 keV.[7]In addition, the data acquisition and processing are also crucial for obtaining better ΔE.[8]During the experiment,some false traces are recorded due to interferences, SQUID flux jump,heat sink temperature drift,high energy particle,etc.,therefore it is necessary to discriminate them from the correct traces.
We have developed optical/near infrared superconducting single-photon detectors based on titanium TES,[9]whose system quantum detection efficiency is as high as 90%at telecommunication band.We further fabricate x-ray Ti/Au TES and deposit an Au absorber on the center of TES by electron-beam evaporation.Note that for the first step the silicon substrate underneath the TES sensor has not been etched.We propose to classify the recorded pulse traces into several clusters with K-means clustering algorithm,among which the correct traces are selected for the following processing.Then the baseline is corrected,followed by Wiener filtering to improve the signalto-noise ratio, thus ΔE.As a concept of proof, we found that the ΔEof the Ti/Au TES without deep reactive ion etching (DRIE) is improved to 44 eV from its original 94 eV at 5.9 keV.
2.Transition edge sensor and measurement setup
Superconducting Ti (35 nm)/Au(50 nm) bilayer is deposited on the silicon substrate coated with a thin layer SiOxusing electron-beam evaporation in an ultrahigh vacuum environment.[10]The active area ranging from 50×50μm2to 200×200μm2is formed with lift-off process.A typical TES is shown in Fig.1(a), the Ti/Au sensor is 50 μm square, and a 1.1-μm-thick gold layer with dimensions of 30×40 μm2is directly deposited on the Ti/Au sensor as the absorber.[11]Contact pads and wires are formed from a 150-nm-thick Nb film,whose critical temperature is 9.2 K,acting as Andreev reflection to prevent the relaxation of thermal energy.Note that the silicon substrate is not removed by DRIE and the electronphonon interaction is the dominant energy relaxation mechanism.As shown in Fig.1(b), the Ti/Au TES and SQUID array are mounted in a cooper block,and the TES is connected to the input inductance of the SQUID array with a current noise of 7 pA·Hz-1/2.[12]X-ray from a55Fe source in a Pb box is incident on the TES through a 0.5 mm hole.55Fe nucleus becomes55Mn and emits an x-ray photon.The emitted x-rays are 90%55MnKα(5.9 keV) and 10%55MnKβ(6.5 keV).[13]As shown in Fig.1(c), the TES block is then anchored to the FAA stage of an adiabatic demagnetization refrigerator (ADR), whose base temperature is about 50 mK.Figure 1(d) shows the schematic diagram of the readout circuit, whereRPARis the parasitic resistance andIBIASis the bias current.A shunt resistor (RSH) of 1.2 mΩ integrated in the SQUID chip provides voltage bias to the TES.The induced pulse response is recorded by a Keysight Infiniium S-series oscilloscope with the data sampling rate of 125 Ms/s.
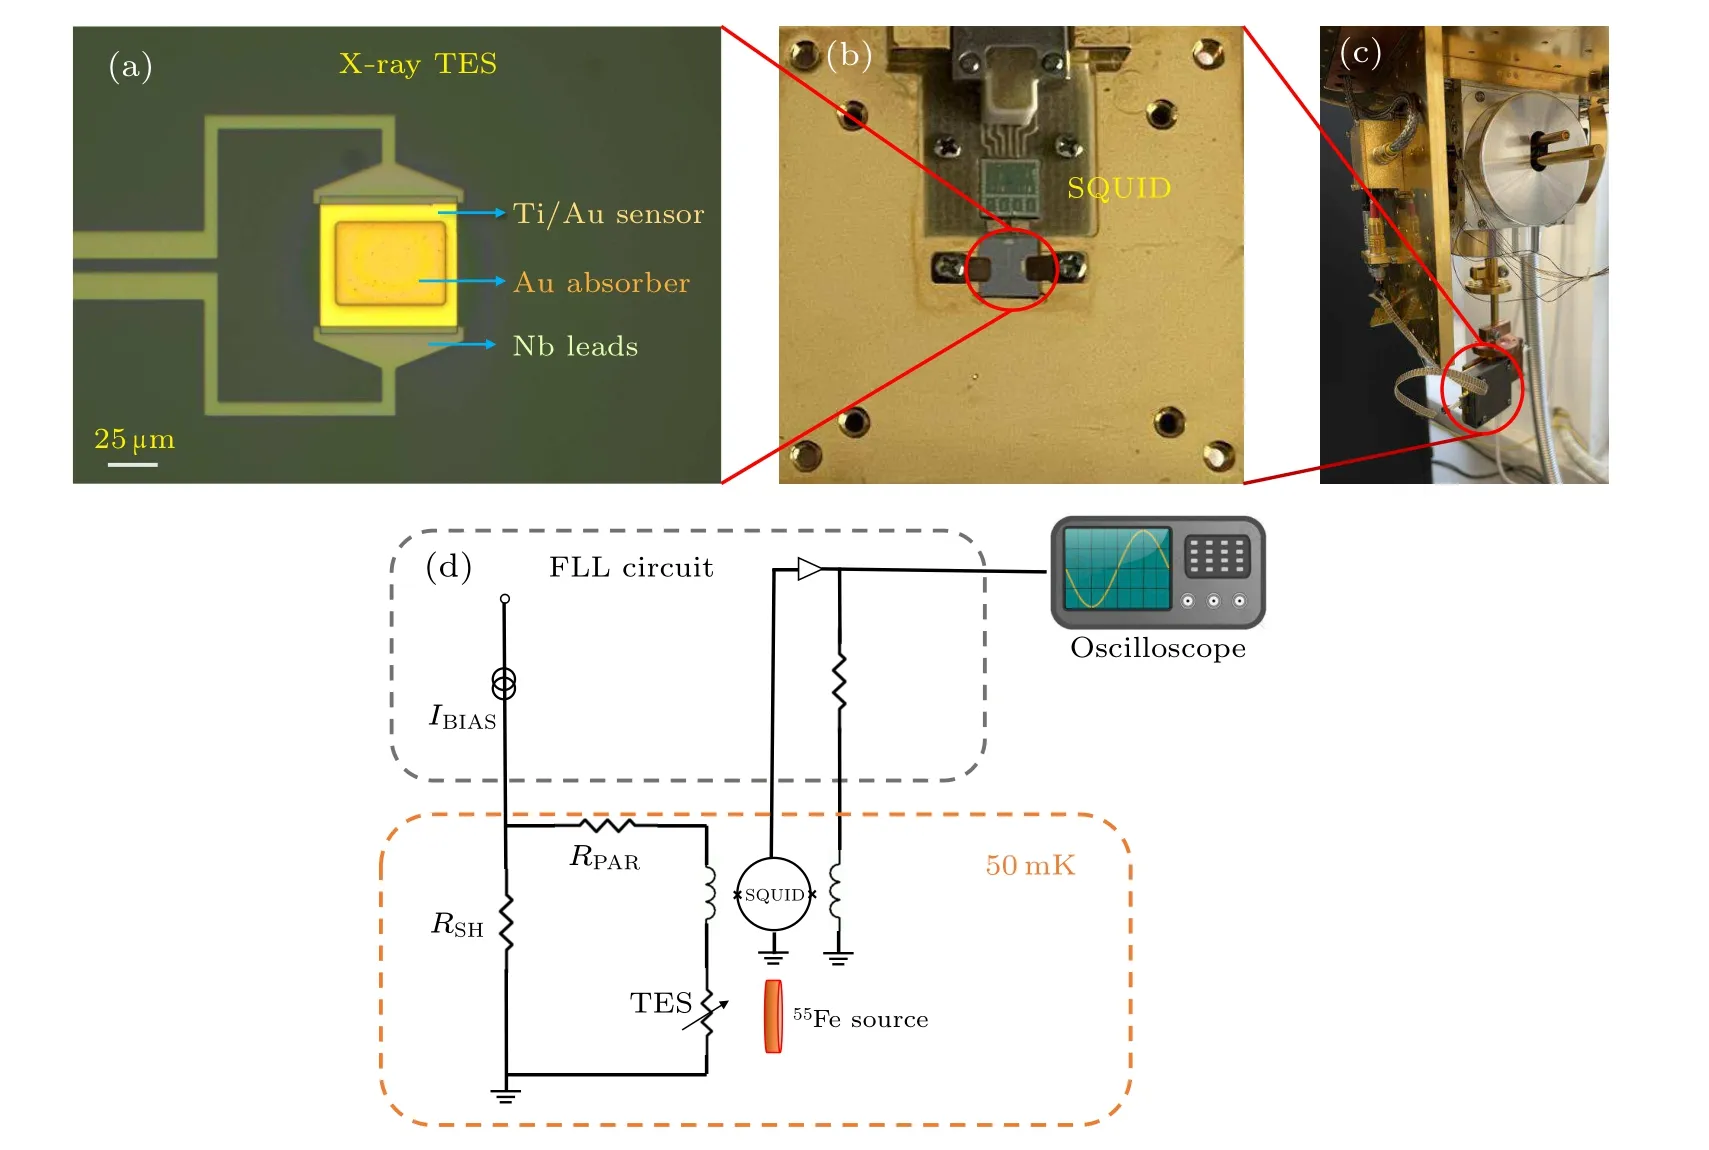
Fig.1.X-ray superconducting TES and measurement setup: (a)photo of x-ray TES with the Au absorber on the center of Ti/Au TES,(b)x-ray TES block integrated with SQUID,(c)measurement setup in ADR refrigerator,(d)schematic diagram of the readout circuit.
We measured the resistance transition curve and currentvoltage curves of the x-ray TES at different bath temperatures(Tbath).Its normal resistance(RN)is 46 mΩ and critical temperature(TC)is 200 mK.The Joule power at 30%RNis fitted to the heat flow equation,[1]and the obtained thermal conductanceGis 7.7 nW/K.All key parameters for this TES are listed in Table 1.
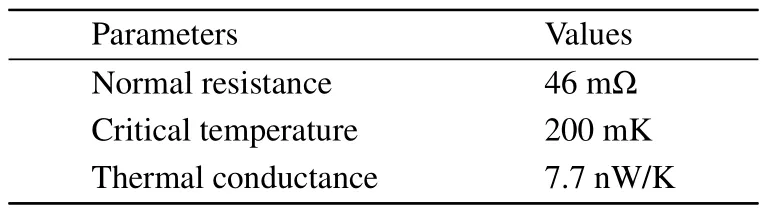
Table 1.Main parameters of the x-ray TES.
3.Pulse trace classification and baseline correction
We record 4000 pulse traces while the TES is biased at 21%RNandTbathof 100 mK.55Fe x-ray source has two main emission peaks, which are MnKαat 5.9 keV and MnKβat 6.5 keV.The pulse height presents the energy of absorbed xray photons.Figure 2 shows the energy spectra of originally recorded pulse traces.ΔE(i.e., the full width at half maximum)is 94 eV for the 5.9 keV energy peak.
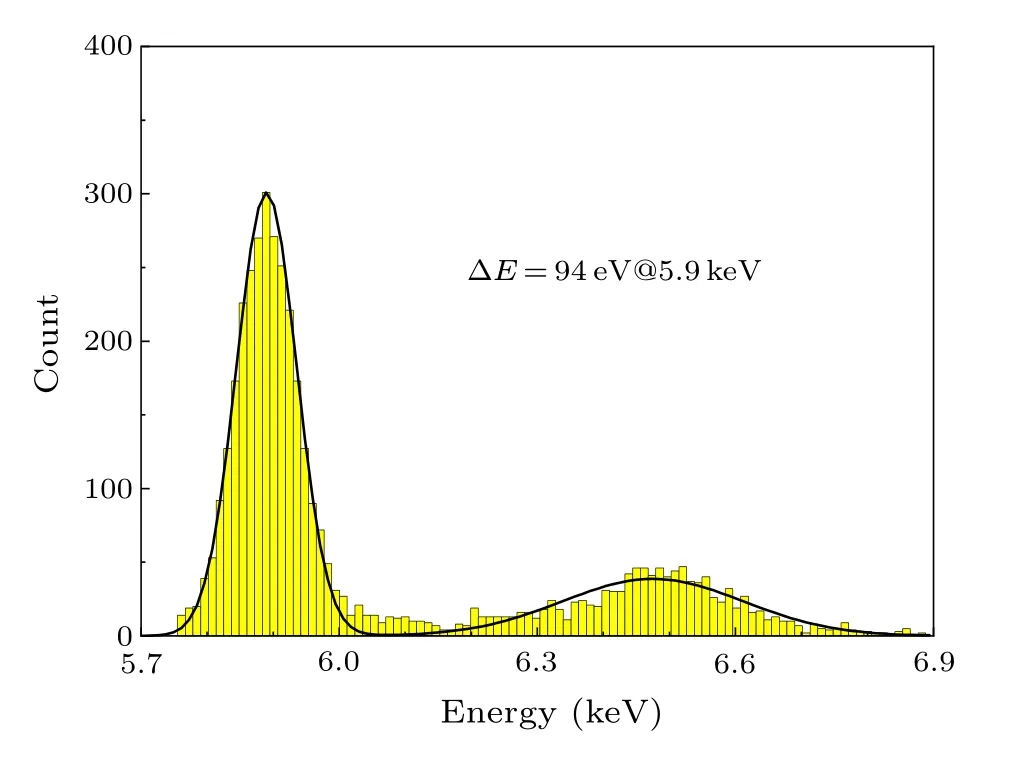
Fig.2.The energy spectra of directly recorded x-ray pulses.
There are various noises or interferences during the experimental process.Three major noises are considered: Johnson noise and thermal fluctuation noise of the TES, and Johnson noise ofRSH.[1]In addition,the switch of our water chiller for the ADR refrigerator might trigger the oscilloscope to produce false pulses.The baseline might be shifted due to SQUID flux jump.High energy particle will generate a pulse with high amplitude.Pile-up event can occur if two or more x-ray photons are incident on the TES in a short time less than the recovering time.Therefore, it is necessary to identify them and to reject the false data before further processing.To reduce the difficulty of data processing, we extract the main features of each trace.As shown in Fig.3, a typical pulse trace includes the following features: pulse amplitude, baseline, rising edge time(τrise),falling edge time(τfall).
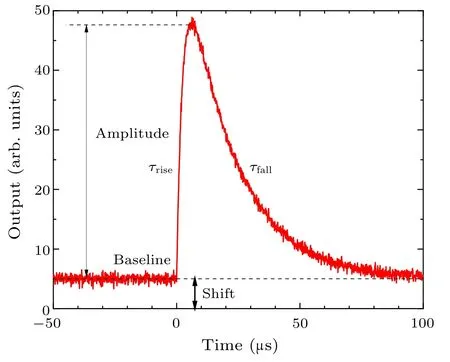
Fig.3.Schematic diagram of response characteristics involved in Kmeans clustering.
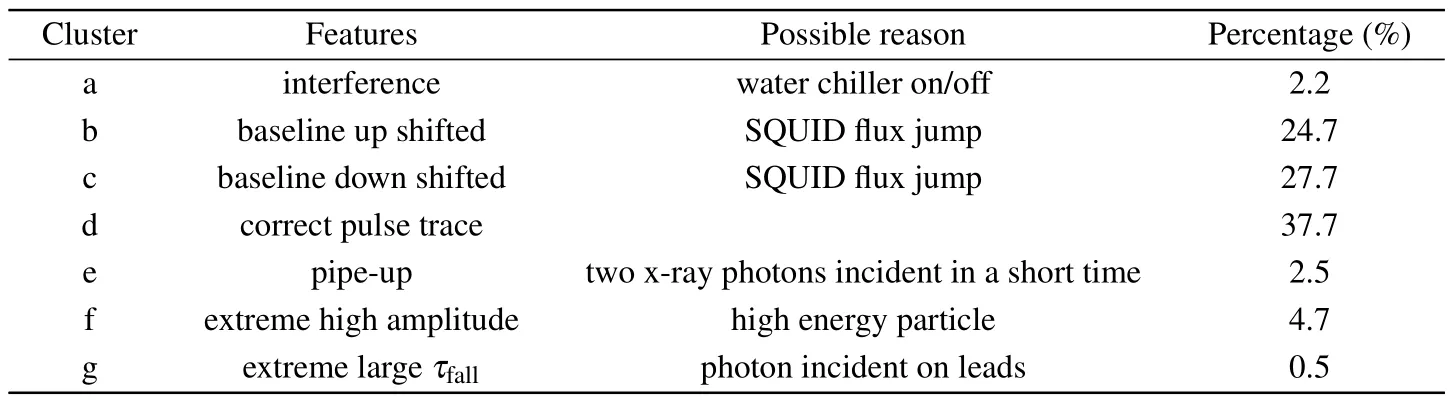
Table 2.Classification of recorded pulse traces.
We thus divide all recorded pulse traces into 7 classes using the K-means clustering algorithm[14]as shown in Table 2.The clusters minimize the sum of the squared deviation of each pulse traces from the mean in the cluster.[15]It can be viewed as the minimization of an objective function
wherexijis one of the extracted feature parameters(base line,amplitude,τriseandτfall) ofith pulse trace,j=1,...,4,mk jrepresents the corresponding mean ofjth feature parameter in clusterCkand is given by
wherenkis the number of traces in clusterCk.Figure 4 shows the iteration process to find the minimum of Eq.(1).At the beginning, each trace is assigned to a cluster with a smallest mean, then we calculate the new mean in each cluster.New distance for each trace is then re-calculated and it will be assigned to a cluster with the new smallest mean.The calculation will stop if no trace is assigned to a new cluster.
Typical trace for each cluster is shown in Fig.5 and the corresponding possible reason is listed in Table 2.Clusters a,e-g are small parts of the total traces and they are rejected.We then correct the baseline for clusters b and c and combine them with cluster d.The histogram of pulse height is plotted in Fig.6.After rejecting the false traces and correcting the base line,ΔEis improved to 76 eV at 5.9 keV.We found that the K-means clustering algorithm will be effective to reject the false traces if the cluster number and main features are easily identified before the classification.
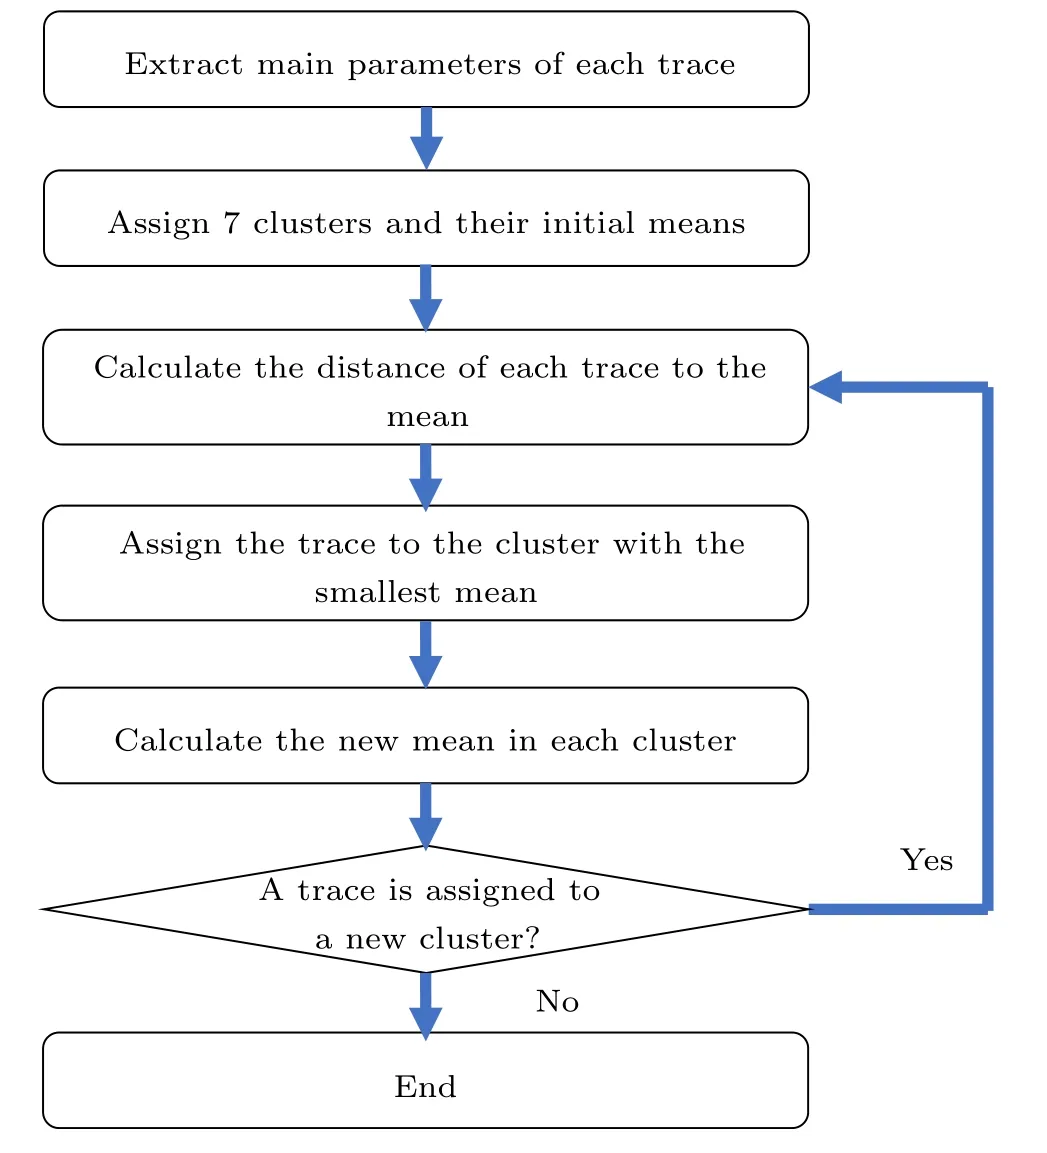
Fig.4.Flow chart of K-mean clustering.
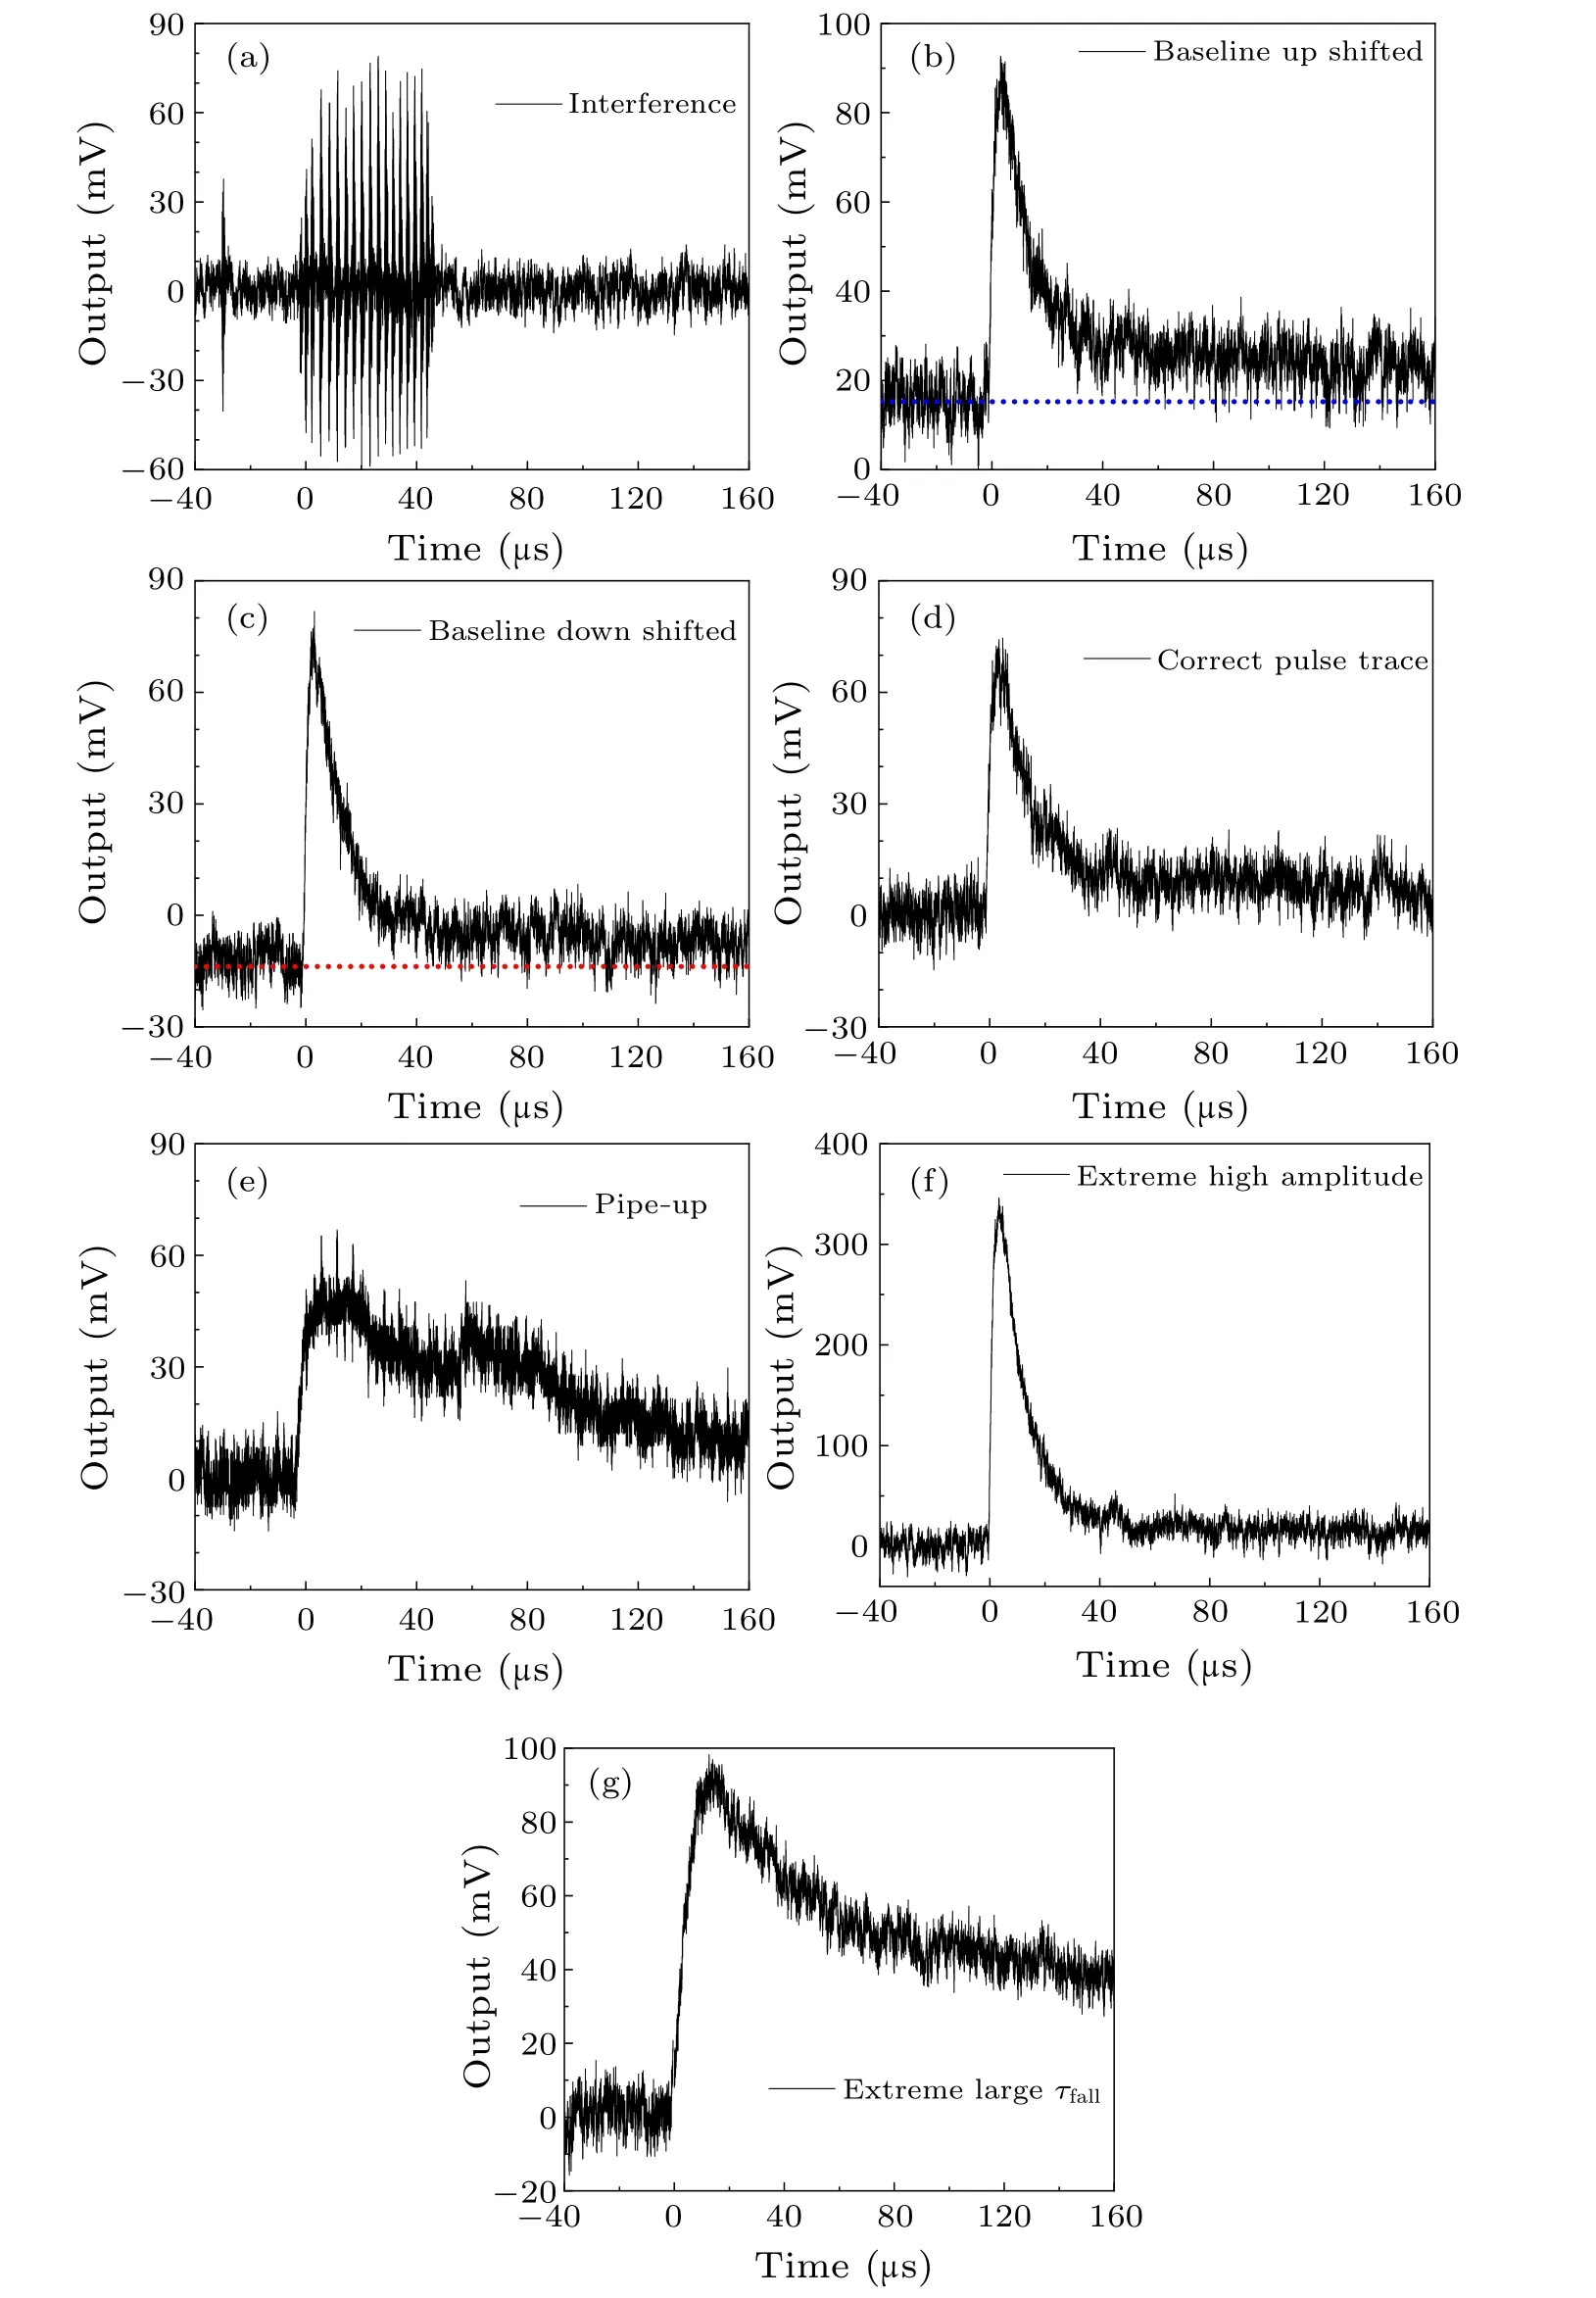
Fig.5.Typical traces found during the experiment process: (a) interference, (b) baseline up shifted, (c) baseline down shifted,(d)correct pulse trace,(e)pipe-up,(f)extreme high amplitude,(f)extreme large τfall.
4.Noise reduction using Wiener filter
We further improve the signal-to-noise ratio with Wiener filter.[16]Based on Fig.6, we choose the pulse traces corresponding to 5.9 keV to obtain the averaged pulses as the template[S(t)](see Fig.7).The falling time(or effective response time)is about 20μs,relatively fast in that the silicon substrate is not removed.Each pulse has the form ofH×S(t)since we assume that our superconducting TES detector works in its linear regime, whereHis the height(or amplitude)of the pulse trace.Then the pulse height is described as
whereS(t) is the optimal filtering template, andD(t) the recorded pulse response.The signal-to-noise ratio (SNR) is calculated by
whereSandNrepresent the signal amplitude and root-meansquare (RMS) noise, respectively.As shown in Fig.7, after applying the Wiener filter, the SNR is raised from 26 dB to 33 dB.The height distribution as a function of photon energy is shown in Fig.8, and the obtained ΔEof this TES is 44 eV@5.9 keV.
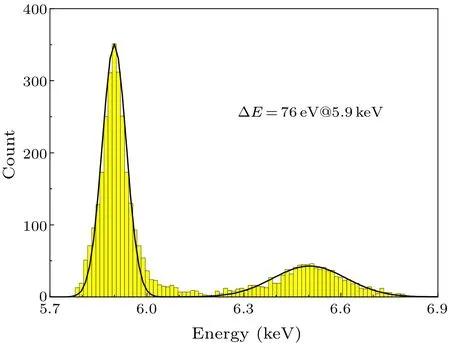
Fig.6.The energy spectra of x-ray pulses after correcting the baseline.
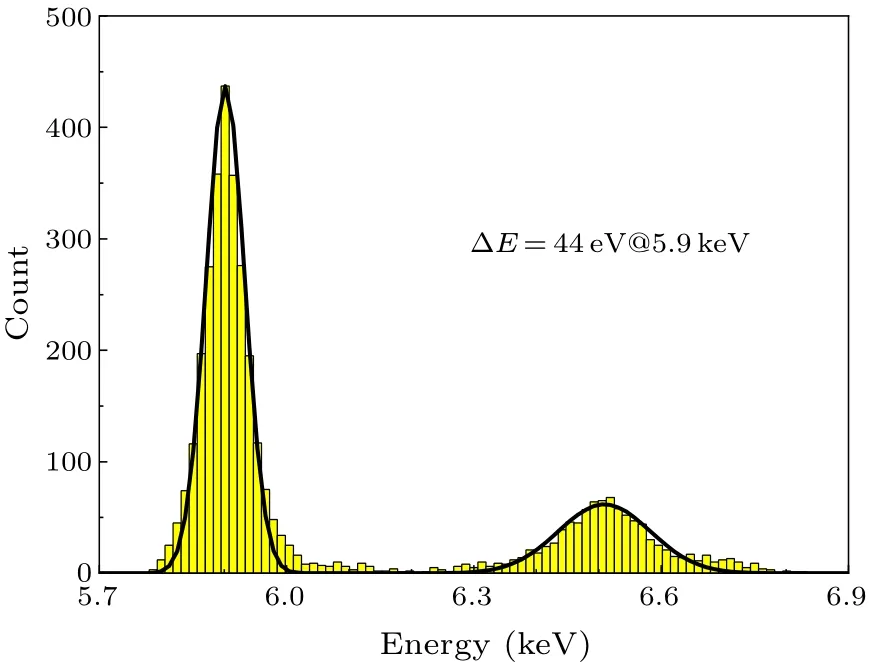
Fig.8.The energy spectra of x-ray pulses after Wiener filtering.
5.Conclusion
We have studied performance of an x-ray Ti/Au bilayer TES with the Au absorber on the center of the senor without etching the silicon substrate under the sensor.The thermal conductance is 7.7 nW/K, and its recovery time is about 20 μs.By K-means clustering and Wiener filtering, the energy resolution is significantly improved,and it has increased from 94 eV to 44 eV@5.9 keV,which can be further improved by DRIE, reducingTCby baking,[17]and optimization of the measurement setup.
Acknowledgments
The authors would like to thank Dr.Wentao Wu,Shanghai Institute of Microsystem and Information Technology,for providing the DC SQUID.
Project supported by the National Natural Science Foundation of China (Grant Nos.12293032, 120101002,12173097, and U1931123), the National Key Basic Research and Development Program of China (Grant Nos.2020YFC2201703 and 2018YFA0404701),and Chinese Academy of Sciences(Grant No.GJJSTD20210002).

- Chinese Physics B的其它文章
- Corrigendum to“Reactive oxygen species in plasma against E.coli cells survival rate”
- Dynamic decision and its complex dynamics analysis of low-carbon supply chain considering risk-aversion under carbon tax policy
- Fully relativistic many-body perturbation energies,transition properties,and lifetimes of lithium-like iron Fe XXIV
- Measurement of the relative neutron sensitivity curve of a LaBr3(Ce)scintillator based on the CSNS Back-n white neutron source
- Kinesin-microtubule interaction reveals the mechanism of kinesin-1 for discriminating the binding site on microtubule
- Multilevel optoelectronic hybrid memory based on N-doped Ge2Sb2Te5 film with low resistance drift and ultrafast speed