Time-resolved K-shell x-ray spectra of nanosecond laser-produced titanium tracer in gold plasmas
2023-02-20 13:15:28ZhencenHe何貞岑JiyanZhang張繼彥JiaminYang楊家敏BingYan閆冰andZhiminHu胡智民
Chinese Physics B 2023年1期
Zhencen He(何貞岑), Jiyan Zhang(張繼彥), Jiamin Yang(楊家敏),Bing Yan(閆冰), and Zhimin Hu(胡智民)
1Key Laboratory of Radiation Physics and Technology of Ministry of Education,Institute of Nuclear Science and Technology,Sichuan University,Chengdu 610064,China
2Institute of Modern Physics,Key Laboratory of Nuclear Physics and Ion-Beam Application(MOE),Fudan University,Shanghai 200433,China
3Laser Fusion Research Center,China Academy of Engineering Physics,Mianyang 621900,China
4Institute of Atomic and Molecular Physics,Jilin University,Changchun 130012,China
Keywords: nanosecond laser irradiation,time-resolved x-ray spectra,characterization of plasma states,Multi-1D hydrodynamic simulations
1. Introduction
High-Zmaterials,such as gold,are usually used to make the hohlraum wall for the enhancement of laser to x-ray conversion efficiency in indirect-driven inertial confinement fusion (ICF) research.[1–3]The states of the plasmas produced by the interaction between laser and hohlraum wall materials are very important for the study of the coupling efficiency of laser–targets. Therefore,the plasmas of laser-irradiated high-Zmaterials need to be well characterized.[4–7]The plasmas produced by the laser-irradiated high-Zmaterials have a wide range of temperature and density. There are two main approaches to diagnose the states of hohlraum plasmas. One approach is the laser Thomson scattering,[8–10]which is an active diagnostic approach, and its theoretical model is mature and reliable. The laser Thomson scattering has been widely used in hohlruam-plasma experiments.[8,11–14]However, the probe laser used in the Thomson scattering has an unavoidable heating disturbance to the plasma. Moreover,the critical density effect restricts the application of laser Thomson scattering for denser plasmas. For the hohlraum target which is a semi-closed system,the experimental arrangement of the laser Thomson scattering is quite a challenge.The other approach is to use x-ray spectroscopy.[11–18]The plasma states can be obtained by pre-embedding a tracer layer in the high-Zmaterials and analyzing the x-ray emission spectra of the tracer layer element (medium-Zmaterials). The experimental arrangement of x-ray spectroscopy is more convenient and flexible. X-ray spectroscopy has been widely used in earlier laser-produced plasma experiments,and was partially replaced with the development of laser Thomson scattering technology. In the recent diagnostic plan on the National Ignition Facility, this method is reconsidered as an important development direction, indicating that this method has its unique advantages. In particular, the combination of spectroscopy and Thomson scattering technology has become an important trend in the hohlraum plasma experiments.[8,11–18]
In this paper,we present a laser-produced Au plasma experiment at the 180 kJ laser facility.[19]The time-resolvedKshell spectra of titanium (Ti) tracer are measured by using a streaked crystal spectrometer, and they are compared to the synthetic spectra produced with the FLYCHK[20]to determine the Au plasma states. The hydrodynamics code Multi-1D[21]is used to simulate the interaction between the laser and the gold plane target. The hydrodynamic simulated results are compared with the experimental results which were obtained by the x-ray spectroscopy method.
2. Experiment
The experiment was performed at a large laser facility[19]in Mianyang,China. The laser has 48 ultraviolet laser beams with a caliber of 400×400 mm,pulse width of 1–10 ns. The total 3ωlaser energy can approach 180 kJ with the peak power of 60 TW.For the Ti-layer-buried Au plasma experiment,two laser beams were superimposed to achieve the desired intensity. The laser beams were smoothed by a continuous phase plate,and the diameter of the focusing spot was about 500 μm.The 3ωflat-top pulse with a duration of 3 ns full width at half maximum and an intensity around 8.8×10¹⁴W/cm2was used in the experiment.Ti is chosen for the current investigation because the optimizedK-shell spectra of Ti ions can be obtained under the present laser-induced plasma states.
The schematic of the experimental setup is shown in Fig. 1. The laser incidence direction was 60°relative to the target surface, and the streaked crystal spectrometer was facing to the target at a normal direction. The field of view of the spectrometer was larger than the laser focus spot. The target used in the experiment was a 0.3 μm thick Ti foil tamped with 0.08 μm of Au on the laser interaction side and 30 μm of Au on the rear side.

Fig.1. Schematic of the experimental setup.
The spectra shown in Fig. 2 was measured by using a streaked crystal spectrometer, which consists of a tris(hydroxymethyl)aminomethane (TAM) crystal (2d=8.78 ?A) and an x-ray streaked camera as a recorder. For the Ti-buried Au plane targets,the TAM crystal was set to resolve the spectra between 4500 eV and 5100 eV, corresponding to the wavelength range from 0.243 nm to 0.276 nm. The resonance lines of H- and He-like ions (i.e., the Ly-αand He-αlines) including the intercombination (IC) and Li-like satellites were clearly identified as shown in Fig.2.The photon energies and the corresponding wavelengths of these identified lines were obtained from the NIST database[22]as listed in Table 1. The well-resolved Ly-αand He-αlines with the accurately known photon energies were used as reference lines for the wavelength calibration.[23]The signal was filtered with a 600 μm thick beryllium at the front of the spectrometer,which was set to shield the stray laser light to obtain a good signal-tonoise ratio. Six bright spots in the upper left of Fig.2 are the time fiducials,with which we can verify the time resolution is about 3.23 ps/pixel,since the time interval between two adjacent fiducials is 500 ps. In Fig.2, the white dashed line over plotted on the data is the temporal profile of the laser intensity,and they-axis shows the time when the laser pulse turned on.

Fig.2. The emission spectra of Ti measured by using a streaked crystal spectrometer.
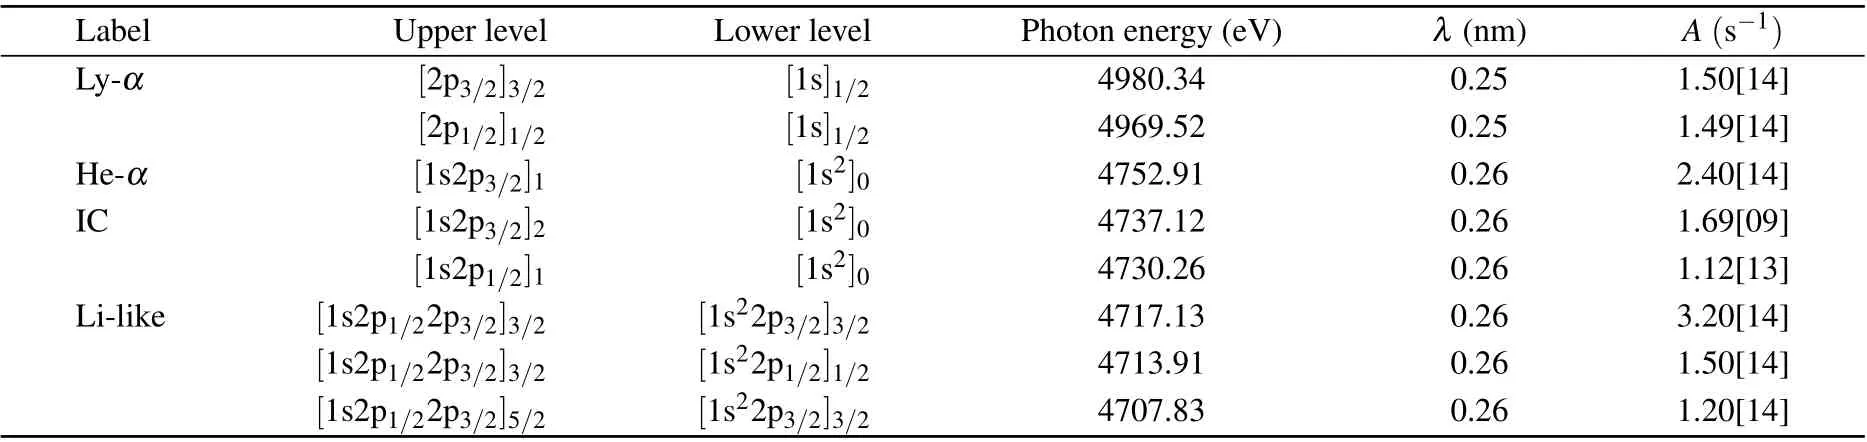
Table 1. Photon energies and wavelengths λ of the Ly-α,He-α,IC,and Li-like satellite lines of Ti from the NIST database.[22] The transition probabilities A are also included. The numbers in square brackets stand for the power of 10.
The measured data shown in Fig.2 is a 2048-dimensional pixel matrix, and the corresponding pixel oft= 0 counted from the bottom of the matrix is 469. Fromt=0, the data is divided into 27 pixel intervals and each interval is summed in they-axis direction to obtain a good signal-to-noise ratio.The corresponding time of the medium pixel of each interval is a time point,and 27 time points are extracted from the streak x-ray spectra. Each time can be determined according to the time resolution and the pixel numbers between 469(t=0)and each medium pixel.
The temporal profiles of the intensities of the Ly-α, Heα,IC,and Li-like satellite lines are shown in Fig.3(a),and the time dependences of the intensity ratios of the IC and Ly-αlines to the He-αline are shown in Fig.3(b). The blue and red dashed lines in Fig.3(b)are the corresponding fits. As shown in Fig.3(a),the He-αline emits earlier than the Ly-αline,and it has longer emission duration than the Ly-α. It is reasonable because the production of He-like ions needs a lower electron temperature than that of H-like ions. On one hand,the charge state distribution of plasma (i.e., the abundance of ions with different charge states)and the population of the excited states are sensitive to the temperature,the ratio of the resonance lines of H-like/He-like ions,i.e.,the Ly-α/He-αline intensity ratio,is widely used for the electron temperature diagnostic.[24,25]On the other hand,the ratio of the IC and He-αlines is dependent on the electron collision process and has strong correlation with the electron density,thus the IC/He-αline intensity ratio can be used for the electron density diagnostics.[26,27]
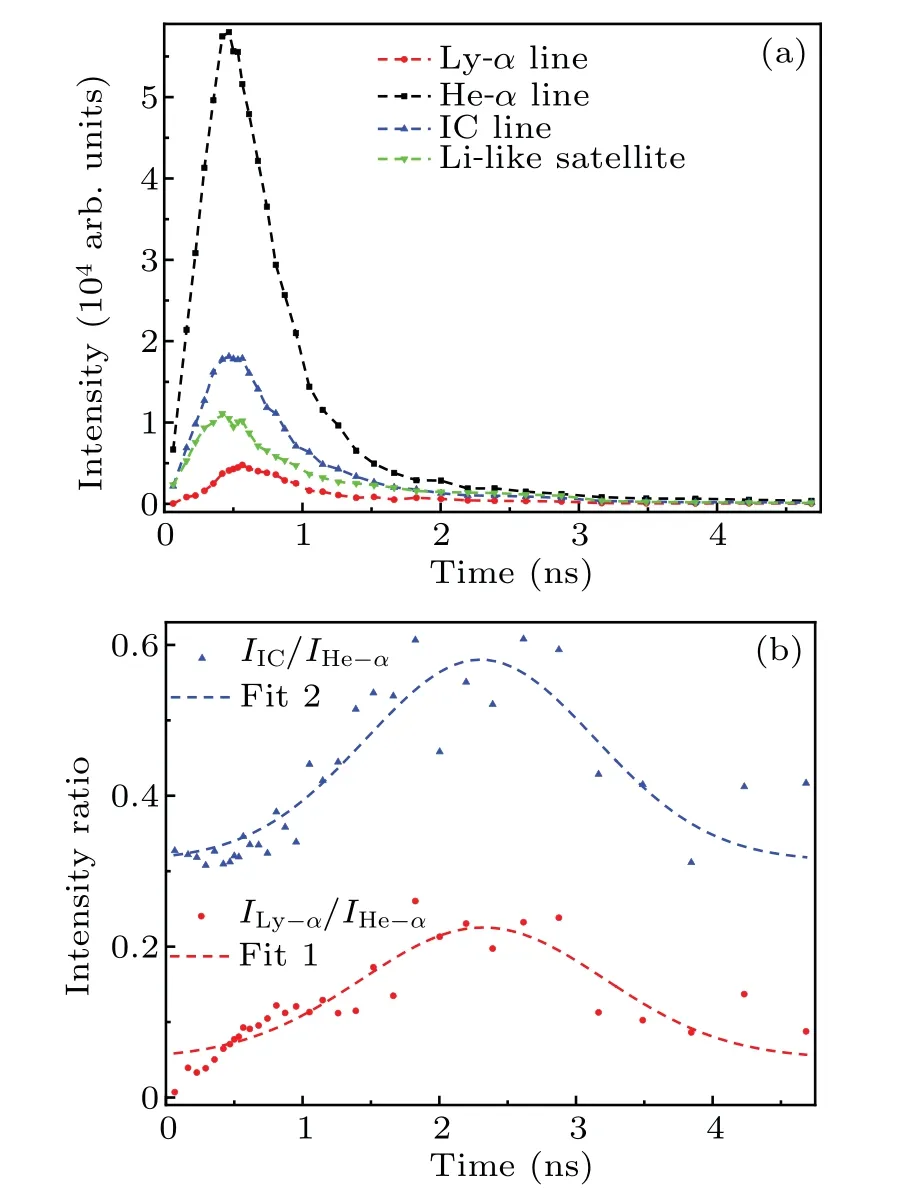
Fig.3. (a)The temporal intensities of the Ly-α,He-α,IC,and Li-like satellite lines. (b) The temporal intensity ratios of the IC and Ly-α lines to the He-α line. The blue and red dashed lines are the corresponding fits.
3. Data and analysis
The simulated x-ray spectra of Ti plasmas are obtained using the zero-dimensional collisional-radiative atomic code FLYCHK,[20]which generates a synthetic spectrum that is compared to the measured time-resolved one.The calculations with FLYCHK assume that the plasma is in non-local thermodynamic equilibrium and steady state. The emission spectra are simulated in the energy range of 4500–5100 eV.
To find the best fits of the experimental spectra at 27 time points extracted from the streaked spectra as shown in Fig.2,the emission spectra of Ti ions are simulated with FLYCHK for a range of temperatures from 100 eV to 3000 eV and densities from 1019cm-3to 1024cm-3. The criterion of determining the plasma states at each extracted time is to find the best matching between the FLYCHK spectrum and the experimental spectrum, including the spectral shape and the relative intensities of the characteristic lines. Figure 4 shows the comparison of spectra at six typical time points. The black curve in each panel is the experimental spectra at the extracted time,and the colored curves are the FLYCHK simulated spectra convolved with a Gaussian function to include the instrumental broadening. The red curve is the best matching spectrum compared with the measured one,and the corresponding temperature and density inputs of the FLYCHK simulations are the plasma states at the extracted time. Besides the best fit (the red curve), the experimental error bars of the plasma states are given by the green and blue curves,which are not in good agreement with but relatively close to the experimental spectrum.
As shown in Fig.2 and listed in Table 1,the Ly-αline is in the photon energy range of 4950–5000 eV,while the He-α,IC,and Li-like satellites are in 4650–4800 eV.Moreover,the emission duration of the Ly-αline is only~1 ns [see Fig. 3(a)],and the measured Ly-αpeak in this period(0.2–1.2 ns)is used to be compared with the FLYCHK results to assist the determination of the plasma states as shown in Figs.4(c)and 4(d).Beyond this period as shown in Figs.4(a),4(b),4(e),and 4(f),the Ly-αline has no sufficient counts and is neglected in the comparison procedure. In the data processing of all 27 time points, the intensities of the He-αand IC lines are taken into account because of their sufficient counts. Figures 4(a) and 4(b) are, respectively, the processing results at 0.06 ns and 0.16 ns when the laser pulse turned on. The low temperatures and high densities cause the strong interactions in the plasma during this period, and it results in a red shift of the experimental spectra (black lines), which can be clearly seen from the in-set figures. Figures 4(c) and 4(d) are, respectively, the results at 0.81 ns and 1.05 ns when the laser pulse has turned on for around 1 ns. Figures 4(e)and 4(f)are,respectively,the results at 3.33 ns and 4.23 ns when the laser pulse turned off.Because of the weak emissions of the Ly-αline during this period,the He-αline and its satellites are focused on.
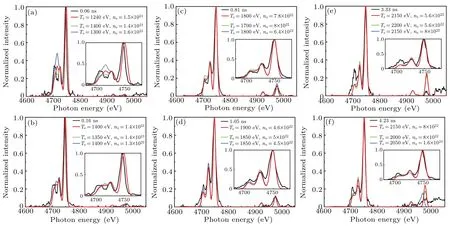
Fig.4. Experimental sprctra at 0.06 ns,0.16 ns,0.81 ns,1.05 ns,3.33 ns,and 4.23 ns,and the FLYCHK simulated spectra are matched with the measured ones.
4. Hydrodynamic simulations
Radiative hydrodynamic simulations were performed using the Multi-1D code.[21]The Multi-1D code uses a steadystate approximation model and takes the main physical mechanism of laser–matter interaction into account.The laser energy is absorbed by inverse bremsstrahlung,and energy transport of x-ray radiation and electron thermal conduction.
The monolayer gold plane target is used in the simulations to evaluate the feasibility of the method which uses Ti tracer x-ray scpectroscopy to characterize the Au plasma states at the buried depth.The thickness of the gold plane target is set to 30.38 μm,which equals to the total thickness of the experimental target. The equation of state for Au(material code=9)in tabular form is taken from the SESAME database. Tabulated NLTE opacities divided into 20 energy groups are calculated using the steady state non-local thermal equilibrium opacity code.[28]Laser and other simulation parameters are set as the actual experimental conditions.
The simulated profiles of the electron temperatureTeand the electron densityneare shown in Fig.5. The black dashed lines in Fig.5 represent all girds distributed in the depth range of gold layer from 0.08 μm to 0.38 μm in the simulations,corresponding to the buried Ti tracer layer of the experimental target. Two colored solid lines in Fig.5 are the average results of the black dashed lines. In Fig. 5, the electron temperature keeps increasing until the laser pulse turned off at around 3 ns and the peak electron temperature in the simulations is about 2.5 keV. The electron density keeps decreasing in the simulations, because the gold plane target expands continuously under the laser ablation.

Fig.5. The simulated temporal profiles of the Au plasma states.
Comparisons between the experimental and theoretical results are shown in Fig. 6. On one hand, the experimental and theoretical results of the evolution processes of plasma states are in agreement, which shows the feasibility of the experimental method to characterize the Au plasma states at the buried depth. On the other hand, there are some quantitative deviations between the measured and simulated results.First, radial temperature and density gradients must be taken into consideration in the theoretical models to match the measurements of the time dependent emission spectra.[29,30]However,the hydrodynamic simulation code Multi-1D used in the present simulations does not take the radial gradients into account,and the plasma is described by a uniform temperatureand-density state. Second, the measured streaked spectra are the integration of emissions in the direction of the target thickness, i.e., along the axial direction. Nevertheless, the FLYCHK spectrum used for deducing the plasma states is simulated by using single temperature and single density. It may contribute to the discrepancy between the experimentally deduced and the Multi-1D simulated plasma states.Third,the intensities of spectral emission temporally change greatly,which makes the intensities of emission spectra weak at several time points,and brings about large statistical uncertainty for deducing the plasma states.
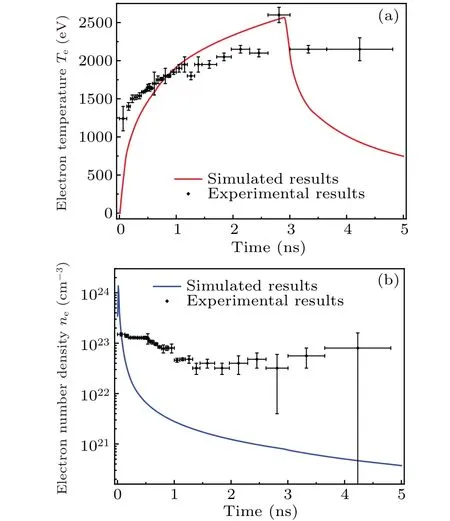
Fig.6. Comparisons of the experimental and theoretical results of the temporal profile of the plasma states.
5. Conclusions
In summary, we present an experimental study on the characterization of laser-produced gold plasmas. The titanium-buried gold planar target is irradiated by nanosecond laser pulses, and the time-resolved x-ray emission spectra of the titanium tracer are measured by a streaked crystal spectrometer. By comparing the synthetic spectra produced by using the FLYCHK code with the measured spectra, the plasma states are determined. Furthermore, the experimental results are compared with the Multi-1D hydrodynamic simulations. An agreement between the spectroscopically deduced and simulated electron temperatures is found.However,the experiment–theory discrepancy of the electron density remains,which mainly might be attributed to that the Multi-1D simulations can not take the radial gradients of the plasma states into account.
Data availability statement
The data that support the findings of this study are openly available in Science Data Bank at http://doi.org/10.57760/sciencedb.j00113.00032.
Acknowledgements
Project supported by the National Key Research and Development Program of China(Grant No.2017YFA0403300),the National Natural Science Foundation of China (Grant Nos. 12074352 and 11675158), and the Fundamental Research Funds for the Central Universities in China (Grant No.YJ202144).
- Chinese Physics B的其它文章
- LAMOST medium-resolution spectroscopic survey of binarity and exotic star(LAMOST-MRS-B):Observation strategy and target selection
- Vertex centrality of complex networks based on joint nonnegative matrix factorization and graph embedding
- A novel lattice model integrating the cooperative deviation of density and optimal flux under V2X environment
- Effect of a static pedestrian as an exit obstacle on evacuation
- Chiral lateral optical force near plasmonic ring induced by Laguerre–Gaussian beam
- Adsorption dynamics of double-stranded DNA on a graphene oxide surface with both large unoxidized and oxidized regions