
鹵代芳香族羧酸與含氮配體合成鑭系配合物的結構、熱化學和熒光性質
2023-02-17 03:55:28王晨璐宿素玲任寧張建軍
物理化學學報 2023年1期
關鍵詞:化學
王晨璐,宿素玲,任寧,張建軍,*
1河北師范大學分析測試中心,化學與材料科學學院,石家莊 050024
2河北省特種設備監督檢驗研究院,石家莊 050000
3邯鄲學院,化學化工與材料學院,河北省雜環化合物重點實驗室,河北 邯鄲 056005
1 Introduction
As an important branch of inorganic chemistry, coordination chemistry1is closely related to chemical fields such as organic chemistry2, analytical chemistry3, biochemistry4, medicinal chemistry5, and the chemical industry6. It has attracted the attention of many chemists. Due to the multiple coordination sites, flexible coordination structures, and unique [Xe]4fn(n =1–14) electron configuration of lanthanide ions7, the structures of complexes using lanthanide ions as central metal ions are very rich, and the chemical properties are very different8,9. This makes lanthanide metal complexes used as photocatalysis10,luminous diode, light-emitting sensors11, fluorescent probes12in optics, anti-tumor drugs, and antidepressants in the field of biomedicine5,13, and magnetic materials in the field9,14of electromagnetism, with a wide range of applications. Many metal complexes, including lanthanide metals, have organic ligands that play an essential role, stemming from their coordination patterns, functional groups, etc. The rich topology of the assembled structures fully demonstrates the charm of the directed assembly15, which can form lanthanide metal complexes with the desired functions and thus obtain various materials with the desired properties16. In recent years, the most studied organic aromatic carboxylic acid ligands17have been used to construct crystal structures because these ligands are usually rigid, thermally stable, and high in dimensionality. There are also various coordination geometric configurations, such as tetragonal antiprism with cap, triangular dodecahedron, doublecap trigonal prism, triangular trigonal prism, etc. In addition, the introduction of nitrogen-containing ligands18involved in the construction of Ln(III) will lead to more novel and large structures of the complexes. Common nitrogen-containing ligands include 2,2′-bipyridine19, 5,5′-dimethyl-2,2′-bipyridine,2,2′:6′2′′-tripyridine, and other pyridyl ligands. As highly conjugated auxiliary ligands, they form complexes with lanthanide ions. The ligands absorb energy, in the ground state,electrons jump into the excited state. Through the inter-system scurry to the excited triplet state, transferring energy to the lanthanide ions, forming the so-called ligand “antenna effect”20.This improves the luminous efficiency of the complex.
Based on the above investigation, two series of five complexes were synthesized by selecting 2,4-difluorobenzoic acid and 2-chloro-6-fluorobenzoic acid as the main ligands and 1,10-phenanthroline and 2,2′:6′2′′-tripyridine as the auxiliary ligands. The novelty of the five complexes, which have not been synthesized before, lies in the variety of structures and the interesting supramolecular structure. In this study, the crystal structure of the polymer was characterized by single-crystal X-ray diffraction, and the supramolecular structure of the polymer was mapped in 1D and 2D. The thermogravimetric-infrared coupling technique performed a thermochemical analysis of complexes 1–5. The luminescent properties of the complexes were determined, except for complex 3.
2 Experimental
2.1 Required reagents and experimental method
All required reagents are reagent grade and can be used without secondary processing. Described in Supporting Information Table S1 are the reagents that were used in this experiment.
Weigh a certain mass of halogenated aromatic carboxylic acid and N-containing ligand in a clean small beaker. Dissolve with 95% ethanol and stir by adding a magnet to a magnetic stirrer.Weigh a certain amount of lanthanide nitrate into another small clean beaker and dissolve it with ultrapure water. The molar mass ratio is acidic ligand : neutral ligand : lanthanide nitrate =3 : 1 : 1. Sodium hydroxide solution is added to the ligand solution after the pH has been adjusted to weak acidity. The solution was poured into the salt solution with a glass rod primer and continued to stir for 6 h and then left to stand for 12 h. The filtrate obtained from the filtration was poured into a clean beaker covered with plastic wrap with small holes inserted and then left to incubate the crystal.
Elemental analysis (%): C66H34F12Sm2N4O12, Calcd.: N, 3.49;C, 49.43; H, 2.14. Found: N, 3.55; C, 49.52; H, 2.12.C66H34F12Eu2N4O12, Calcd.: N, 3.49; C, 49.33; H, 2.13. Found:N, 3.38; C, 49.35; H, 2.18. C66H34F12Er2N4O12, Calcd.: N, 3.42;C, 48.41; H, 2.09. Found: N, 3.38; C, 48.60; H, 2.23.C58H38Cl4F4Tb2N8O16, Calcd.: N, 6.84; C, 42.51; H, 2.34.Found: N, 6.87; C, 42.55; H, 2.51. C58H38Cl4F4Dy2N8O16,Calcd.: N, 6.81; C, 42.33; H, 2.33. Found: N, 6.79; C, 42.41; H,2.55.
2.2 Instruments and test conditions used
Single crystal X-ray diffraction: Measurement with a Smart-1000 single-crystal X-ray diffractometer from Germany Bruker,incident rays are Mo-Kαand Cu-Kα(λ = 0.71073 ?, 1 ? = 0.1 nm)after graphite monochromatization. Structure data are refined using SHELXS-97.
Elemental analysis: Using a Germany Elemental vario EL-III cube element analyzer, hydrogen, carbon, and nitrogen were determined in five complexes.
Infrared spectrum: Measurements were performed on a Bruker Tensor 27 infrared spectrometer from Germany Bruker,in the range of 4000–400 cm-1using the KBr pressed-disk technique.
Raman spectroscopy: Germany Bruker Vertex-70 FTIRRAMANII spectrometer with 100 scans in the wavelength range 2500–200 cm-1and a resolution of 4 cm-1Nd: YAG laser (λ =1.064 μm) with a laser power of 400 mW and liquid nitrogen cooling device was used.
PXRD: Scanning was performed in the range of 5°–50° (2θ)using a Germany Bruker D8 advance X-ray diffractometer with a radiation source of copper-potassium radiation (λ = 0. 71073 ?).
TG-DTG-DSC/FTIR: A Germany Netzsch STA 449 F3 simultaneous thermal analyzer with a Germany Bruker Tensor 27 FTIR spectrometer was used in conjunction with a liquid nitrogen cooling tank. The experimental conditions were simulated with a dynamic air atmosphere, using an ascent rate of 10 K·min-1, heating from 299.25 to 1073.15 K.
Fluorescence spectroscopy: Solid-state fluorescence was measured using an UK Edinburgh FS5 fluorescence spectrometer with Xe lamp irradiation.
3 Results and discussion
3.1 Crystal structure and description
The complexes 1–5 are all pure single-crystals obtained by volatilization from room temperature solutions. Single crystal X-ray diffraction was used to analyze five complexes, and the SHELXS-97 program21was used for structure resolution. The crystal structures were obtained by full-matrix least-squares on the F2refinement method. As can be seen in Table 1, the refinement parameters are listed. A list of select bond lengths follows in Supporting Information Table S2. The different structures can be divided into three conformations. Both are monoclinic crystal systems, belonging to the P21/n space group unexpectedly. Complexes 1 and 2 are the first type of conformation (I), complex 3 is the second type of confirmation(II), and complexes 4 and 5 are the third type of conformation(III), taking complexes 2, 3, and 5 as examples for a detailed explanation.
3.1.1 [Ln(2,4-DFBA)3(phen)]2Ln = (Sm 1 and Eu 2)(I)
To introduce complexes 1 and 2 in detail, complex 2 is used as an example since they are isomorphisms. This symmetrypreserving binuclear molecule consists of six 2,4-DFBA and two phen. The structural unit is shown in Fig. 1a. Each central Eu(III)is coordinated to the carboxyl oxygen atoms in five 2,4-DFBA ligands in three coordination modes, namely double-dentate chelation (O5, O6), bidentate bridging (O3, O4) and ternary bridging (O1, O1#, O2). In addition, coordination with the nitrogen atom (N1, N2) in 1,10-phenanthroline is also carried out. The muffin geometric configuration with coordination number nine was formed after the simulation calculation by the shape22software (Fig. 1b). There is a wide range of bond lengths for Eu―O as shown in Table S2 (in Supporting Information),ranging from 2.870(5)–2.299(5) ?, with an average bond length of 2.458(5) ?. This is similar to the bond length of Ln―O in the oxygen atom contributed by 2,5-bis(4-methylbenzoyl)terephthalic acid in the same type of complexes23. The bond lengths of Eu―N are 2.575(6) and 2.589(6) ?, with an average bond length of 2.582(6) ?. There is a chain-like structure, which can be viewed in Fig. 1c, between adjacent structural units that forms a 1D supramolecular structure along the crystallographic c-axis by C―H···F hydrogen bond. The action distance is 3.127 ?. Based on the 1D chain supramolecular structure, a 2D faceted supramolecular structure (Fig. 1d) along the bc-plane is formed by π–π stacking interaction24in the b-axis direction ofcrystallography. The distance of π–π stacking interaction is 3.414 ?.
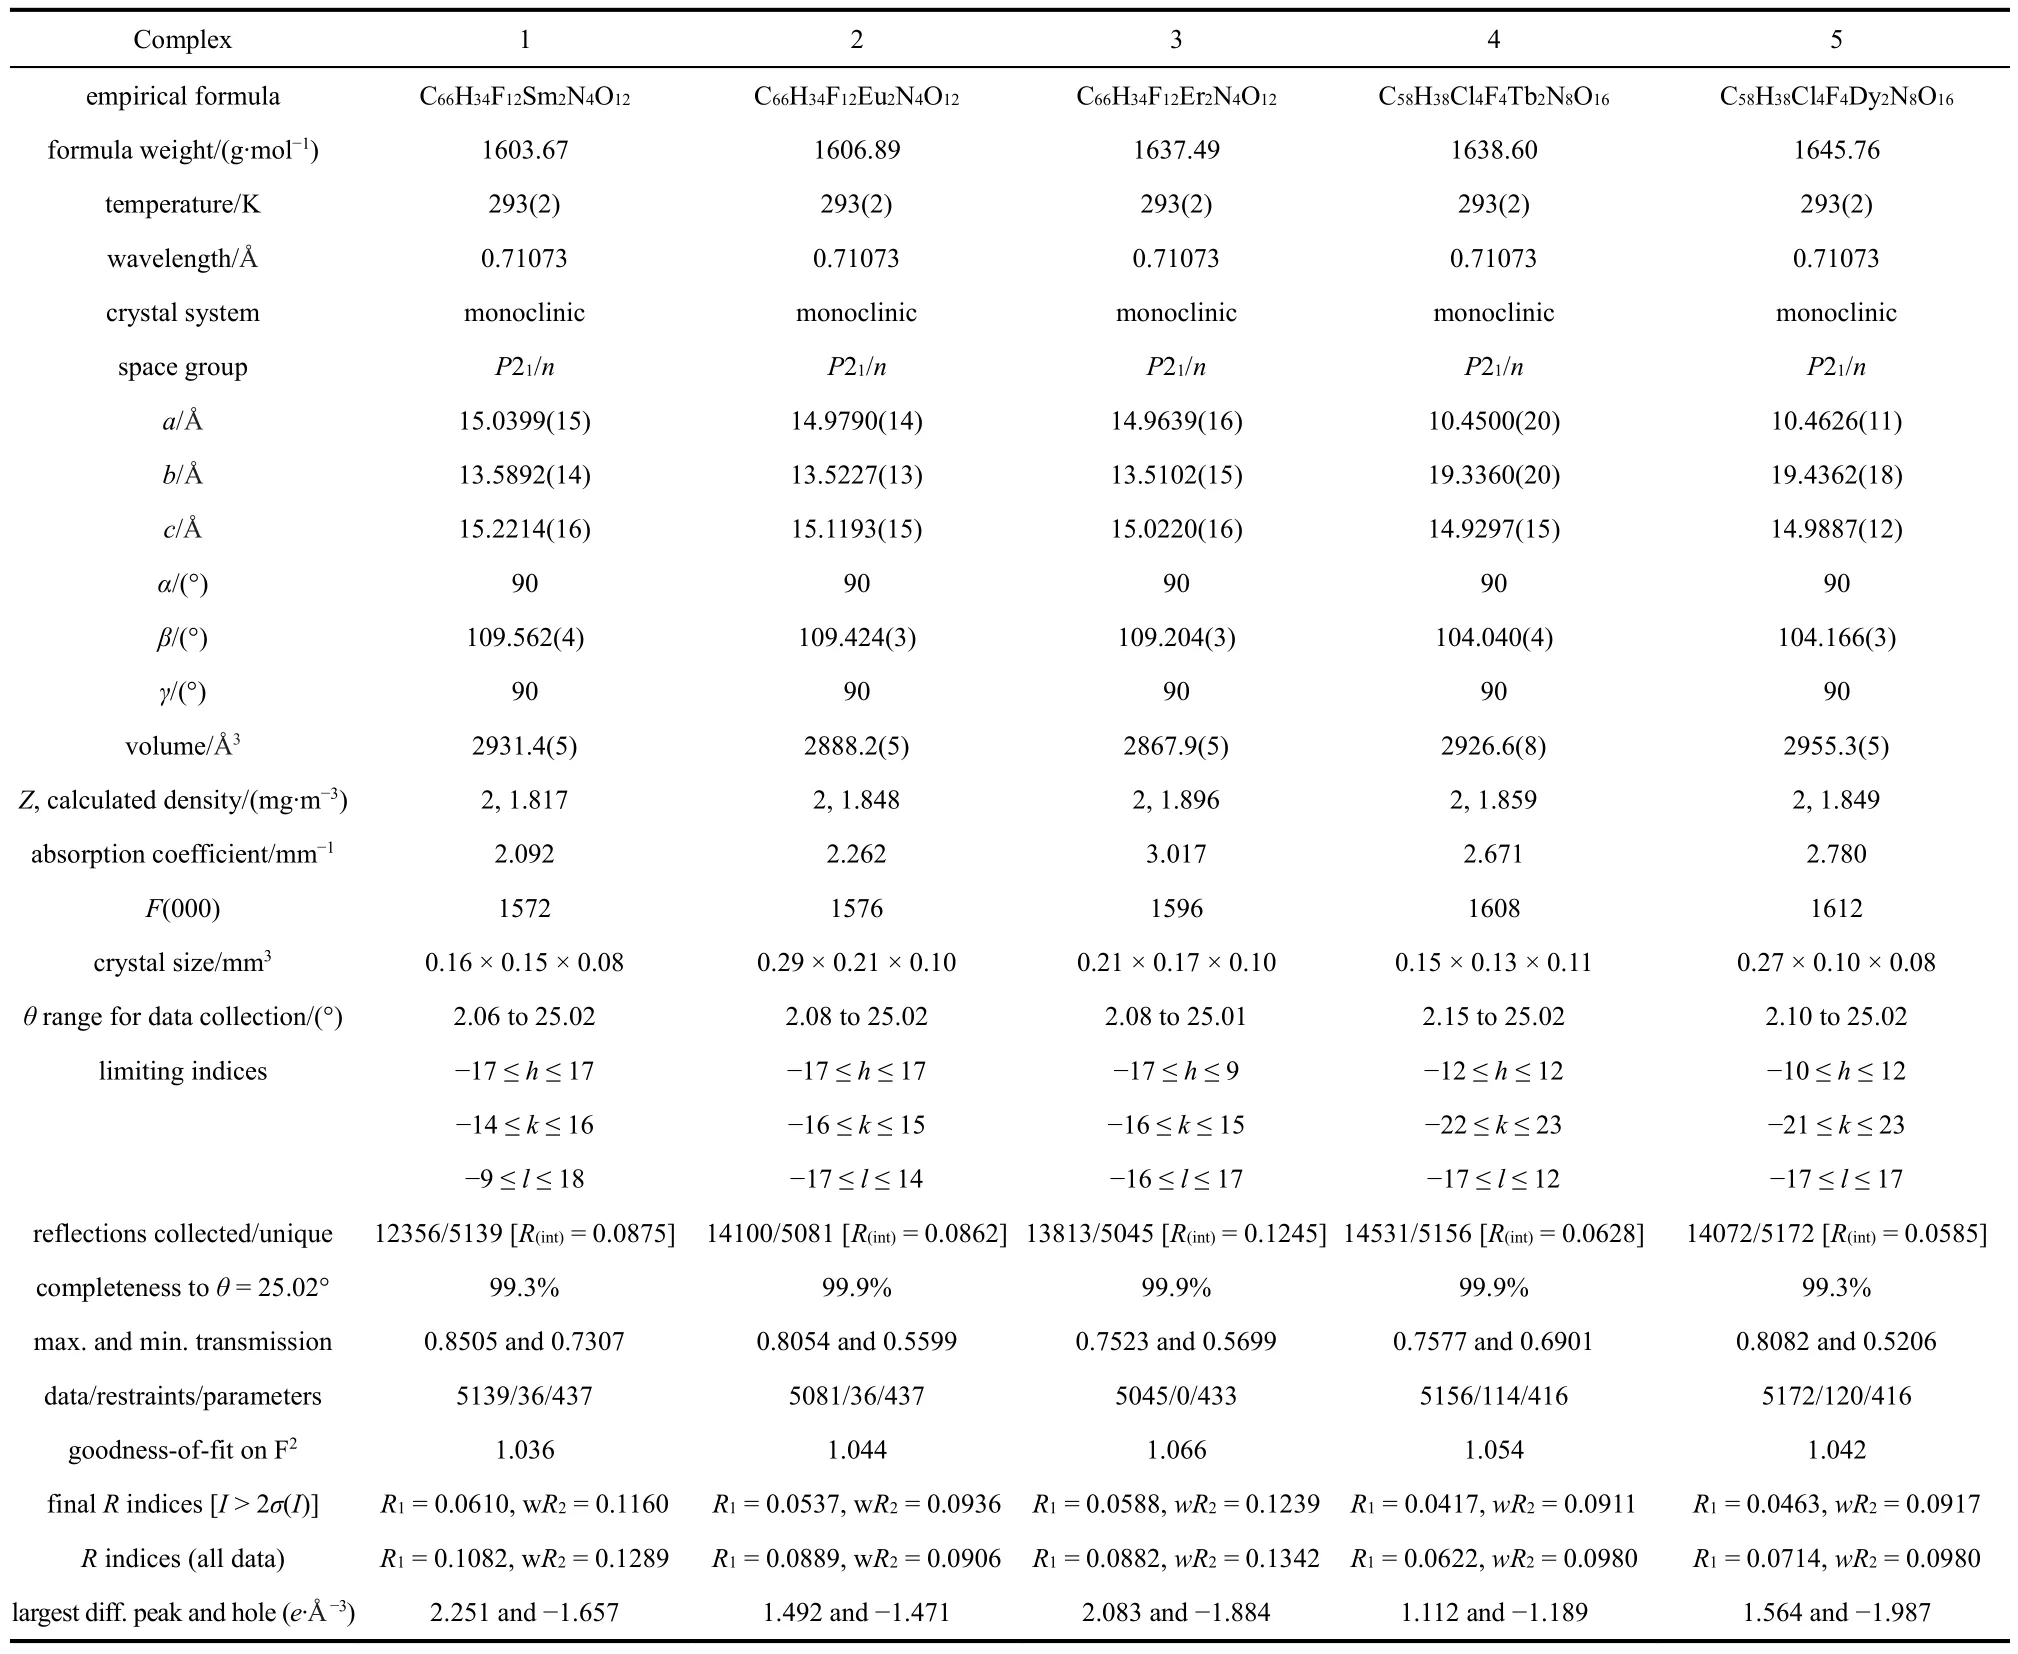
Table 1 Structural refinement parameters of complexes 1-5.
3.1.2 [Er(2,4-DFBA)3(phen)]2(II)
Complex 3 has a similar structural general formula to complexes 1 and 2. The only difference is that the central metal ion of complex 3 is coordinated with the oxygen atom in the carboxylic acid root differently. Complex 3 is shown in Fig. 2a as a structural unit. In the halogenated benzoate ligand, the central Er(III) atom is coordinated to the oxygen atom. The coordination is divided into double-dentate chelating (O5, O6)and bidentate bridging (O1, O2, O3, O4). Each central Er(III) is connected to five 2,4-DFBA ligands, equivalent to three complete 2,4-difluorobenzoate ligands when folded. The coordination mode is different from that of complexes 1 and 2,resulting in differences in coordination number and central atomic geometry configuration, presumably due to the lanthanide contraction25. Complex 3 is a double-capped trigonal center geometry configuration (Fig. 2b) with 8 coordination numbers. The geometric configuration is calculated in the same way as above22. The average bond length of Er―O is 2.327(4)?, and the shortest bond length is 2.243(6) ?, which is derived from the Er1―O2 with bidentate bridging coordination. The 1D chain-like supramolecular structure (Fig. 2c) is reflected along the crystallographic a-axis direction. On the crystallographic acplane (Fig. 2d), facets of the supramolecular structure are reflected as 2D surfaces. Both are connected by C―H···F hydrogen bonding in adjacent 2,4-difluorobenzoate ligands in different structural units with an action distance of 3.152 and 3.416 ?, respectively.
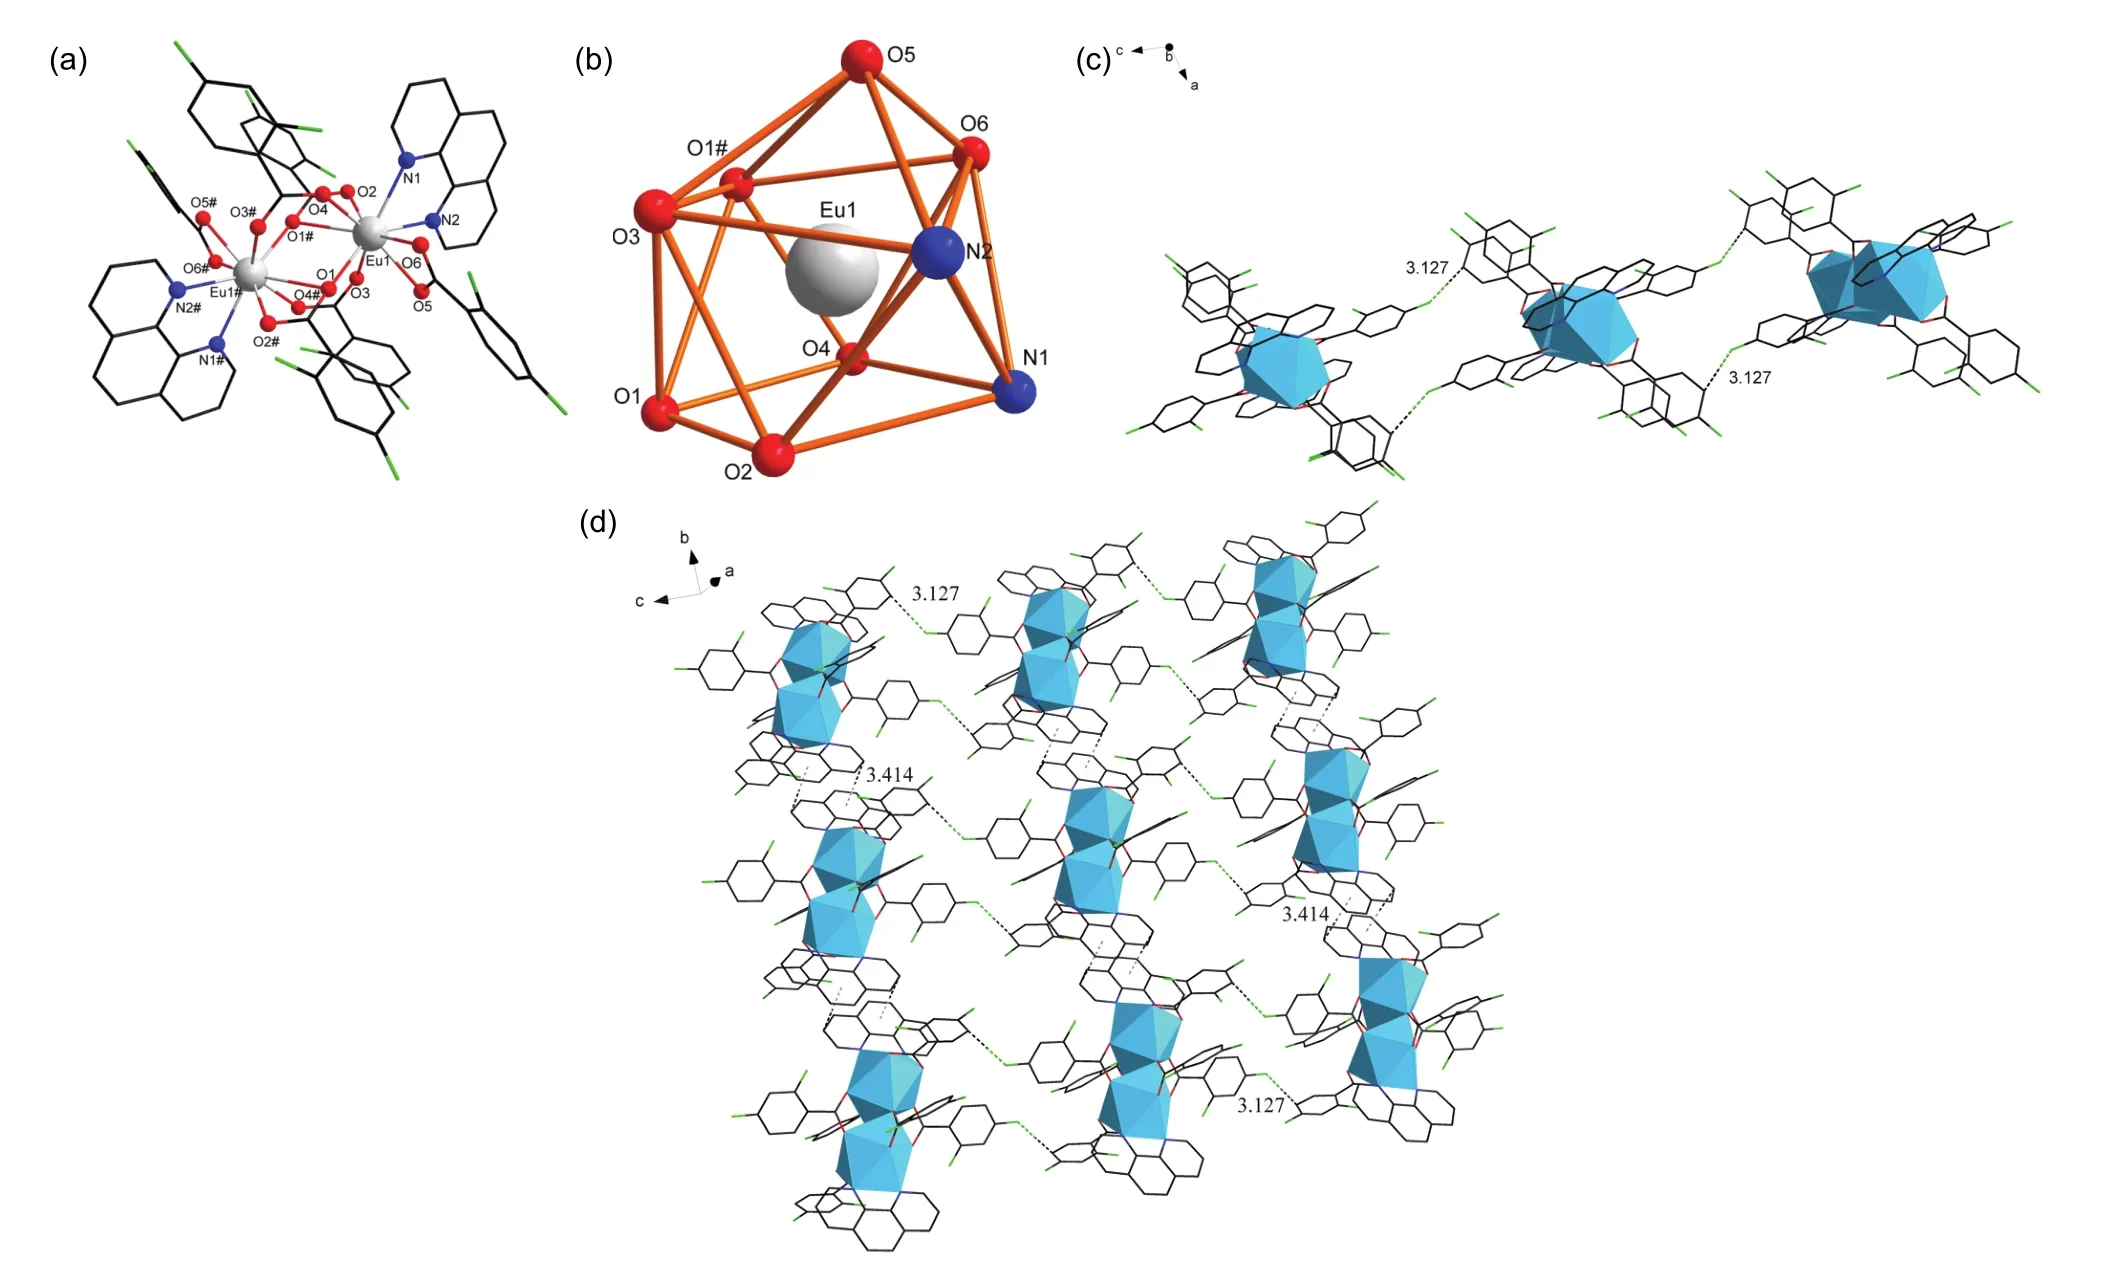
Fig. 1 Structural unit (a) and central Eu(III) geometrical configuration (b) of complex 2,1D chain-like supramolecular structure (c) of complex 2, 2D faceted supramolecular structure (d) of complex 2.
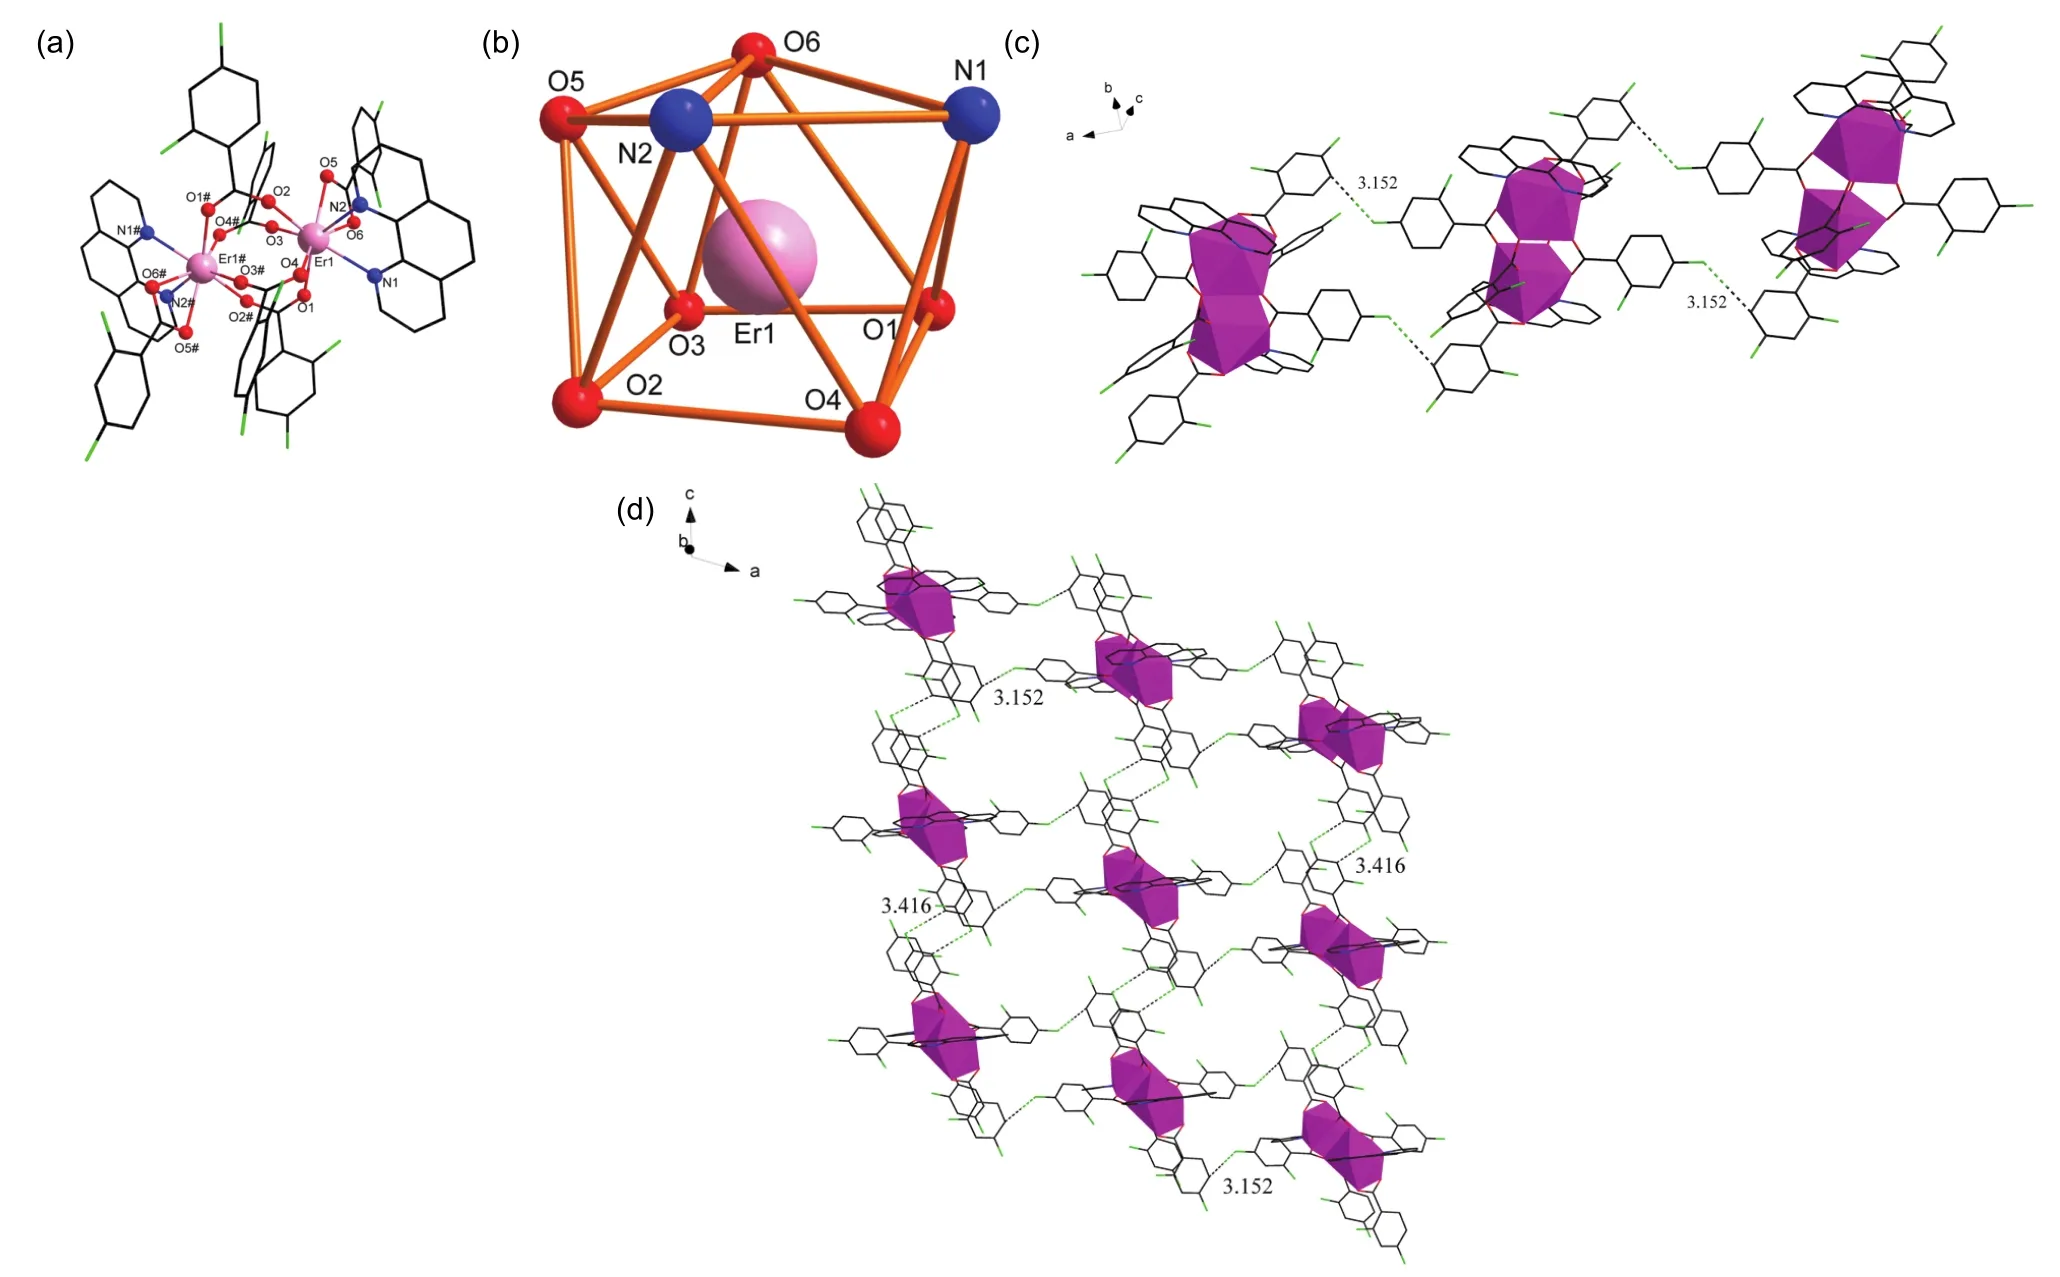
Fig. 2 Structural unit (a) and central Er(III) geometrical configuration (b) of complex 3,1D chain-like supramolecular structure (c) of complex 3, 2D faceted supramolecular structure (d) of complex 3.
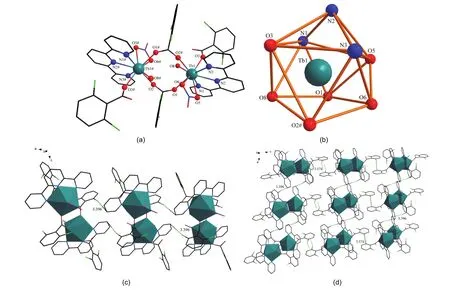
Fig. 3 Structural unit (a) and central Tb(III) geometrical configuration (b) of complex 4,1D chain-like supramolecular structure (c) of complex 4, 2D faceted supramolecular structure (d) of complex 4.
3.1.3 [Ln(2-Cl-6-FBA)2(terpy)(NO3)(H2O)]2Ln = (Tb 4 and Dy 5) (III)
The structure of the third category is clearly distinguished from the first two categories and is elaborated in detail using complex 4 as an example. The binuclear structural unit (Fig. 3a)consists of two Tb(III) as the central ion, with four 2-chloro-6-fluorobenzoate ligands, two 2,2′:6′2′′-tripyridine ligands, two nitrate ions, and two coordination water molecules involved in coordination. Due to the symmetry of the structural unit, the environment around Tb1 is introduced as an example. There are three types of coordination between oxygen atoms and central metal ions, namely bidentate bridging (provided by carboxyl oxygen atoms O1, O2 in 2-chloro-6-fluorobenzoate ligand),double-dentate chelating (provided by oxygen atoms O5, O6 in nitrate) and single-dentate chelating coordination (provided by oxygen atom O3 in 2-chloro-6-fluorobenzoate and oxygen atom O8 in ligand water molecule). The N atoms (N1, N2, N3) in the 2,2′:6′2′′-tripyridine are also involved in the coordination. A bond length of 2.406(1) ? is the average for Tb―O, which ranges from 2.303(4) to 2.527(4) ?. The bond lengths of Dy―N range from 2.512(5)–2.567(5) ?. This is similar to the previously reported bond length26of Ln―N in the same neutral ligand 2,2′:6′2′′-tripyridine. A muffin-type coordination environment(Fig. 3b) with a coordination number of 9 was calculated by shape22software simulation. The adjacent structural units form a 1D chain-like supramolecular structure (Fig. 3c) along the crystallographic a-axis with a hydrogen-bonding distance of 3.396 ? under the C―H···F hydrogen bonding. Based on the 1D chain structure, a 2D faceted supramolecular structure (Fig. 3d)along the ac-plane is formed along the crystallographic c-axis,which is achieved by a weak π-π stacking interaction24at an action distance of 3.574 ?.
3.2 Infrared and Raman spectroscopy
For determining the structure of ligands and complexes, IR and Raman spectra were analyzed, as shown in Fig. 4. Both of them reflect the structural information of the complexes and are complementary27. In Table S3 (in Supporting Information), the IR spectra of the four ligands and complexes 1–5 are listed, and the Raman spectra are shown in Table S4 (in Supporting Information). After complex formation, the νC=Oin 2,4-difluorobenzoic acid ligands (IR: 1691 cm-1, R: 1634 cm-1) and 2-chloro-6-fluorobenzoic acid ligands (IR: 1703 cm-1, R: 1652 cm-1) disappeared. Instead, symmetric and antisymmetric stretching vibrations28of the carboxylate were observed,suggesting that it is the carboxylate group in the acidic ligand involved in the coordination with Ln(III) coordination. In addition to this, the vibration of νLn―O29was also observed,which corroborates the above point. Putting the focus on the two auxiliary ligands, we observed a significant displacement of the stretching vibration of the C=N bond after the complex formation. Since the Raman spectrum covers a wider range than the IR spectrum, νLn―N(R: 213–246 cm-1) was also observable in the spectrum of the Raman, which provides strong evidence for the involvement of nitrogen-containing ligands in the coordination formation of Ln―N bonds30.
3.3 Powder X-ray diffraction test
According to the results of single-crystal X-ray diffraction, it can be classified into three types according to the type of structure, complexes 1 and 2 (I), complex 3 (II), and complexes 4 and 5 (III). To obtain PXRD spectra, representative singlecrystal CIF data for complexes 2–4 were fitted and compared with experimentally measured PXRD (Fig. 5). The measured peak pattern was in good agreement with the simulated peak pattern, indicating that the target complexes were synthesized with high purity31. Besides, the positions and peak shapes of the diffraction peaks of the same type of complex powder are the same, confirming that they have the same structure32. As a final note, the ligand powder peaks showed significant differences with respect to the complexes, indicating the formation of a new phase, not the result of mechanical summation of the ligand powders31,32.
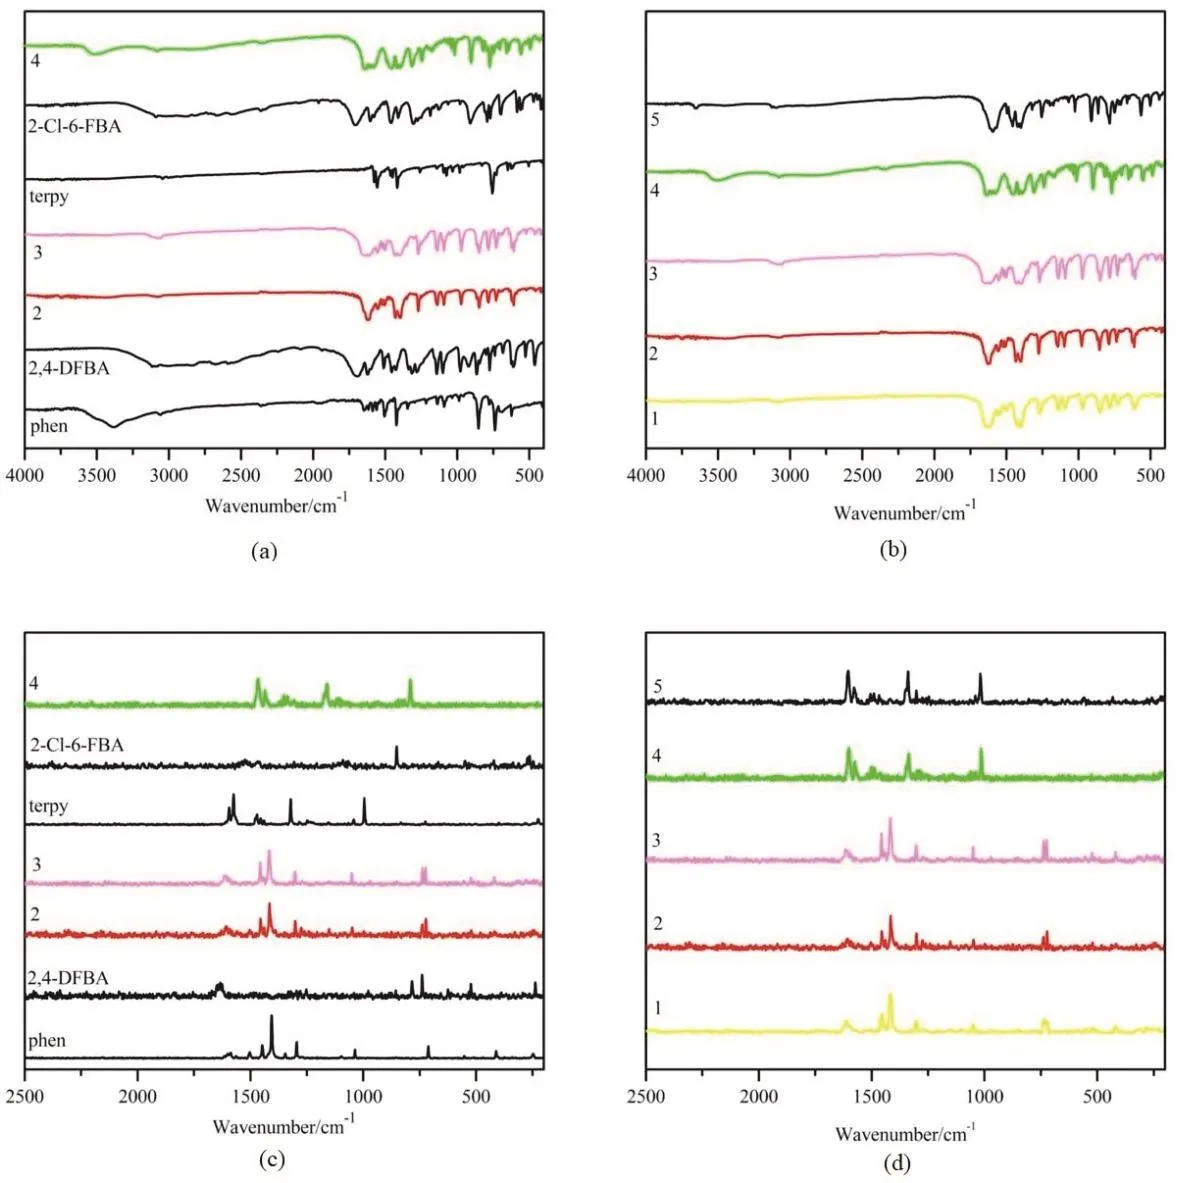
Fig. 4 (a-d) IR and Raman spectra. a: IR spectra of ligands and complexes 2-4; b: IR spectra of complexes 1-5;c: Raman spectra of ligands and complexes 2-4; d: Raman spectra of complexes 1-5.
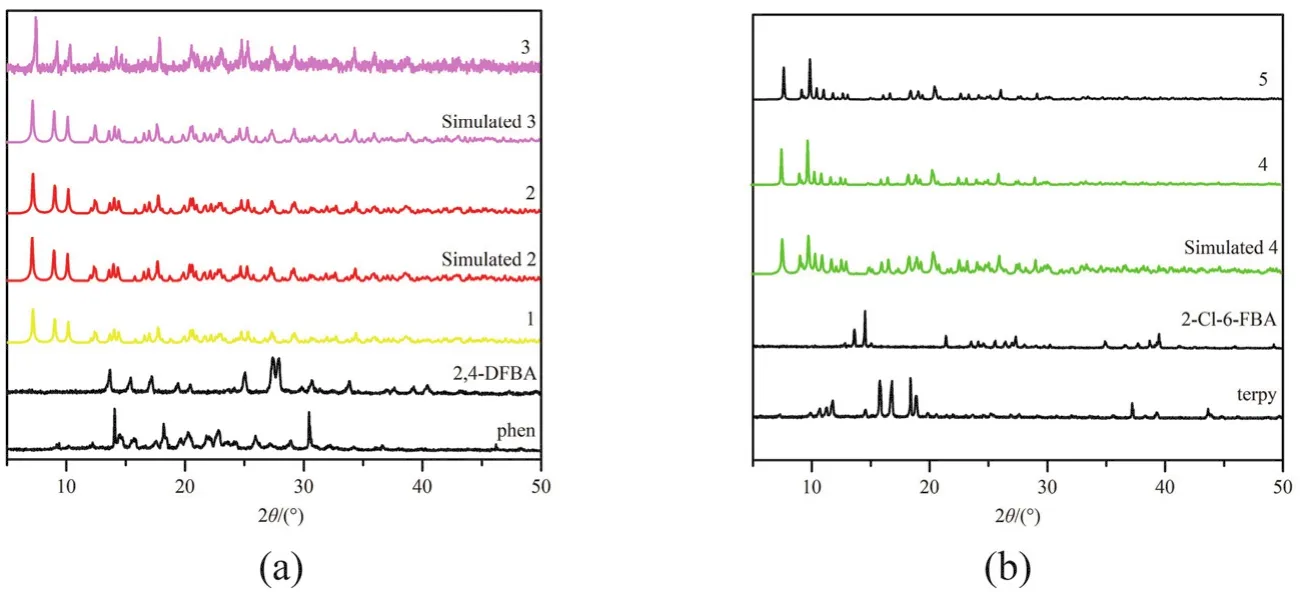
Fig. 5 (a, b) PXRD diffraction peaks of ligands and complexes 1-5. a: PXRD diffraction peaks of ligands and complexes 1-3; b: PXRD diffraction peaks of ligands and complexes 4 and 5.
3.4 Thermal decomposition process and analysis of escaping gases
The TG-DTG-DSC/FTIR analysis33,34of complexes 1–5 was carried out under a simulated dynamic atmosphere (N2: 20 mL·min-1, O2: 10 mL·min-1, protective gas of N2: 30 mL·min-1),and the corresponding thermal decomposition data (Table 2), as well as the thermogravimetric curve (Fig. S1), 3D-IR fugitive gas data were obtained (Fig. S2 for the 3D-IR stacking diagram and IR spectral data are shown in Fig. S3). Thermogravimetric and 3D-IR coupling techniques can better analyze the thermal decomposition process of the complexes, and the two are complementary to each other. Let’s take complexes 2–4 as an example to introduce. Firstly, for complex 2, two parts of significant weight loss can be seen in the thermogravimetric curve (Fig. S1b), corroborating the two downward peaks in the DTG curve and the two stacking peaks in the 3D fugitive gas stacking diagram. The first decomposition step occurred in the temperature range of 466.15–693.15 K with a weight loss of 57.61%, corresponding to the loss of two phen and part 2,4-DFBA. Infrared spectral data of the strongest peak of the solved signal at a temperature of 619.15 K, where small fragments of organic molecules from the decomposition of 1,10-phenanthroline were observed (νC=N: 1608 cm-1, νC―N: 1232,1254 cm-1, νC―H: 3088–3167 cm-1, and γC―H: 765, 1047, 1128 cm-1). In addition, there is a vibrational peak of carbon dioxide(669, 2361 cm-1), which is attributed to the partial loss of 2,4-difluorobenzoate. There was a range of 693.15–1016.15 K in the second decomposition step. The actual weight loss was 19.29%,corresponding to the loss of the remaining 2,4-difluorobenzoate.754.15 K corresponds to the strongest peak of the second-stage 3D-IR signal, and only the vibrational peak of CO2was observed in the spectrum, which indicates that only the 2,4-difluorobenzoate ligand was lost in the second step. In summary,the thermogravimetric curves of each decomposition stage corresponded to the 3D-IR, confirming the correctness of the speculation. The structural formula of complex 3 is similar to that of complex 2. The difference only lies in the way of coordination, which is not explained in detail by thermogravimetry, but only the difference. The thermal decomposition process of complex 3 in three steps differs from that of complex 2. Some of the acidic ligands are lost in multiple stages, presumably due to the contraction of the lanthanide system25. The thermogravimetric curve of complex 4 is shown in Fig. S1d, where four distinct downward peaks of the DTG curve are observed, indicating a four-step decomposition. There are four stacking peaks in the 3D-IR stacking diagram (Fig.S2d), confirming the correctness of the decomposition phase.The first decomposition step is at 424.15–489.15 K. The weight loss is 2.38% (theoretical value 2.20%), which corresponds to the decomposition of two ligand water molecules. The strongest signal peak of the 3D-IR was solved at 432.15 K, corresponding to the vibrational peak of H2O (stretching vibration: 3198–3639 cm-1, bending vibration: 1566 cm-1). The temperature interval of the second decomposition step was 489.15–627.15 K, with a weight loss of 36.34%, corresponding to the loss of two 2,2′:6′2′′-tripyridine ligands and two nitrate ions (theoretical value 36.04%). The strongest peak of the IR signal was observed at 599.15 K, with the escape of NO2(1427, 1472, 1599 cm-1) and the decomposition of 2,2′:6′2′′-tripyridine resulting in partial fragmentation of small organic molecules (νC=C, νC=N, νC―N,δC―H, γC―H). The decomposition types of the third and fourth steps are the same: the decomposition of 2-chloro-6-fluorobenzoate (temperature interval 627.15–996.15 K). The total weight loss for these two decomposition steps was 37.55%,similar to the theoretical value (38.95%). The strongest signal peaks appeared at 764.15 K and 817.15 K. The escape signal of carbon dioxide gas (669, 2363 cm-1) due to the decomposition of aromatic carboxylic acids was observed in the 3D spectrum.The inference was confirmed to be correct. The products corresponding to each decomposition step are [Tb(2-Cl-6-FBA)2(terpy)(NO3)]2→ [Tb(2-Cl-6-FBA)2]2→ Tb2(2-Cl-6-FBA)4-x→ Tb4O7, and the final product is a metal oxide35,36.
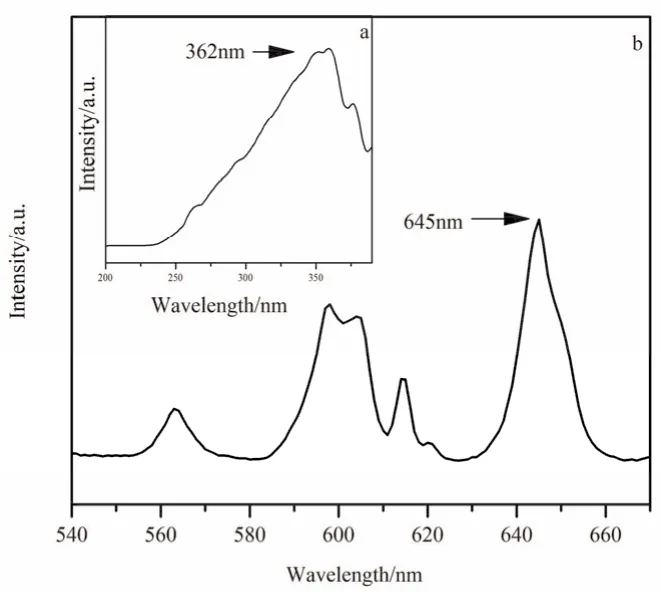
Fig. 6 Fluorescence spectrum of complex 1.
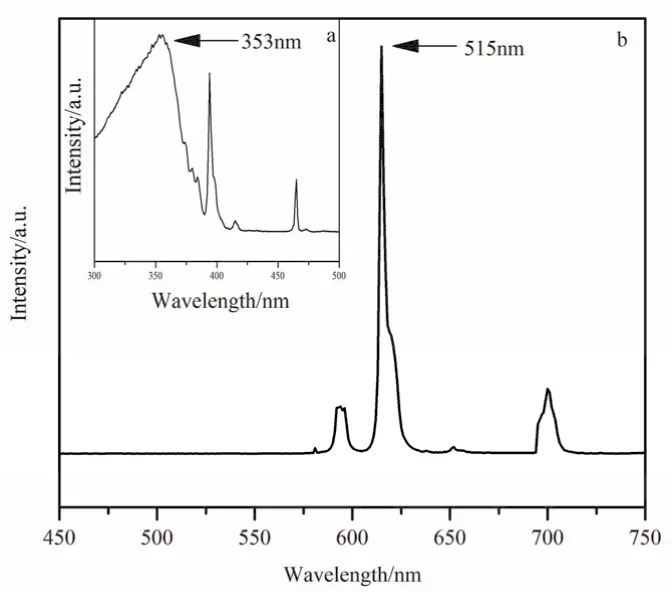
Fig. 7 Fluorescence spectrum of complex 2.
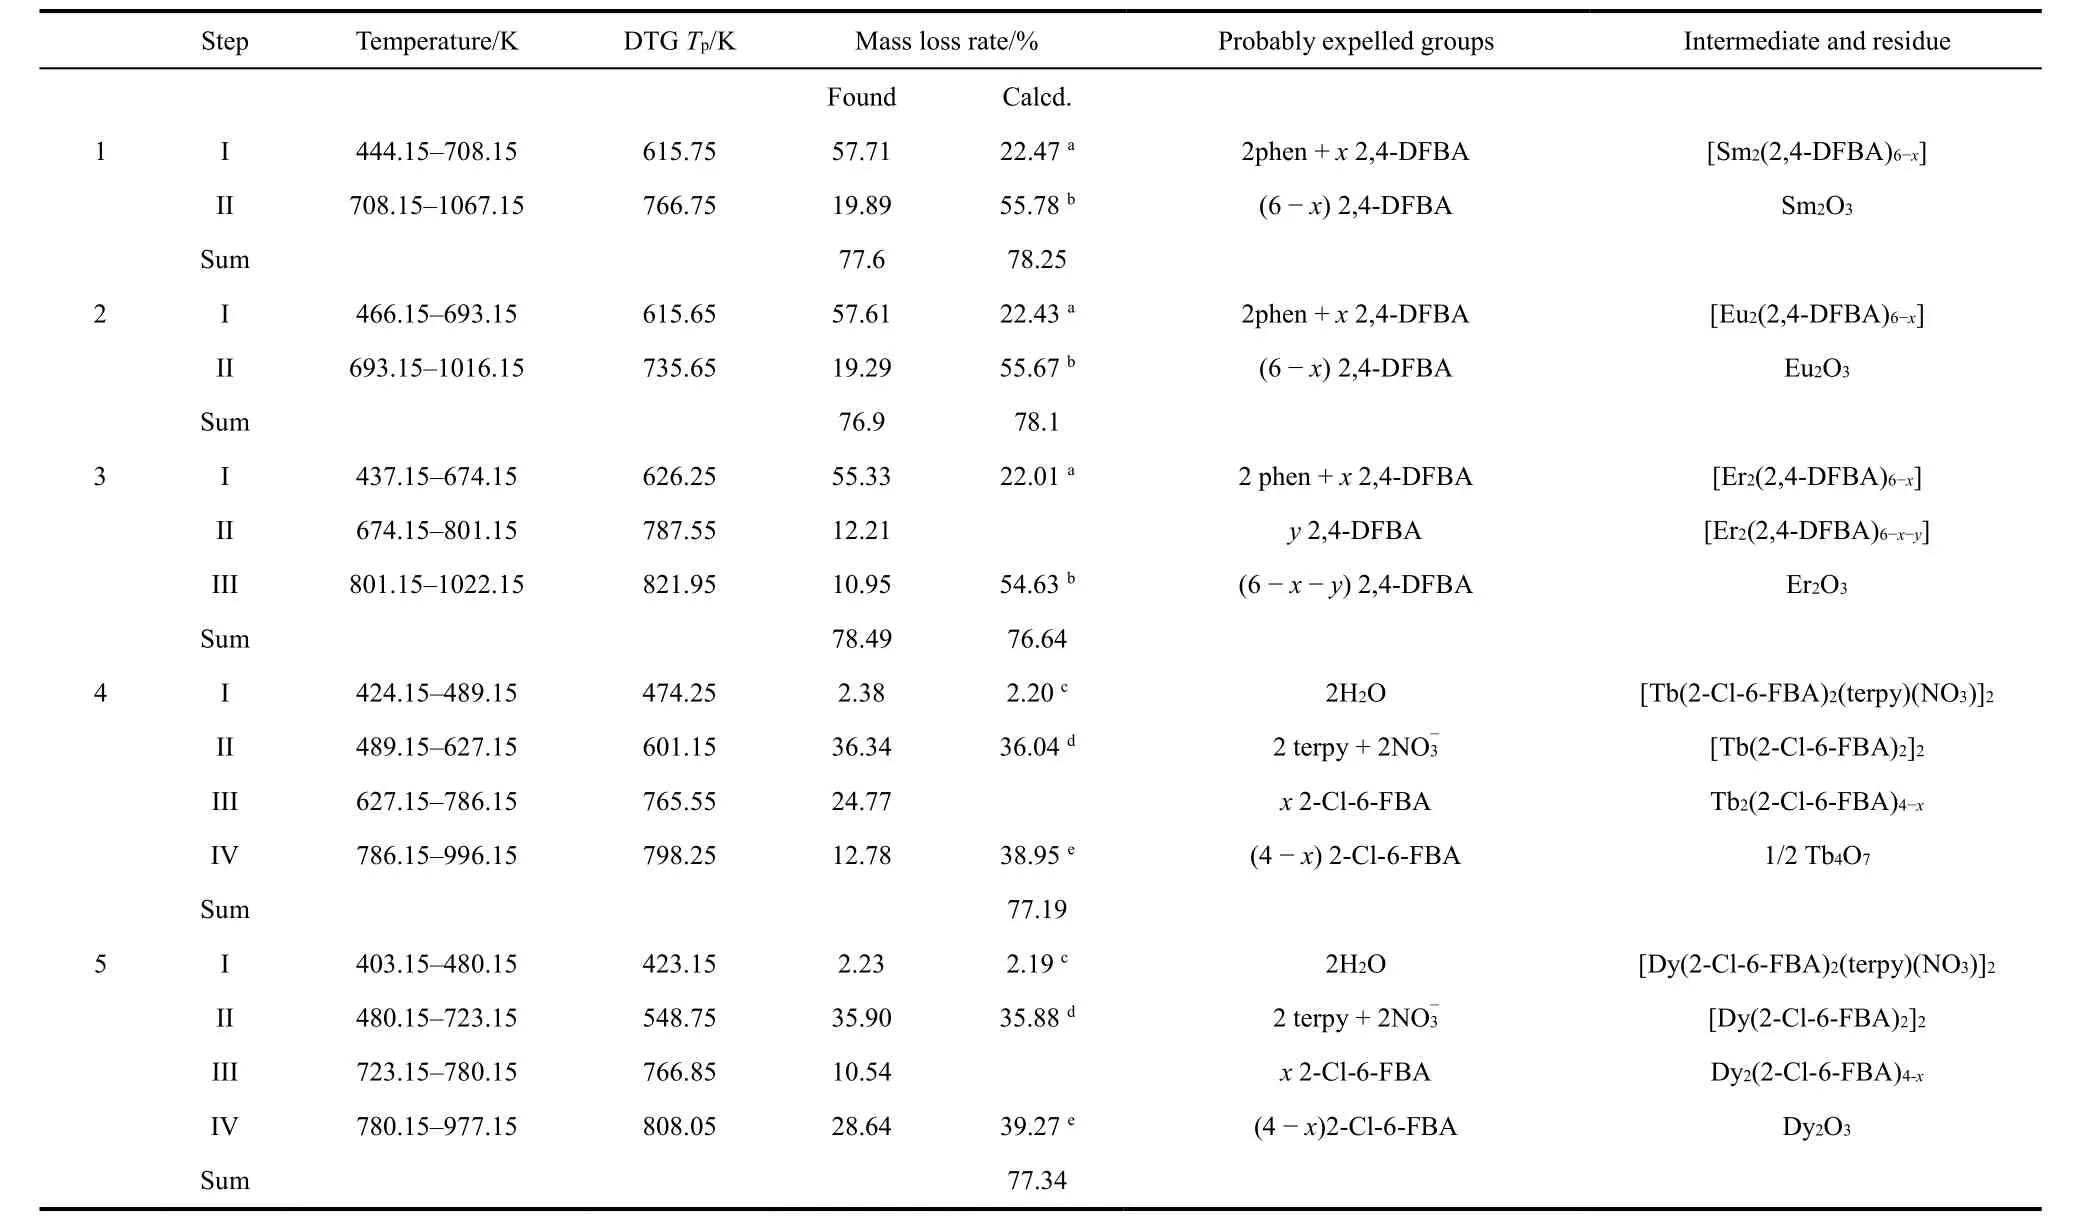
Table 2 Thermal decomposition values for complexes 1-5 at various stages.
3.5 Fluorescent properties
As a result of having unique fluorescent properties, lanthanide metal complexes are commonly used in producing various luminescent materials11. The solid-state fluorescence of complexes 1, 2, 4 and 5 were measured at room temperature.Different characteristic leap peaks were observed for different central metal ions. The similarity lies in the apparent broadband absorption of the excitation spectrum caused by the π-π* electron leap of the organic ligand37. The best excitation wavelengths(Sm: 362 nm, Eu: 353 nm, Tb: 354 nm, Dy: 353 nm) were chosen to obtain the corresponding emission spectra, and all the four complexes showed obvious characteristics of jump peaks (Figs.6–9).
Complex 1:4G5/2→6H5/2,4G5/2→6H7/2, and4G5/2→6H9/238,39,located at 563 nm, 598 nm, and 645 nm, respectively, where4G5/2→6H7/2is the strongest jump peak, which is the main reason for the orange-red fluorescence of Sm(III).
Complex 2:5D0→7F0,5D0→7F1,5D0→7F2,5D0→7F3,5D0→7F438, located at 579 nm, 593 nm, 615 nm, 651 nm, 700 nm, respectively. Since5D0→7F0and5D0→7F3are forbidden40, resulting in a low and negligible jump peak.According to this observation, there is little symmetry in Eu(III)in the complex36. The strongest jump peak of5D0→7F2at 615 nm is the main cause of the red glow41of Eu(III) complexes.Due to the strong fluorescence nature of Eu(III), the fluorescence lifetime was investigated and the fluorescence decay curve was obtained (Fig. 10a). The fluorescence lifetime is 1.288 ms calculated by the formula (i), which is expected to become a novel red fluorescent material.
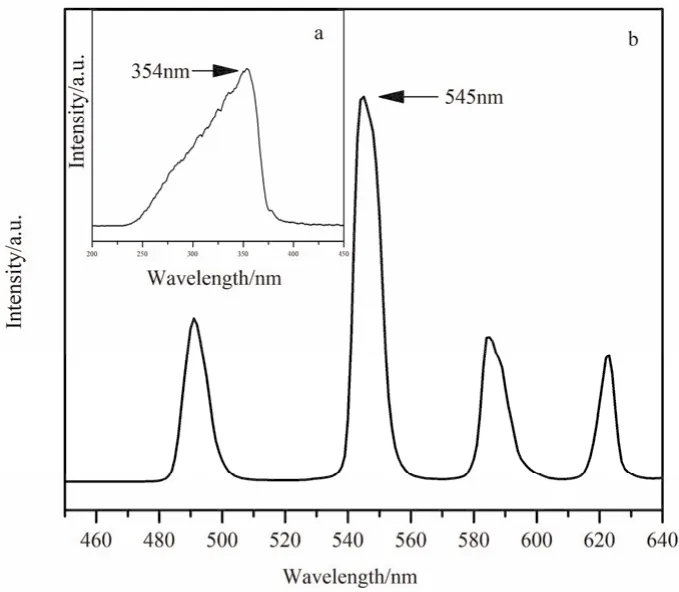
Fig. 8 Fluorescence spectrum of complex 4.
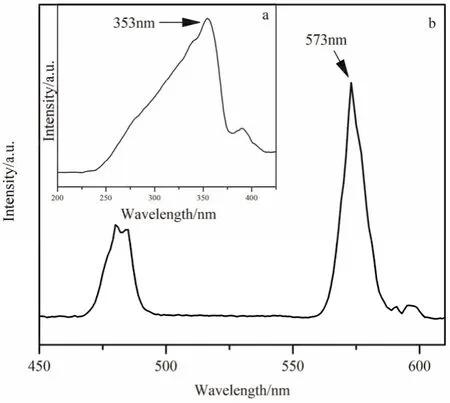
Fig. 9 Fluorescence spectrum of complex 5.

Complex 4:5D4→7F6,5D4→7F5,5D4→7F4,5D4→7F338at 491 nm, 545 nm, 585 nm, 623 nm, respectively. Among them,5D4→7F5at 545 nm is the strongest jump peak, which is the main reason for the green fluorescence42of Tb(III). The fluorescence decay curve is shown in Fig. 10b. The fluorescence lifetime calculated by the above equation (i) is 0.648 ms.
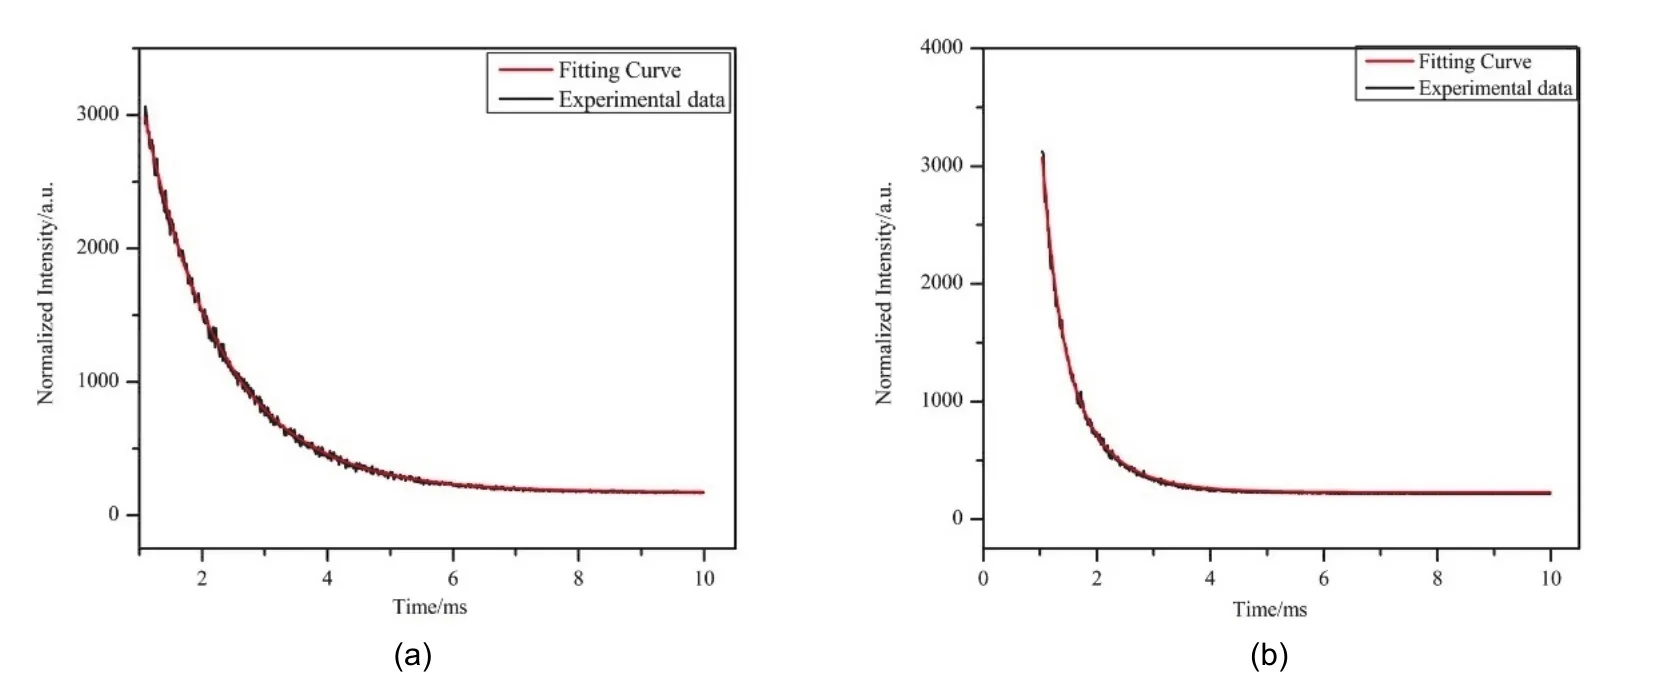
Fig. 10 Fluorescence lifetime decay curves of complexes 4 (a) and 5 (b).
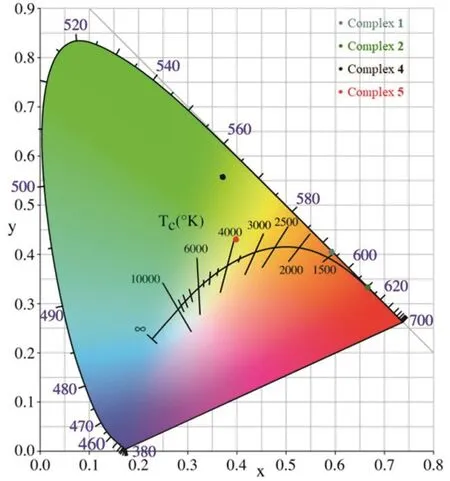
Fig. 11 Color coordinates of complexes 1, 2, 4 and 5.
Complex 5:4F9/2→6H15/2and4F9/2→6H13/238, located at 481 nm and 573 nm, respectively. The strongest jump peak of4F9/2→6H13/2at 573 nm is the main reason for the yellow43fluorescence of Dy(III).
To corroborate the correctness of the luminescent colors, the emission spectra of complexes 1, 2, 4, and 5 were substituted into the CIE color coordinate, which showed the color regions(Fig. 11) of orange-red (0.5930, 0.4059), red (0.6670, 0.3328),green (0.3719, 0.5570), and yellow (0.3992, 0.4311),respectively. The correctness of the above analysis was confirmed.
4 Conclusion
In summary, the ambient solution volatilization method successfully synthesized five novel complexes: [Ln(2,4-DFBA)3(phen)]2(Ln = Sm 1, Eu 2, Er 3, 2,4-DFBA = 2,4-difluorobenzoate, phen = 1,10-phenanthroline), [Ln(2-Cl-6-FBA)2(terpy)(NO3)(H2O)]2(Ln = Tb 4, Dy 5, 2-Cl-6-FBA = 2-chloro-6-fluorobenzoate, terpy = 2,2′:6′2′′-tripyridine). They belong to the monoclinic crystal system with space group P21/n.The difference is that the five complexes are divided into three different structures, mainly reflected in the different coordination modes and the different forces of the twodimensional faceted supramolecular structures. The thermal decomposition of the complexes was investigated using an IR-thermogravimetric linkage technique. In each decomposition stage, intermediate complexes are identified, and metal oxides are the final products. Finally, the solid-state fluorescence of complexes 1, 2, 4 and 5 were investigated, all exhibiting distinctive characteristic ion emission peaks. The fluorescence lifetimes of complexes 2 and 4 were calculated to be 1.288 and 0.648 ms, which is expected to become a novel type of luminescent material.
Supplementary data: Crystallographic data for the structure reported in this paper are deposited in the Cambridge Crystallographic Data Center (CCDC 2181666(1); CCDC 2181664(2); CCDC 2181662(3); CCDC 2181670(4); CCDC 2181668(5).)
Supporting Information: available free of charge via the internet at http://www.whxb.pku.edu.cn.
Declaration of Competing Interest: The authors declare that they do not have any known financial interests or relationships that might have influenced their work.
猜你喜歡
小學科學(學生版)(2021年3期)2021-04-13 08:26:20
科技知識動漫(2017年7期)2017-08-09 19:52:45
科技知識動漫(2017年5期)2017-05-11 21:34:16
科技知識動漫(2017年4期)2017-04-15 22:24:55
科技知識動漫(2017年2期)2017-02-06 20:59:46
科技知識動漫(2016年10期)2016-10-18 20:35:00
中學生天地(C版)(2016年2期)2016-08-23 12:06:30
考試周刊(2016年63期)2016-08-15 22:51:06
中學生數理化·中考版(2015年12期)2015-09-10 07:22:44
發明與創新(2015年25期)2015-02-27 10:39:25
