Biased random walk with restart for essential proteins prediction
2022-11-21 09:30:30PengliLu盧鵬麗YuntianChen陳云天TengZhang張騰andYonggangLiao廖永剛
Chinese Physics B 2022年11期
Pengli Lu(盧鵬麗) Yuntian Chen(陳云天) Teng Zhang(張騰) and Yonggang Liao(廖永剛)
1School of Computer and Communication,Lanzhou University of Technology,Lanzhou 730050,China
2China Mobile Communications Group Gansu Co.,Ltd.,Lanzhou 730070,China
Predicting essential proteins is crucial for discovering the process of cellular organization and viability. We propose biased random walk with restart algorithm for essential proteins prediction,called BRWR.Firstly,the common process of practice walk often sets the probability of particles transferring to adjacent nodes to be equal,neglecting the influence of the similarity structure on the transition probability. To address this problem,we redefine a novel transition probability matrix by integrating the gene express similarity and subcellular location similarity. The particles can obtain biased transferring probabilities to perform random walk so as to further exploit biological properties embedded in the network structure. Secondly,we use gene ontology(GO)terms score and subcellular score to calculate the initial probability vector of the random walk with restart. Finally, when the biased random walk with restart process reaches steady state, the protein importance score is obtained. In order to demonstrate superiority of BRWR,we conduct experiments on the YHQ,BioGRID,Krogan and Gavin PPI networks. The results show that the method BRWR is superior to other state-of-the-art methods in essential proteins recognition performance. Especially,compared with the contrast methods,the improvements of BRWR in terms of the ACC results range in 1.4%–5.7%, 1.3%–11.9%, 2.4%–8.8%, and 0.8%–14.2%, respectively. Therefore, BRWR is effective and reasonable.
Keywords: PPI network,essential proteins,random walk with restart,gene expression
1. Introduction
Protein is an important component of all cells and tissues of the human body.[1]Essential proteins are indispensable for organisms survival and evolution.[2]Essential proteins prediction not only sheds light on revealing the structure and function of genes,but also provides importance guidance in the study of disease diagnosis and drug targets.[3–5]In biomedicine field, many methods based on biological experiments have been proposed to predict essential protein,such as single-gene knockout,[6]RNA interference,[7]and conditional gene knockout.[8]These methods have made great contributions in helping people understand cells and in research of new drugs.[9]These traditional experimental procedures can provide an accurate prediction but suffered from huge cost and time consuming.
In recent years, a variety of biological datasets, such as genomics, proteomics, transcriptomics, and gene ontology (GO) data have been obtained by high-throughput experiments, for instance, two-hybrid systems, mass spectrometry, and protein micro-arrays. At the same time, centralitylethality[10]rule shows that proteins with highly connected neighbors tend to be essential. Thus, many complex network centrality methods have been successfully devoted to essential protein prediction problem,such as degree centrality(DC),[11]betweenness centrality(BC),[12]subgraph centrality(SC),[13]eigenvector centrality(EC),[14]local average center(LAC),[15]network centrality (NC),[16]and multi-order K-shell vector(MKV).[17]However,the above-mentioned methods only consider the topology features[18]of the network and ignore the inherent biological significance of essential proteins,[19]which results in undesirable performance. Actually,biological information is critical for the identification of essential proteins,and there are a variety of biological dadasets that can be used.Therefore,how to integrate the PPI networks and some kinds of biological dadasets to improve the efficiency and accuracy of essential proteins prediction is also a challenge. Currently,some researchers try to use the biological information to essential protein prediction algorithm, such as GO terms,[20]subcellular localization,[21]gene expression sequence,[22,23]protein complexes information,[24]and other biological information. The GEG[25]method is based on semantic similarity and gene expression sequence. The united complex centrality(UC)[24]method considers the number of protein appearances in the complexes. The LIDC[26]method combines network local action with protein complexes information. PeC[22]and Wdc[27]integrate network topology characteristics and gene expression sequence. UDoNC[28]by integrating the protein domain data with PPI data improves the efficiency distinctly.However, it still has large development space for accurately predicting essential proteins.
As an optimization algorithm, random walk (RW)has been widely used in link prediction,[29]recommender systems,[30]ranking,[31]community detection,[32–34]and transmission dynamics.[35]The essential proteins prediction method EssRank[36]was developed based on the PageRank[37]model,which is a web ranking algorithm based on RW.[38]The DEP-MSB[39]method was designed also based on PageRank,which integrates a variety of biological information and six centrality methods. In the traditional random walk, the transition probability of a walker from the current vertex to the next vertex is equal. However, due to the complex diversity of the protein network structure and the protein itself contains complex biological characteristics,the walker in the transition process will be affected by the neighbors’ proteins, and not necessarily an equal probability of movement.[40]Based on the above description,we propose a biased random walk with restart method named BRWR for the prediction of essential proteins. In algorithm BRWR, first we define a novel similarity adjacency matrix and reconstruct the transition probability matrix,which makes the walker moved towards similar neighbors with a high probability from the initial vertex when walker moves to the adjacent vertices. In addition,we use GO terms score and subcellular score to calculate the initial probability vector of the random walk with restart. Finally, when BRWR process reaches steady state,we can obtain a score vector for proteins and the top prioritized proteins are regarded as the candidate essential proteins. To assess the performance of our algorithm BRWR,we compare our algorithms with other previous algorithms on protein data set BioGRID,YHQ,Krogan and Gavin. The results through different evaluation measures indicate that BRWR outperforms the state-of-the-art approaches with stable performance for identifying the essential proteins.
2. Related work
2.1. PPI network
The PPI network can be abstracted and formularized as an unweighted and undirected graphG=(V,E), whereVis the vertex set corresponding to proteins,Eis the edges set denoting the interactions between proteins. There aren=|V|proteins andm=|E|edges in the PPI network. The adjacency matrix of the PPI network, denoted byA, is then×nmatrix whose(i,j)-entry is 1 ifvi~vj,and it is 0 otherwise.Letd(vi)be the degree of vertexvi.Ddenotes the degree diagonal matrix with diagonal entriesd(v1),d(v2),...,d(vn). LetΓ(vi)be the neighbor set of vertexvi,and|Γ(vi)|=d(vi).
2.2. Transition probability matrix
Consider a random walk onG:start at a vertexvi;if at thet-th step the walker is at a vertexvti,it moves to a neighbor ofvtiwith probability 1/d(vti). Clearly, the sequence of random vertices (vti:t=0,1,...) is a Markov chain. The transmission matrix is defined asM=AD-1.[38]Give a distributionPt,the rule of the walk can be expressed byPt+1=M×Pt.The transition matrix of other type random walk,like lazy random walk,[41]can be described asM=(1/2)(I+AD-1).In Ref. [34] to calculateM, the authors used normalization of the matrix(A+I)such that the sum of probability in each column is 1 and definedM=(I+A)(I+D)-1. Adding an identity matrix to the adjacency matrix can avoid self-loops in graph. Therefore,the degree of each vertex is incremented by 1 to provide aperiodicity in the graph. Based on the above description,we propose a new biased transition probability matrix(BM)in the next section.
3. Method
The random walk with restart(RWR)-based method fully uses the global topological information of PPI network. In our paper,first we process a variety of protein biological information,use it to judge the similarity between proteins in the network,and reconstruct the transition probability matrix,which makes the random walk biased,so as to better mine the global topological properties of proteins. Second, we use GO terms score and subcellular score to construct the initial probability vector of RWR. The overall process of the BRWR algorithm is shown in Fig.1.
3.1. Similarity transition probability matrix
The traditional adjacency matrix is determined by considering whether there is an edge between vertices in the network and if a walker selects the neighbors randomly, which ignores the influence of functionally similar neighbors on vertex. Therefore,we use gene expression sequence and subcellular location information to redefine the transition probability matrix,which makes the walker tend to its more similar neighbors during random walks.
(i)Gene express similarity
The gene expression data of proteins were divided into three cycles, each characterized by 12 time points, which is denoted asT={g1,g2,...,g12,...,g24,...,g36}, whereT(i)is the gene expression of a protein at timei(i ∈[1,36]). We use 3-σprinciple to calculate the threshold,which can be used to determine whether a protein is active. The 3-σformula for the threshold can be written as
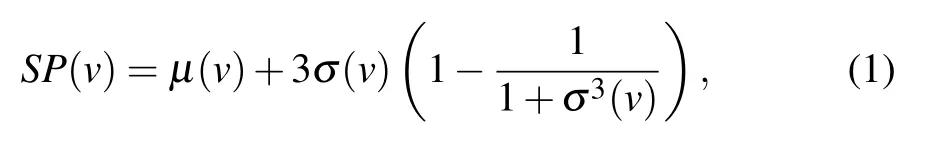
whereμ(v) andσ(v) are the mean and variance of proteins gene expression value from time 1 to 36,respectively.
In order to compare the gene expression value of each time with the threshold, we calculate the mean value of the gene expression value at 36 time points in 3 cycles. According to the periodicity of gene expression data,the gene expression average valueATIat each time point is of the three cycles and can be calculated as follows:

Then, if the average valueATIof gene expression at timeIis greater than the threshold SP, it is considered to be active at timeI. For two adjacent proteins to be active at least at one same time point during the 12 time points,we assume that they are similar.
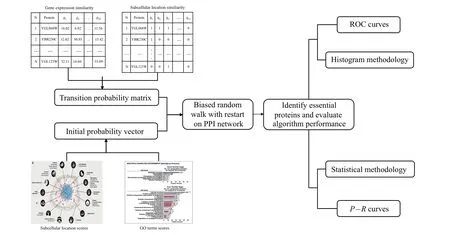
Fig.1. The overall flow of BRWR.
(ii)Subcellular location similarity
Moreover, in subcellular location information, which contains 11 subcellular information, including: cytoskeleton,plasma, nucleus, endosome, extracellular, golgi, mitochondrion, peroxisome, endoplasmic, vacuole, cytosol. If two adjacent proteins appear in the same subcellular,we assume that they have the same function. Thus they are similar.
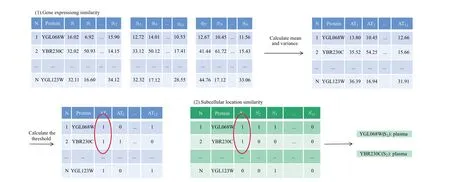
Fig.2. The similarity of gene expression and subcellular location.
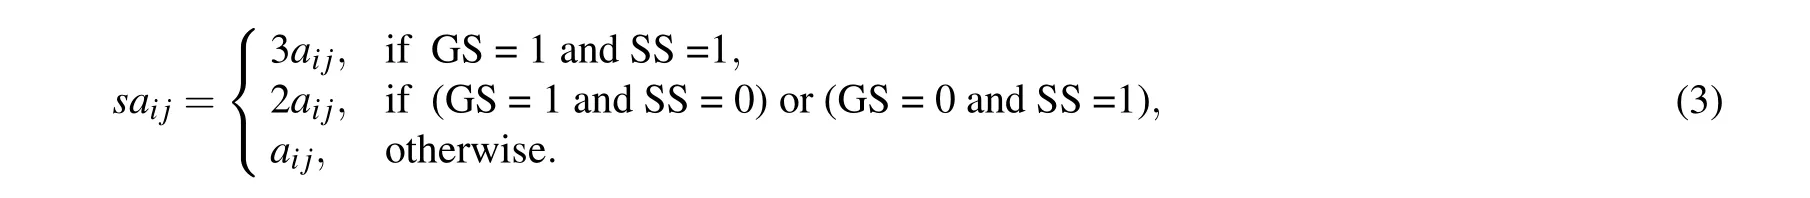
For example, as shown in Fig. 2, we assume that YGL068W and YBR230C are two interacting proteins. Both YGL068W and YBR230C are active atAT3. Meanwhile,YGL068W and YBR230C are located in the same subcellular plasma. Thus YGL068W is similar to YBR230C. In this paper, we use the value of GS (gene-similar) to indicate whether two adjacent proteins have gene expression similarity. IfGSij=1,we assume thatiandjhave gene expression similarity, and ifGSi j=0, we assume thatiandjhave no gene expression similarity. Like gene expression similarity,we use SS(subcellular-similar)to denote the functional similarity of subcellular location. If SSi j=1,we assume thatiandjhave functional similarity, and if SSi j=0, we assume thatiandjhave no functional similarity. Finally, if two adjacent proteins are active at least one same point and have the same function,we will think that they are strong similar. If two adjacent proteins are active at least at one same point or have the same function, we will think that they are similar, If two adjacent proteins are active at different point and do not have same function, we will think that they are dissimilar. Based on the above assumptions, we can calculate theSA(similar adjacency matrix),SD(similar degree matrix)andBM(biased transition matrix). For instance, the similarities of gene expression and subcellular location are shown in Fig.2.
Definition 1 The similar adjacency matrix of the network is denoted bySA ∈Rn×n,wheresaijis defined as follows:
Definition 2 The similar degree matrix is denoted bySD ∈Rn×n,wheresdi jis defined as follows:
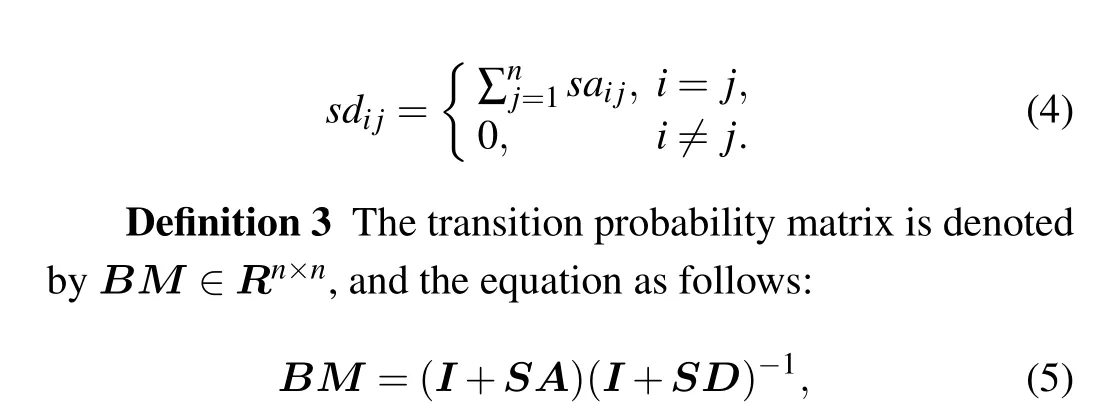
where each element ofBMrepresents the probability of remaining in the current vertex or transiting to its neighbors.
3.2. Initial protein score vector
In this section, we take advantage of the initial protein scores to denote the initial probability vector of the random walk with restart. We use GO terms score and subcellular scores to calculate the initial protein scores.
(i)GO terms score(GOS)
GOS is a biological resource which describes the functional properties of genes. The more the same GO terms the two interacting proteins have,the more similar their functions will be. We obtain the relationship between proteins essentiality and GO terms by analyzing the correlation of GO terms between two interacting proteins. GOS is defined as the sum of the protein and its neighbors belong to the same cluster.

whereGOiandGOjare the GO terms of proteinsviandvj,respectively;|GOi| and|GOj| are the numbers of GO terms annotating of proteinsviandvj,respectively;|GOi ∩GOj|denotes the number of GO terms intersection ofGOiandGOj.
(ii)Subcellular scores(SC)
There are 11 subcellular locations,and proteins in different subcellular locations have different functions. The number of proteins in different compartments is different, and the essential proteins in different compartments are also different.In addition,a protein can present in different compartments at the same time.[42]The value of SC is calculated by the ratio ofSc(I)toSctotal,
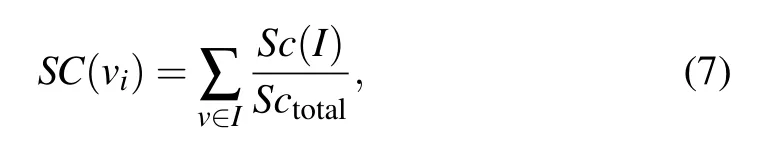
whereSc(I)(I ∈{1,2,3,...,11})denotes the number of proteins appearing in theIthsubcellular location andIrepresents the 11 subcellular,Sctotaldenotes the total number of proteins appearing in all subcellular locations. In this scores vector,since proteins in different networks are distributed differently in subcellulars,each network corresponds to one different SC.
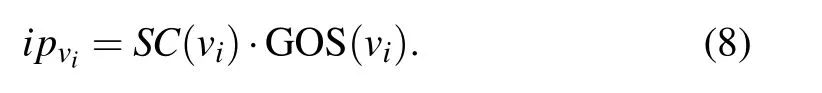
Definition 4 The initial scores of proteins is denoted asIP ∈Rn×1, each element represents the initial scores of a protein,andipvican be calculated by
3.3. Essential proteins prediction based on biased random walk with restart
RWR is a significant prioritization algorithm,[43]which has been used for gene as well as protein complex prioritization in previous studies.[44,45]In the RWR algorithm,random walks start from the seed vertex and move to the direct neighbors or get back to the seed vertex randomly. RWR can be denoted as the following formula:

whereP0is the initial probability vector;Ptis a probability vector to reach each vertex at stept(P ∈Rn×1);αis the restart probability; andM(M ∈Rn×n)is the transition matrix,in whichMijdenotes the probability from vertexvitransit tovj. Eventually,the process gets to steady state until condition||Pt+1-Pt||<εholds.
In a random walk, the transition probability of walker from the current vertex to the next vertex is equal. Due to the fact the interaction relationship between two proteins in the protein network is not generated randomly, the transition process will be affected to a certain extent. The protein itself has complex biological characteristics,therefore transiting between vertices is not necessarily an equal probability movement, but a biased movement. Based on the above problems,we use the proposedBMas the transition probability matrix.The global algorithm of the RWR model is used to identify essential proteins, and the ranking scores of proteins can be calculated by

whereBRT=(BR(v1),BR(v2),...BR(vn)),untilεmeets the preset conditions, the BRWR process reaches a steady state.In this paper, we assumeε=10-6. Algorithm 1 gives the description of BRWR.
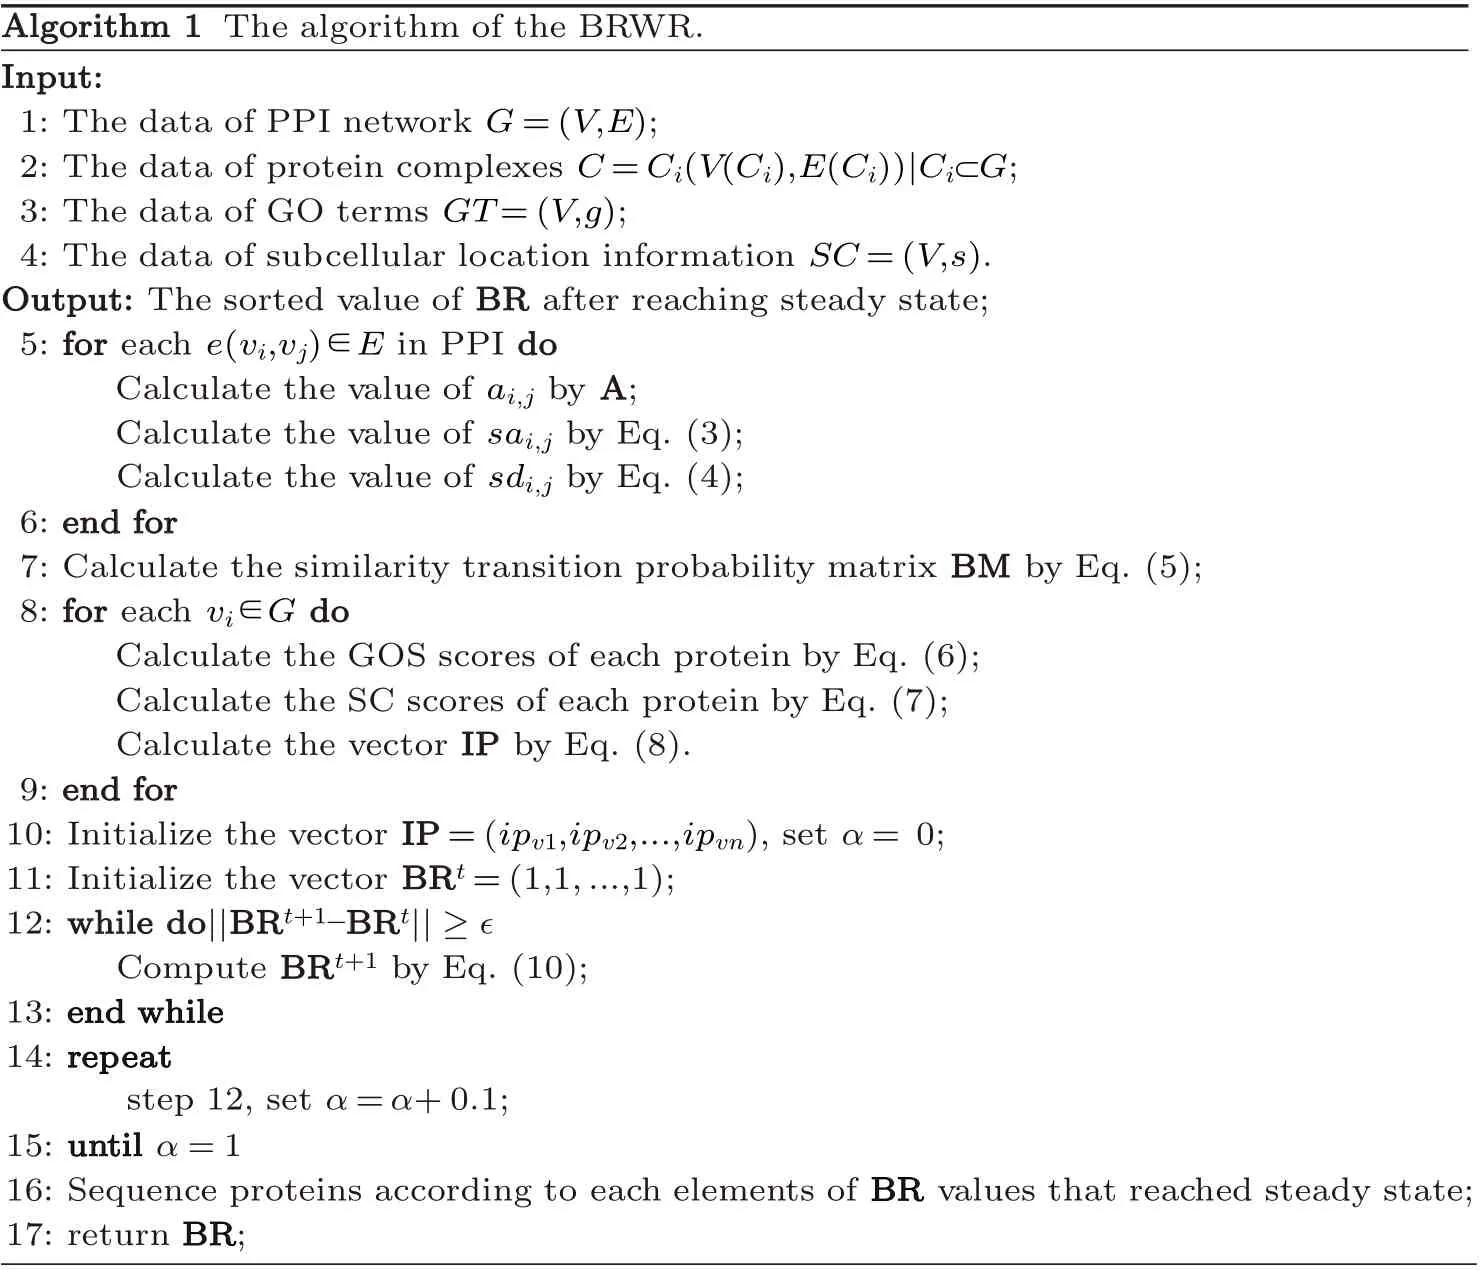
Algorithm1 The algorithm of the BRWR.Input:1: The data of PPI network G=(V,E);2: The data of protein complexes C=Ci(V(Ci),E(Ci))■Ci?G;3: The data of GO terms GT=(V,g);4: The data of subcellular location information SC=(V,s).Output:after reaching steady state;5: for The sorted value of BR each e(vi,vj)∈E in PPI do Calculate the value of ai,j by A;Calculate the value of sai,j by Eq. (3);Calculate the value of sdi,j by Eq. (4);6: endfor 7: Calculate the similarity transition probability matrix BM by Eq. (5);8: for each vi∈G do Calculate the GOS scores of each protein by Eq. (6);Calculate the SC scores of each protein by Eq. (7);9: endfor Calculate the vector IP by Eq. (8).=(ipv1,ipv2,...,ipvn), set α=0;11: Initialize the vector BR 10: Initialize the vector IP t=(1,1,...,1);12: while do■■BR t■■≥∈13: endwhile t+1-BR Compute BR t+1 by Eq. (10);14: repeat step 12, set α=α+0.1;α=1 16: Sequence proteins according to each elements of BR 15: until values that reached steady state;17: return BR;
4. Datasets and evaluation settings
4.1. Datasets
In order to evaluate the performance of the algorithm BRWR,we consider the PPI data of saccharomyces cerevisiae(yeast)protein as one of experimental materials, because this organism has relative complete,reliable PPI and essential proteins data. We use four sets of PPI network data, including YHQ,[46]BioGRID,[47]Kroagn,[48]and Gavin.[49]The Kroagn, BioGRID and Gavin data are gathered from the BioGRID database,[47]the YHQ data was constructed by Yuet al.[46]After removing the multiple edges and self-interactions,the properties of the network are given in Table 1. The standard essential proteins data were gathered from four different databases: MIPS,[50]SGD,[51]DEG,[52]and SGDP.[2]The gene expression data were downloaded from GEO (gene expression omnibus)database.[53]The subcellular location data were downloaded from COMPARTMENTS database.[54]This data contains 11 subcellular location information. The GO terms data were cut-down version of the GO ontologies,available at(https://www.yeastgenome.org/).[55]
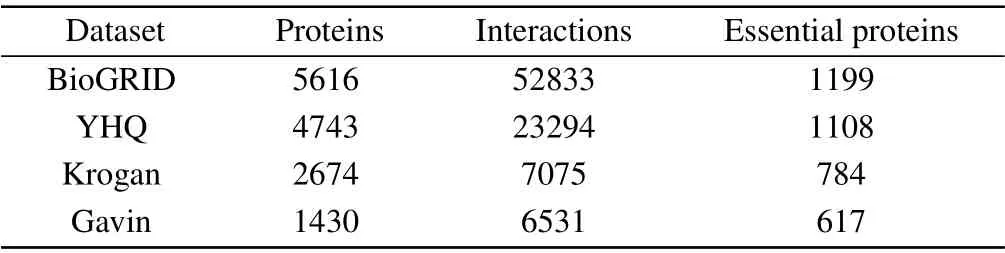
Table 1. Data details of the three protein networks: YDIP,YHQ,and Krogan,from BioGRID.
4.2. Evaluation settings
We compare BRWR with a number of existing methods.The proteins are ranked by the essentiality predicted by each method. Then,we select the top 25 percent proteins in the obtained sequence as candidate essential proteins and the remaining 75 percent were selected as candidates non-essential proteins. By comparing the selected top 25 percent proteins with the standard essential proteins dataset,we can get the number of candidate essential proteins that are truly identified as the essential proteins. True positive(TP)is the number of candidate essential proteins correctly identified as essential proteins.False negative(FN)is the number of candidate essential proteins that were incorrectly identified as non-essential proteins.False positive (FP) is the number of candidate non-essential proteins that were misidentified as essential proteins. True negative (TN) denotes the number of candidate non-essential proteins correctly identified as non-essential proteins.
5. Results
5.1. Parameter analysis
In our method of BRWR,the adjustment of parameter will affect the performance of BRWR,there are three parameters:α,kandt,whereαis related to the accuracy of the prediction results. To investigate the effect of parameterα, we evaluate the prediction accuracy by setting values ofαrange from 0.1 to 1;kis the topkpercent of ranked proteins;tis the iterations times of biased random walk in which the process reaches steady state. As shown in Table 2,the iterations timetdecreases whenαincreases. Through comparison,whenαis 0.5, 0.8, 0.6 and 0.7, respectively, the algorithm in networks YHQ,BioGRID,Kroagn and Gavin has best performance.
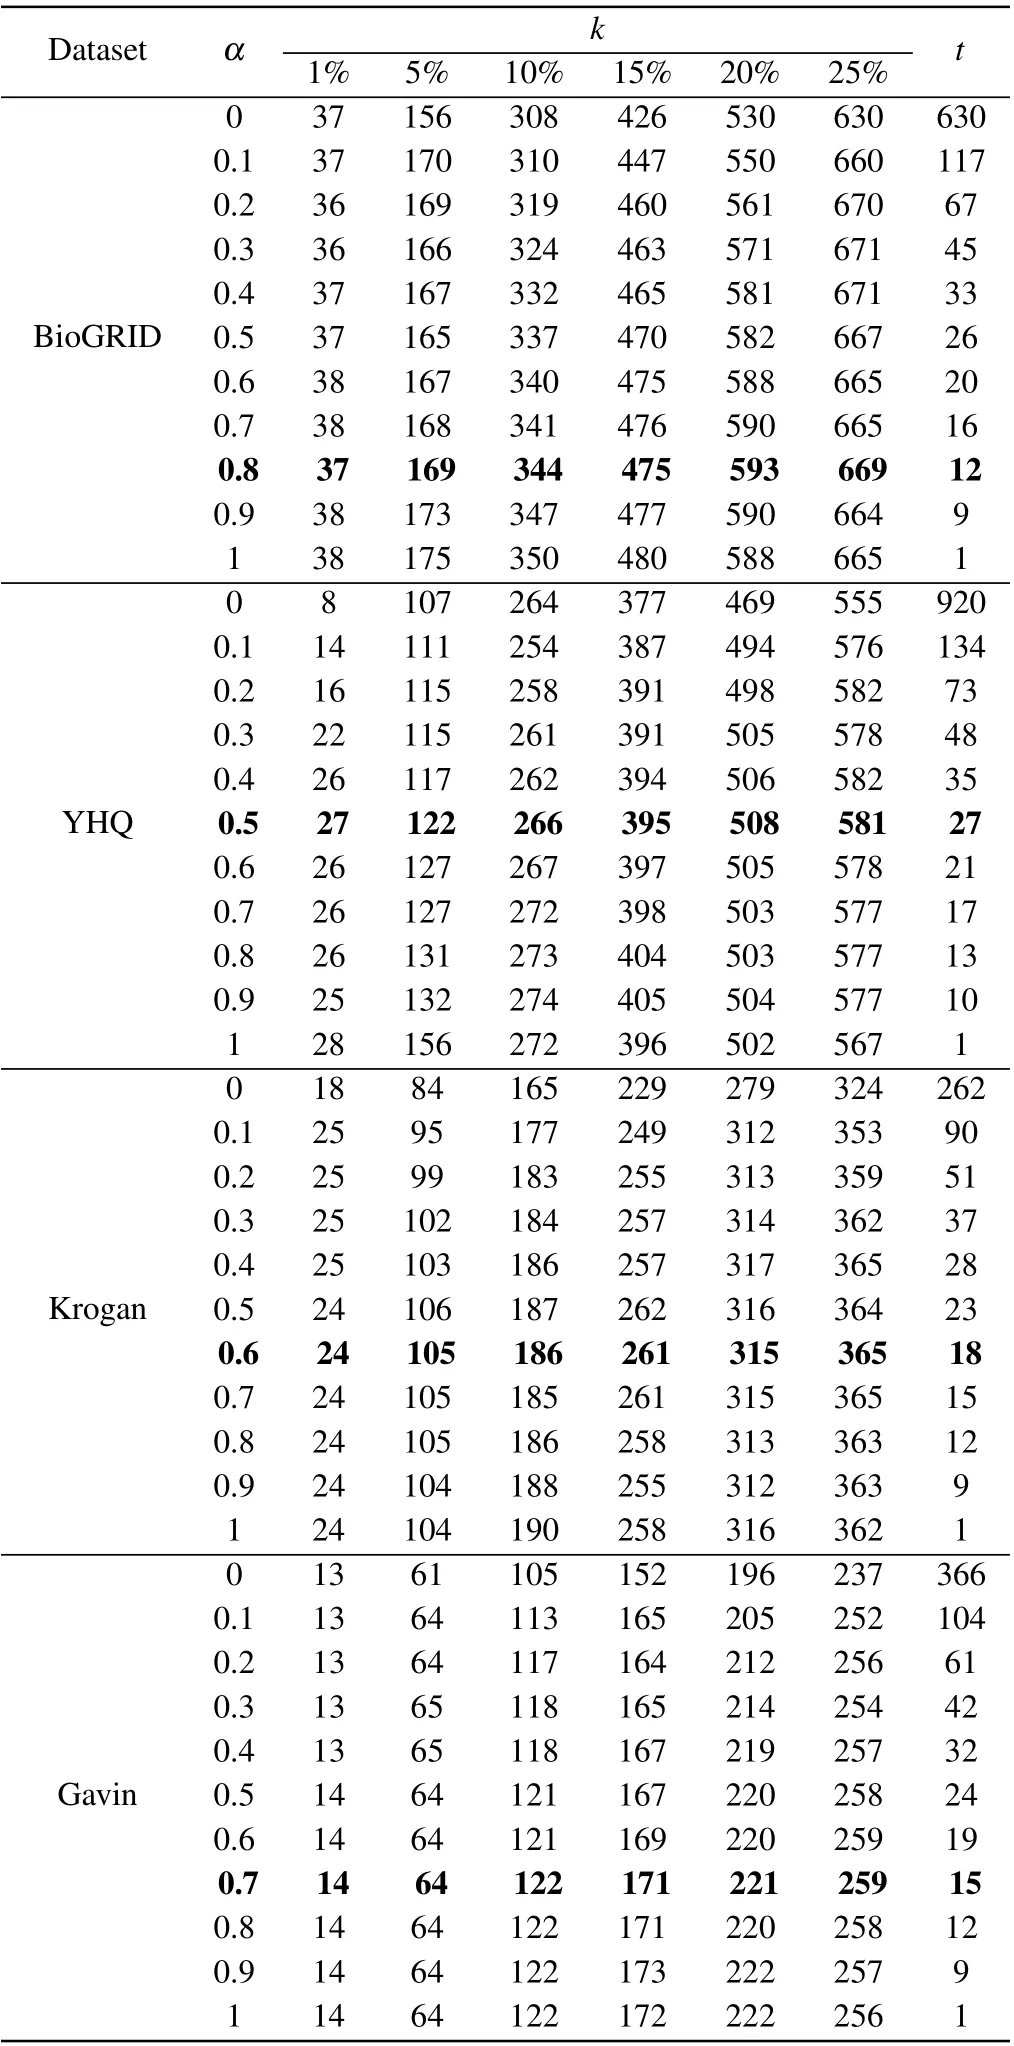
Table 2. Number of essential proteins predicted by BRWR for different α.
5.2. Validated by histograms
To verify the performance of BRWR,we compare it with other algorithms(BC,DC,SC,EC,LAC,UC,NC,PeC,Wdc)by histograms. First,we calculate the score according to each method, and rank the proteins in descending order. Then the top 1%,5%,10%,15%,20%and 25%proteins are selected as candidate proteins. Finally,the number of essential proteins in these candidate essential proteins is determined based on the standard data set of known essential proteins. The comparison results are shown in Figs.3–6.
Figure 3 shows the prediction results of each method on the BioGRID dataset. DC, BC, EC, SC, LAC, NC, UC, PeC and Wdc find out 598, 539, 324, 525, 621, 636, 532, 558 and 621 essential proteins at the top 25% candidates, respectively. Our algorithm BRWR discovers 669 essential proteins.Compared with other algorithms,the number of essential proteins predicted by BRWR on BioGRID dataset is significantly higher.
Figure 4 shows the prediction results of each method on the YHQ dataset. DC, BC, EC, SC, LAC, NC, UC, PeC and Wdc find out 539,548,511,479,542,538,518,491 and 538 essential proteins at the top 25%candidates,respectively. Our algorithm BRWR discovers 581 essential proteins. Compared with other algorithms, the number of essential proteins predicted by BRWR on YHQ dataset is significantly higher.
Figure 5 shows the prediction results of each method on the Krogan dataset. DC, BC, EC, SC, LAC, NC, UC, PeC and Wdc find out 318,248,285,284,326,325,319,321 and 333 essential proteins at the top 25%candidates,respectively.Our algorithm BRWR discovers 365 essential proteins. Compared with other algorithms, the number of essential proteins predicted by BRWR on Krogan dataset is significantly higher.
Figure 6 shows the prediction results of each method on the Gavin dataset. DC,BC,EC,SC,LAC,NC,UC,PeC and Wdc find out 221,172,157,210,254,252,232,234 and 247 essential proteins at the top 25%candidates,respectively. Our algorithm BRWR discovers 259 essential proteins. Compared with other algorithms, the number of essential proteins predicted by BRWR on Gavin dataset is significantly higher.
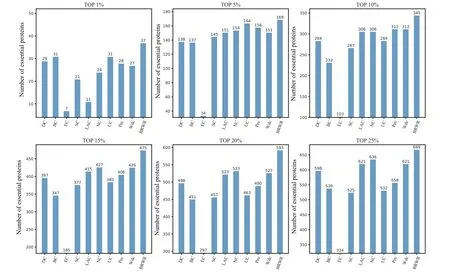
Fig. 3. Comparison of the number of essential proteins detected by BRWR and other nine previous centrality measures from the BioGRID network.
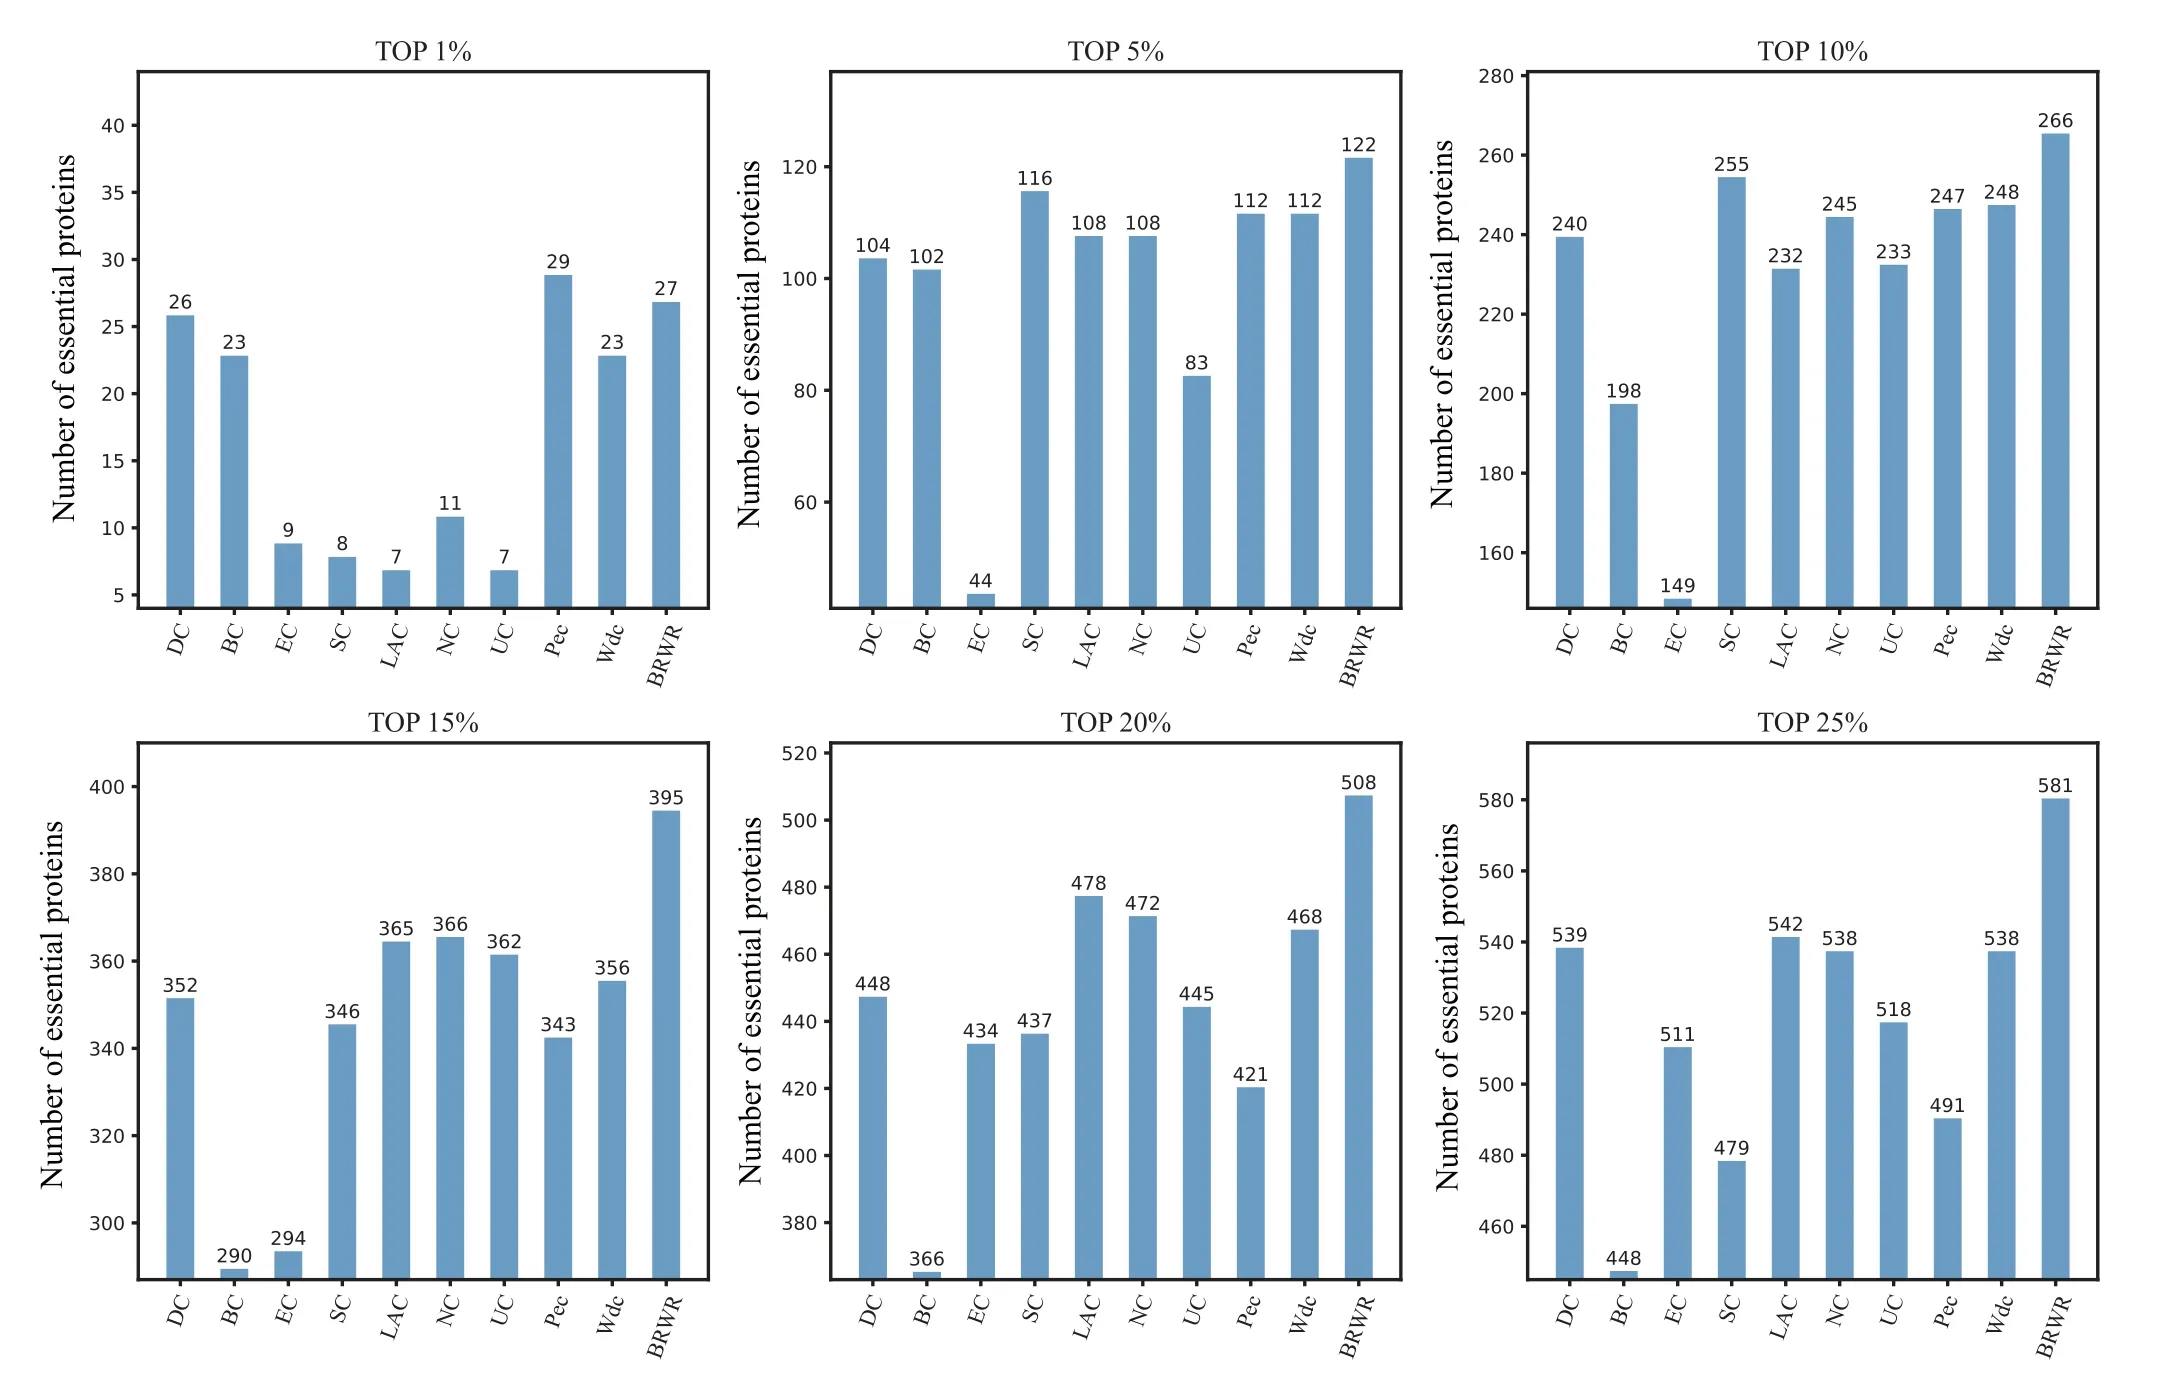
Fig.4. Comparison of the number of essential proteins detected by BRWR and other nine previous centrality measures from the YHQ network.
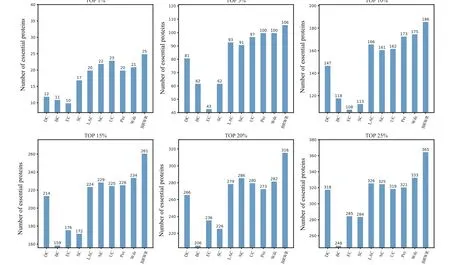
Fig. 5. Comparison of the number of essential proteins detected by BRWR and other nine previous centrality measures from the Krogan network.
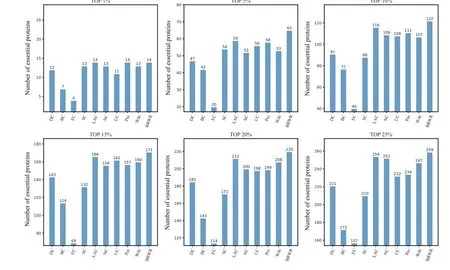
Fig.6.Comparison of the number of essential proteins detected by BRWR and other nine previous centrality measures from the Gavin network.
5.3. Validated by six statistical methods
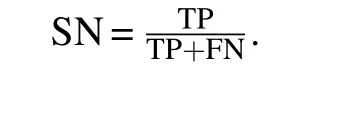
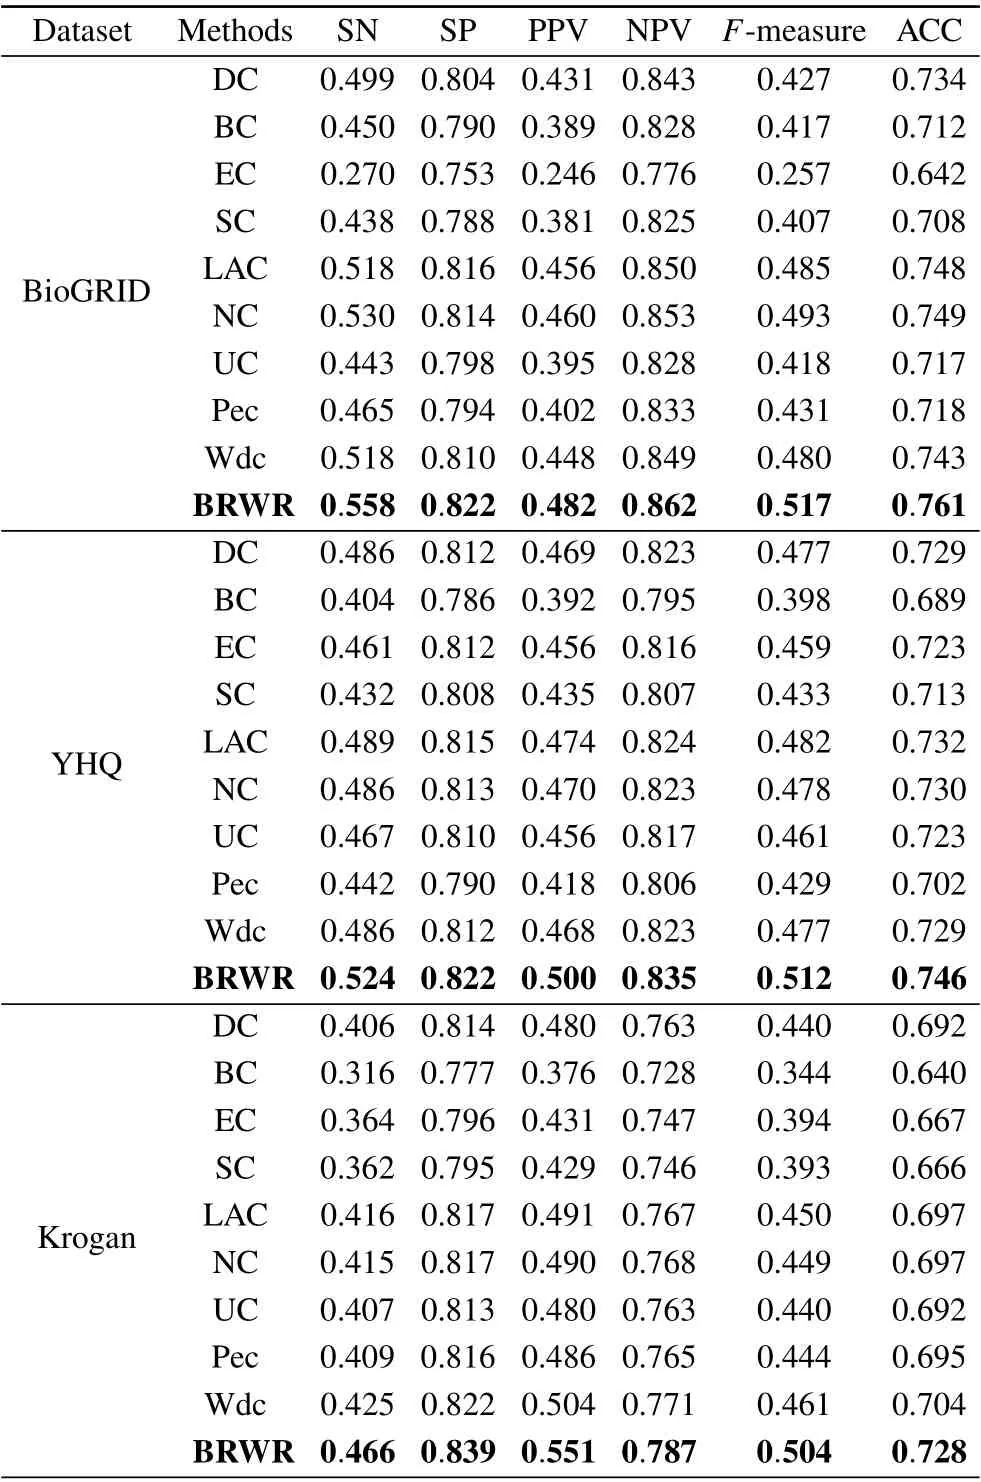
Table 3. Comparison of results of SN,SP,PPV,NPV,F-measure and ACC.
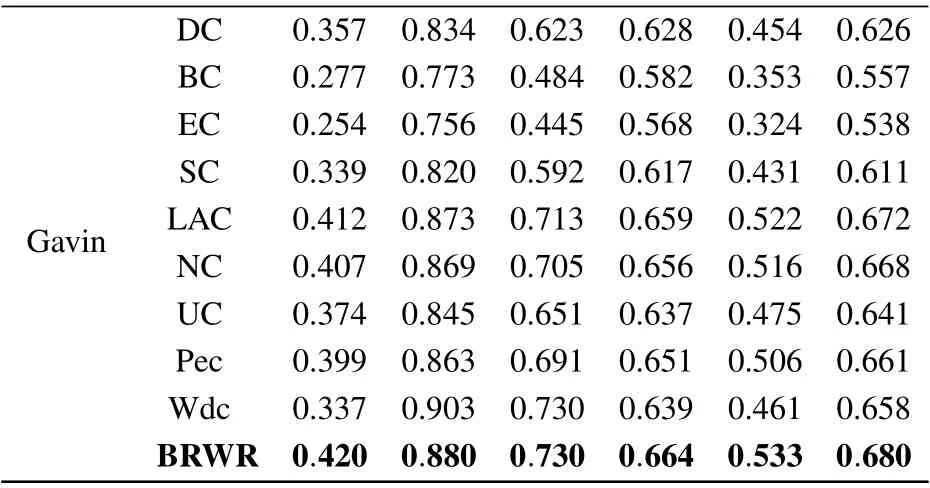
Table 3. (Continued).
The six statistical indicators of each method are calculated on BioGRID, YHQ, Krogan and Gavin datasets. As shown in Table 3,the six index values of our algorithm BRWR are all higher than those of the compared algorithms. Especially,the ACC values on BioGRID,YHQ,Krogan and Gavin datastes are 0.761,0.746,0.728,0.680,respectively.
5.4. Validated by the P–R curve
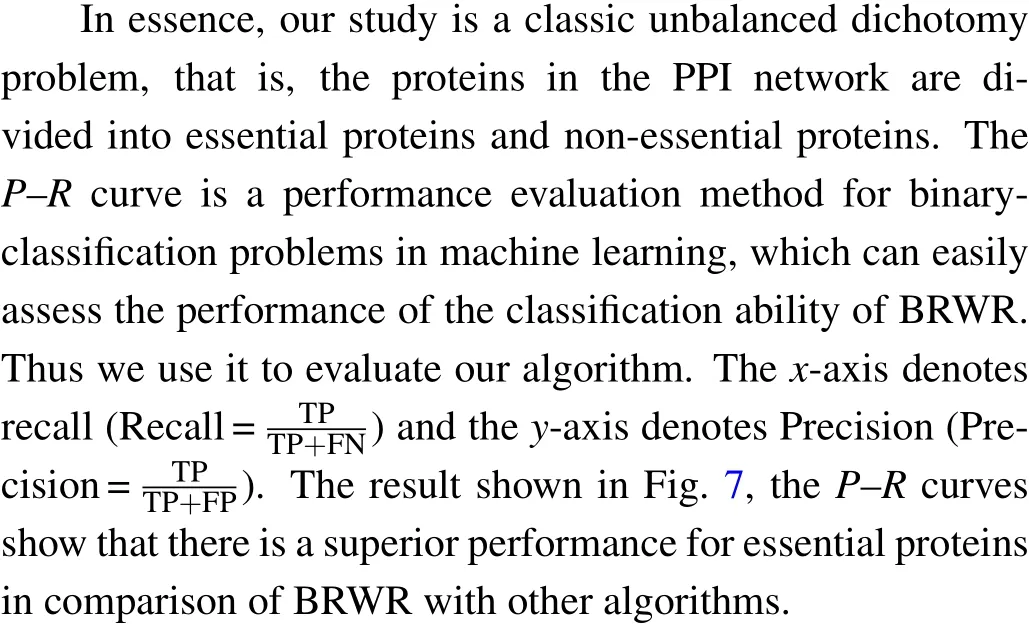
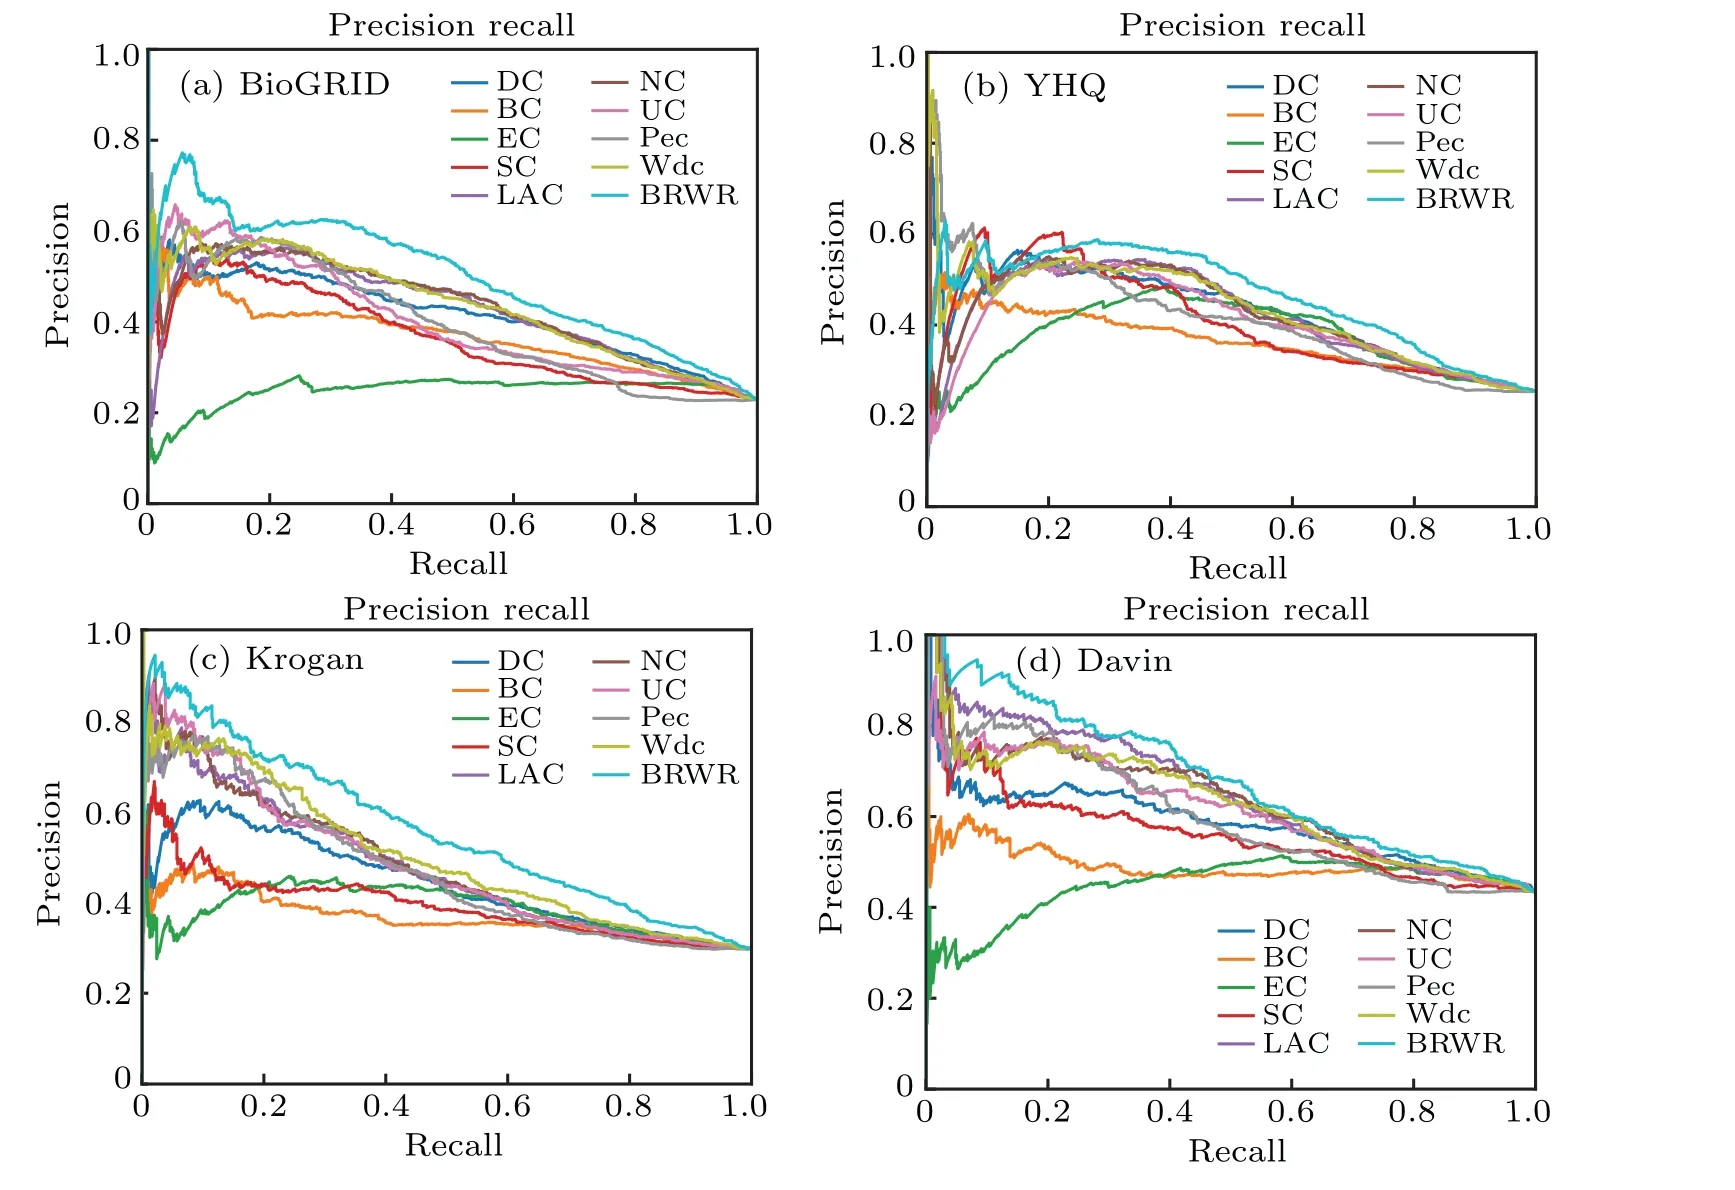
Fig.7. The performances of BRWR and other nine centrality measures on the BioGRID,YHQ,Krogan and Gavin datasets,validated by P–R curves.
5.5. Validated by the ROC curve
In addition,the ROC curve is a classic evaluation method.Thex-axis represents the false positive rate, they-axis represents the true positive rate, and the area of ROC reflects the quality of the algorithm. We describe the ROC curve, which also shows that our algorithm is better than several other algorithms. The result is shown in Fig.8.
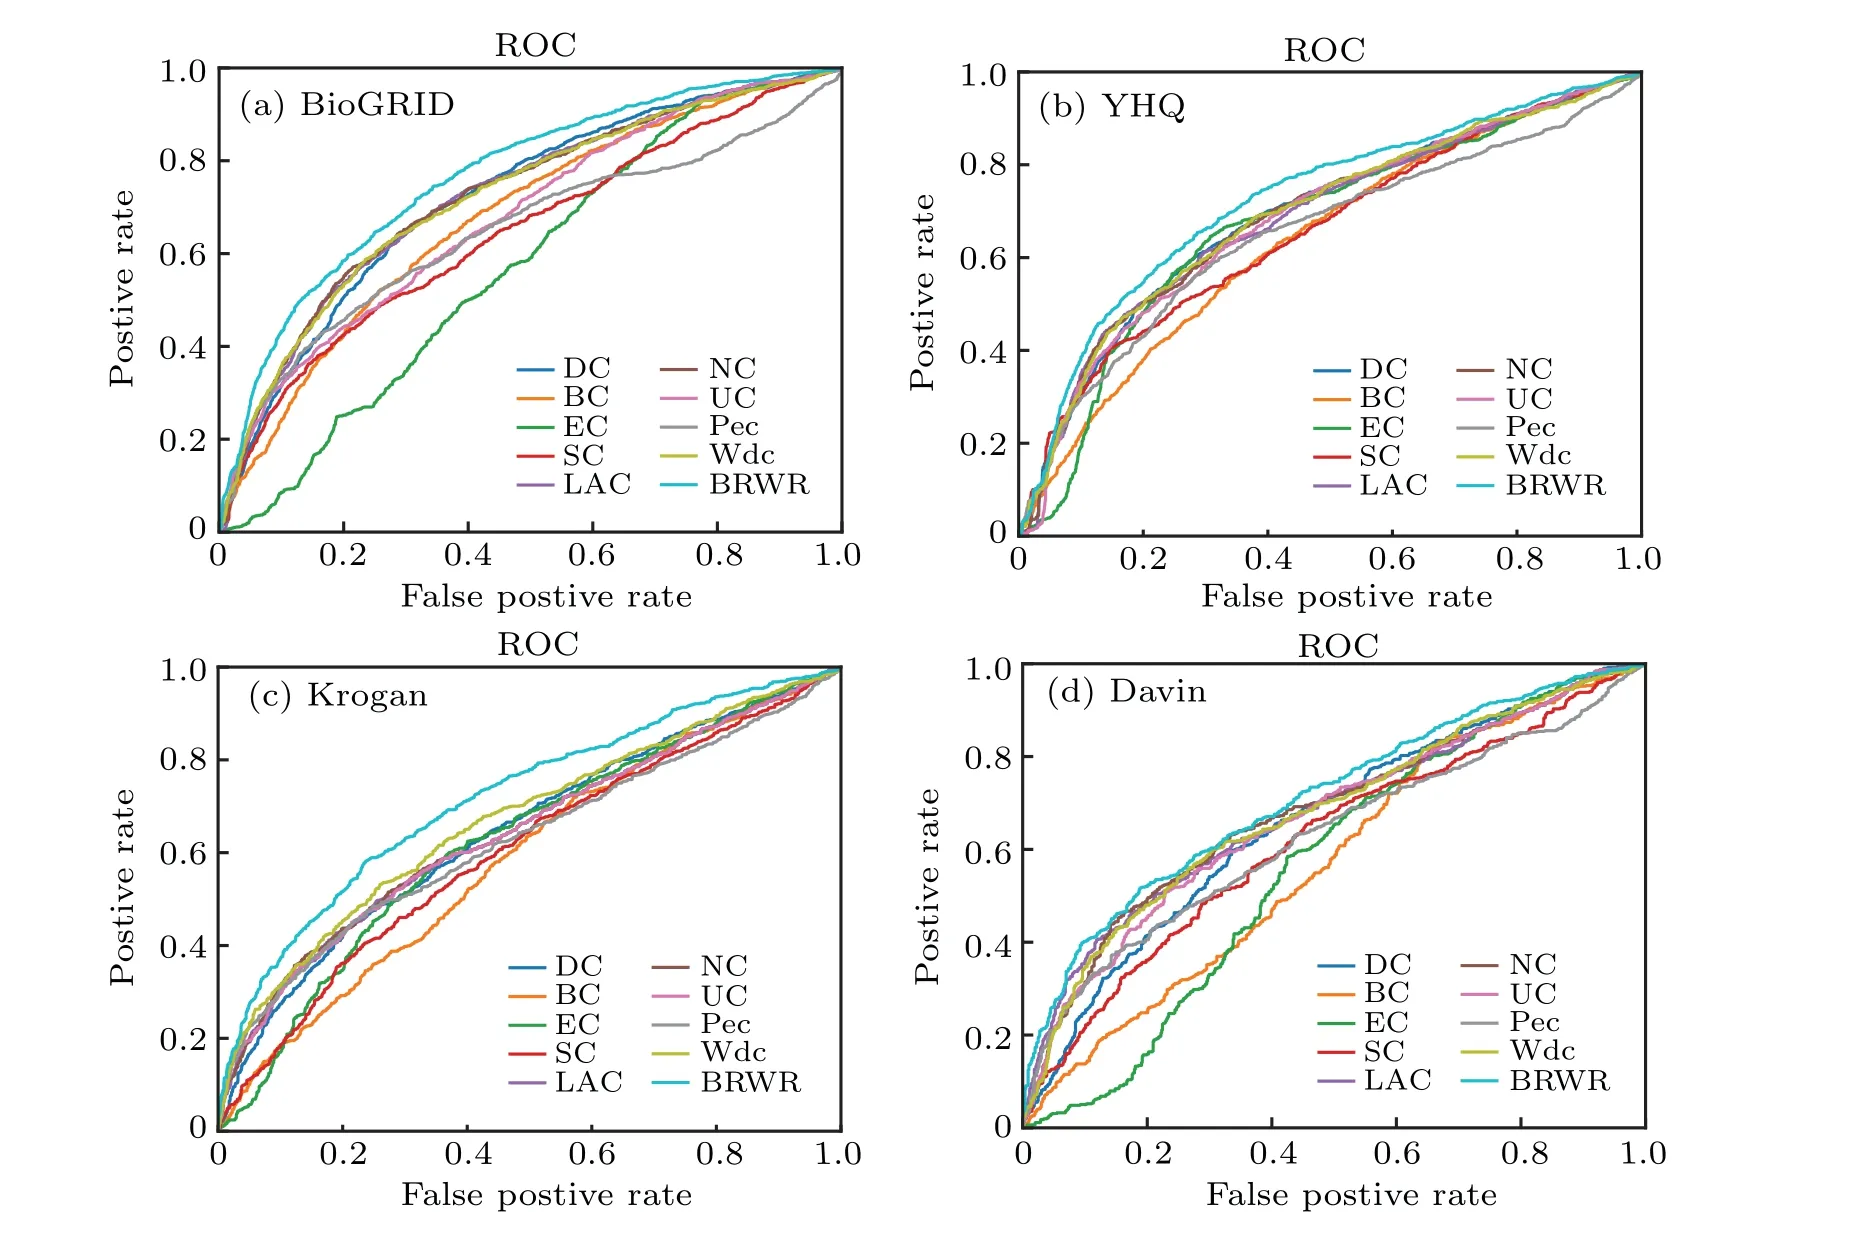
Fig.8. The performances of BRWR and other nine centrality measures on the BioGRID,YHQ,Krogan and Gavin datasets,validated by ROC curves.
6. Conclusion
The prediction of essential proteins is an indispensable research for us to know the organisms survival and evolution.Up to date,many methods have been proposed for predicting essential proteins. However,it is still of challenge to improve the prediction accuracy. In this paper,we propose a new algorithm BRWR based on the RWR model for prediction of essential proteins. Firstly,the adjacency matrix is reconstructed by using gene expression sequence and subcellular location information, and named as similarity adjacency matrix. The similarity adjacency matrix is used to construct a biased transition probability matrix,which makes the process of random walk biased. In addition,the subcellular scores are fused with the GO terms information to construct the initialization probability vector in the BRWR. Experimental results show that our proposed method has higher accuracy and stable performance in predicting essential proteins. The improvements of BRWR in terms of the average ACC results range in 1.4%–5.7%, 1.3%–11.9%, 2.4%–8.8%, and 0.8%–14.2%, respectively.
Acknowledgement
Project supported by the National Natural Science Foundation of China(Grant Nos.11861045 and 62162040).
- Chinese Physics B的其它文章
- Microwave absorption properties regulation and bandwidth formula of oriented Y2Fe17N3-δ@SiO2/PU composite synthesized by reduction–diffusion method
- Amplitude modulation excitation for cancellous bone evaluation using a portable ultrasonic backscatter instrumentation
- Laser-modified luminescence for optical data storage
- Electron delocalization enhances the thermoelectric performance of misfit layer compound(Sn1-xBixS)1.2(TiS2)2
- TiO2/SnO2 electron transport double layers with ultrathin SnO2 for efficient planar perovskite solar cells
- Sputtered SnO2 as an interlayer for efficient semitransparent perovskite solar cells