Transmembrane transport of multicomponent liposome-nanoparticles into giant vesicles
2022-04-12 03:48:36HuiFangWang王慧芳ChunRongLi李春蓉MinNaSun孫敏娜JunXingPan潘俊星andJinJunZhang張進軍
Chinese Physics B 2022年4期
Hui-Fang Wang(王慧芳) Chun-Rong Li(李春蓉) Min-Na Sun(孫敏娜)Jun-Xing Pan(潘俊星) and Jin-Jun Zhang(張進軍)
1Department of Physics and Information Engineering,Shanxi Normal University,Taiyuan 030000,China
2Beijing Key Laboratory for Sensors,Beijing Information Science&Technology University,Beijing 100192,China
3Modern College of Humanities and Sciences of Shanxi Normal University,Linfen 041004,China
Keywords: multicomponent liposome-nanoparticles,self-consistent field theory,giant vesicles,energy barrier
1. Introduction
Gene therapy is a potential treatment for many inherited and acquired diseases including cancers. It involves introduction of normal genes into a target cell, which has missing or defective genes, to compensate for or correct the resulting disorder.[1]It is also a safe and efficient mode of treatment in which stable expression of exogenous genes depends on the gene delivery system. There are two types of gene vectors: viral and non-viral. Because the viral vectors[2,3]can carry limited DNA,incur high costs,and exhibit high cytotoxicity, immunogenicity, and inflammatory response, the nonviral vectors are preferred for the therapy.[4-6]Some commercial cationic lipid-based gene vectors[7-10]have been used for gene therapy. However, their low stability and transfection efficiency preclude them from implementing the widespread clinical use.[4]With the emergence and rapid development of nanotechnology, the nanoparticles hybridized with multicomponent lipids has been more and more applied to gene delivery.[11-15]Compared with a single liposome or nanoparticle,the multicomponent liposome-nanoparticle(MLP)vectors have superior transfection efficiency, good biocompatibility,high gene-loading capacity,and good gene protection capability,and can provide sensitive and effective gene release.In addition,use of MLP vectors reduces the free diffusion observed with drug delivery systems.[16-18]
An MLP can accurately deliver and then discharge the gene of interest into the target cell. These vectors interact with the cell membrane before entering into the cell. Therefore,the nature of this interaction is important in investigating the MLP transport across the cell membrane.[19,20]The MLPs have been worked well in experimental and clinical applications.In 1987, Felgneret al. have mingled cationic liposomes N-[1-(2,3-dioleyloxy)propyl]-N,N,Ntrimethyl ammonium chloride (DOTMA) with neutral liposomes dioleoyl phosphatidyl ethanolamine (DOPE) to successfully load DNA.[21]Duet al. have used dimethyldiocta decyl ammonium bromide(DODAB)-AuNPs and DOPE to synthesize gene vectors(DODAB/DOPEAuNPs) with thrice the transfection efficiency higher than liposomes with DODAB-AuNPs alone.[22]Pozziet al.have packaged condensed DNA/protamine particles in multicomponent envelope-type nanoparticle systems(MENS),[23]which have a transfection efficiency twice that of multi-component liposomes. Recently, with the development of cryo-transmission electron microscopy technology, researchers can accurately observe the MLPs’ structures. These findings add valuable information into the liposomal drug-delivery vehicle design and membrane biophysics research.[24]Although there are some breakthroughs in the development of targeted liposome-based agents for the delivery of genetic material, the understanding of the interactions between lipid nanoparticles and cells is still largely elusive.[25,26]However, it is possible to analyze the interactive mechanism by computer simulation. The complexity of the biofilm and its assembly makes experiments difficult to run,so we have simplified the biofilm system. Biological membranes are mainly composed of a hydrophilic head and hydrophobic lipid tails.Theoretical studies of the nanoparticle and biofilm system are based on self-consistent field theory (SCFT),[27-30]dissipative particle dynamics (DPD),[31-33]molecular dynamics (MD),[34]etc.Zhang[35]has studied bilayer membrane fusion and liposome-nanoparticle fusion through the SCFT;Ginzburg and Balijepalli[36]have discussed the interaction between nanoparticles and membranes by using thermodynamic models; Guoet al.[34]and Maoet al. have simulated the entry of two-dimensional nanomaterials into cells and the interaction between dendrimer-like soft nanoparticles and membranes by using the DPD and dynamic methods respectively.[34,37]Mulleret al.[38]have studied membrane fusion by using Monte Carlo simulation. Some mechanisms of nanoparticle transport across cell membranes including endocytosis and exocytosis have been studied. However,the interaction between the membranes, especially those of vesicles,needs further studying.
In this paper, we simulate the transport of MLPs across the membranes by using the SCFT.The influence of the head volume fractions of lipid species A and B and the radius of the nanoparticle are discussed, and we obtain metastable intermediates at different locations. We also reveal the physical mechanism of phase transition by analyzing the free energy curves.
2. Model and simulation method
In the model, we consider a vesicle consisting of a homogeneous bilayer phospholipid membrane molecule. The schematic diagrams of MLP and GV are shown in Fig.1.Here,MLP represents the structure that the nanoparticle is coated by the multicomponent liposome vesicle (ML), and GV denotes the self-assemble structure of lipids A and B.Thelbrefers to the thickness of the lipid bilayer and is set to be 6,i.e.,lb=6.Thedis the distance between the center of nanoparticle and the center of the GV bilayer membrane, sod=lb/2. The Nanoparticle radius isRp. We setd=0 when the center of nanoparticle and the center of the GV bilayer membrane coincide with each other,andd >0 represents that the nanoparticle is outside the GV,andd >0 refers to the nanoparticle that is inside the GV.
In this model, all of the species are incompressible and the local volume fractionsφi(r) satisfies the following relationship:

where the value ofφ0(r) depends on the relative positionrand the nanoparticle radiusRp,
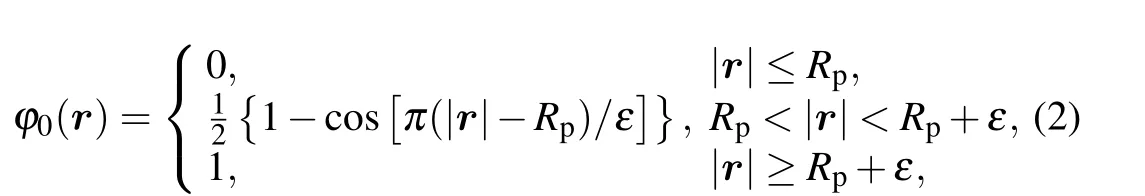
whereεis a sufficiently small value.[39]
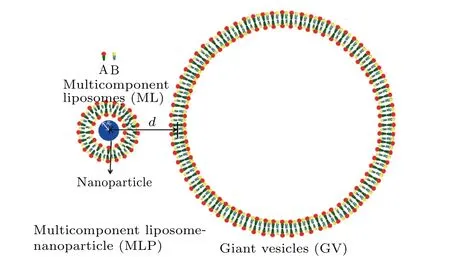
Fig.1. Schematic diagrams of MLP(left)and GV(right).

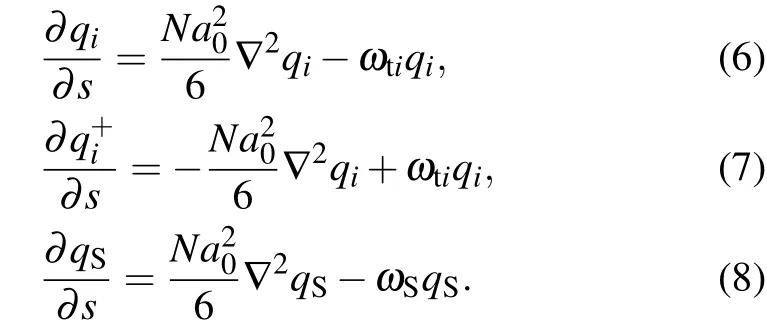
The free energyFcan be obtained and described as follows:wheresis the segment index of the lipid molecules,from the end of one tails=0 to the end of the other tails=1,the lipid head is in the middle of two tails,i.e., at positions=1/2.The end-segment distribution functionsqi(r,s),q+i(r,s),andqS(r,s)obey the following modified diffusion equations:
The 4th-12th terms on the right-hand side in Eq.(3)represent the contribution of interaction energy between different components. The Flory-Huggins interaction parameters between different components are denoted byχi j. The 13th-17th terms represent the contributions of the mean field acting on different components, whereωhi,ωti, andωSrepresent the fields acting on the head groups (hi), tail segments (ti) and solvent segments (S), respectively. TheHp(r) term denotes the field of nanoparticle acting on the lipids and solvent:

3. Numerical results and discussion
3.1. Effect of head volume fractions of lipid species A and B
3.1.1. Same head volume fractions of lipid species A and B
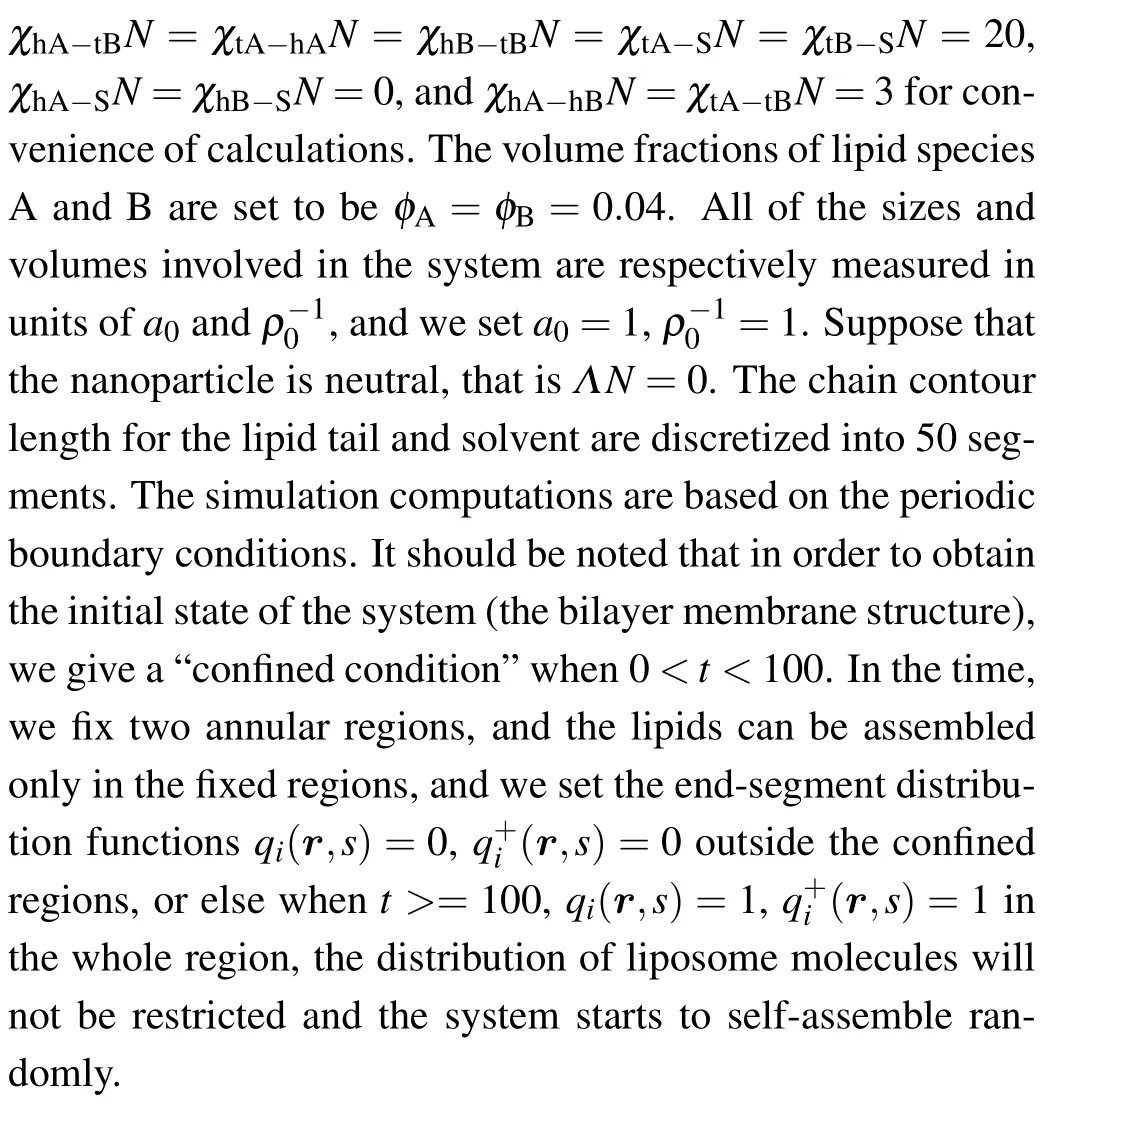
First,we investigate the transition of the membrane structure with the distanceddecreasing as shown in Fig. 2. The head volume fractions of lipid species A and B are equal(fhA=fhB=0.2),only a part of the membrane is shown in each panel for clarity. We setd=32 as the initial state(Fig.2(a)).Asddecreases (d=28), the parts of the membrane in contact directly dissociate into multiple smaller spherical inverted micellar intermediates(IMI phase)(Fig.2(b)). Then,IMIs decreases withddecreasing as shown in Figs. 2(c)-2(f), whend=Rp+lb/2, the particles begin to enter into the vesicle of GV and the inner membrane starts to merge due to the extrusion of the particle and the deformation of outer membrane.The part of the membrane that packages the particle disappears and forms a fusion pore,which is called the interlamellar attachment(ILA phase). The formation of the fusion pore indicates the accomplishment of membrane fusion. Meanwhile,the number of IMIs increases as indicated in Fig.2(g).Then the IMIs gradually decrease and disappear as seen in Figs. 2(h)-2(k). Finally, a bilayer membrane is formed and the particle is released into the GV in Fig. 2(l). It should be noted that owing to the similarity between the lipids A and B in properties,the color distinction is not so clear between lipid head A and lipid head B, and neither is the color distinction between lipid tail A and lipid tail B,but this has no influence on our discussion about the change of membrane morphology in the process of transmembrane transport.
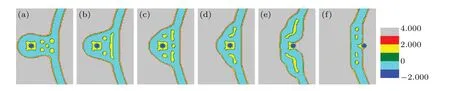
Fig. 3. A part of concentration distributions of MLP and GV, with distance d =27 (a), 21 (b), 15 (c), 6 (d), 4 (e), -7 (f), fhA=fhB =0.25, and Rp=1.00Rg.

Fig. 4. A part of concentration distributions of MLP and GV, distance d =26 (a), 22 (b), 13 (c), 10 (d), 4 (e), 2 (f), fhA=fhB =0.3, and Rp=1.00Rg.
The structural transformation whenfhA=fhB= 0.25 is shown in Fig.3. Like the change from Figs.2(a)-2(b),a part of two vesicles that are in contact with each either directly dissociates into multiple smaller IMIs(Fig.3(a)). Whenddecreases (16<d <21), multiple smaller IMIs transform into two IMIs and a long rod(called HIIphase[42,43])as shown in Fig.3(b). Figure 3(c)shows that the long HIIphase splits into two short HIIphases and an IMI phase. As the distance continues to decrease,the two HIIphases and multiple IMI phase become symmetrical bending HIIphases (Fig. 3(d)). Then,the system forms a fusion pore and the curved HIIphases become a longer rod(Fig.3(e)). Finally,the two long curved HIIphases dissociate into several IMI phases(Fig.3(f)),and when the particle releases into the membrane,these IMI phases will disappear,which is similar to the scenario in Figs.2(k)-2(l).
Figure 4 shows the transformation of the membrane structure withddecreasing, whenfhA=fhB= 0.3. Figure 4(a)shows the contact and fusion of the outer layer (head groups of lipid B) of the lipid. Then, the membrane structure bends slightly (Fig. 4(b)), and forms a symmetrical bridge of hydrophobic membrane (Fig. 4(c)), which is called the stalk phase.[44,45]Asddecreases, the contact area forms two IMIs(Fig.4(d)). Whend=4, the system forms a fusion pore and the two IMIs transform into two short HIIphases (Fig. 4(e)).And then the short HIIphases turn into long curved HIIphases(Fig. 4(f)). Finally, the HIIphases disappear and a bilayer membrane forms.
WhenfhA=fhB= 0.35, the structures at different distances are shown in Fig.5. The transformations in Figs.5(a)-5(c)are the same as those in Figs.4(a)-4(c));the outer membranes touch, deform, and then form the stalk phase. But in Fig.5(d),the stalk phase expands rapidly and forms the hemifusion diaphragm (called HD phase[46]). Reducing the distancedto 5,i.e. d=5, a fusion pore forms in Fig. 5(e). Finally,the particles release into a bilayer membrane.
In summary,the mechanism of interaction between MLP and GV undergoes the contact and fusion of the outer membranes, merging of inner membranes, formation of fusion pore,release of the particle,and formation of a bilayer membrane.Because the spontaneous curvature of a lipid membrane is a monotonic function offh,[26,47]the spontaneous curvature of the membrane changes monotonically withfh. As a result,the system presents many different metastable intermediates.The smaller thefh,the larger the spontaneous curvature of the membrane is,the more easily the membrane ruptures and disperses during fusion and dissociates into the IMI phase and HIIphase. On the contrary,the larger thefh,the smaller the spontaneous curvature of the membrane is,and the more easily the membrane forms the stalk phase and HD phase.
The mechanism of the transmembrane transport is determined by two energy contributions: the conformational entropy of the lipids and the interaction energy between different components. Figure 6 shows the free energy curves of the system during transportation with different conditions,and the curves correspond to the respective structures in Figs.2-5.On the whole,the architecture changes gradually from the initial unstable state (high energy) to the final steady state (low energy), but the free energy of the system fluctuates during the transportation due to the energy barriers between different metastable intermediates.
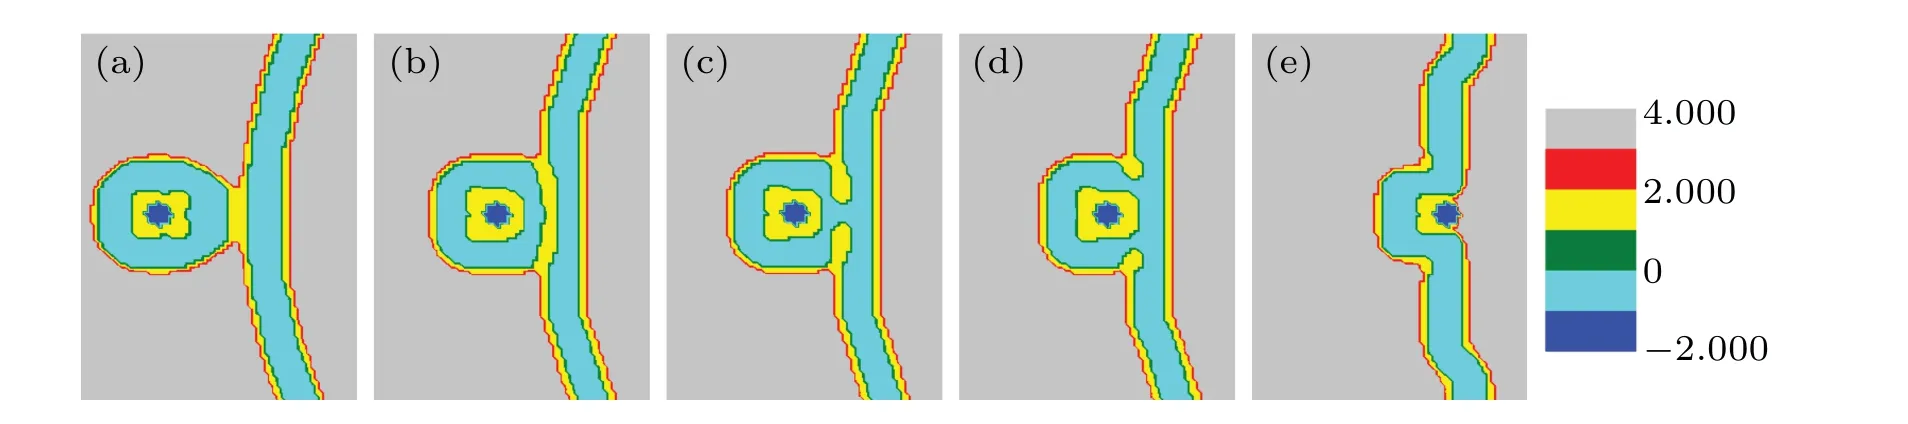
Fig.5. A part of concentration distributions of MLP and GV,with distance d=24(a),20(b),14(c),10(d),5(e), fhA=fhB=0.35,and Rp=1.00Rg.
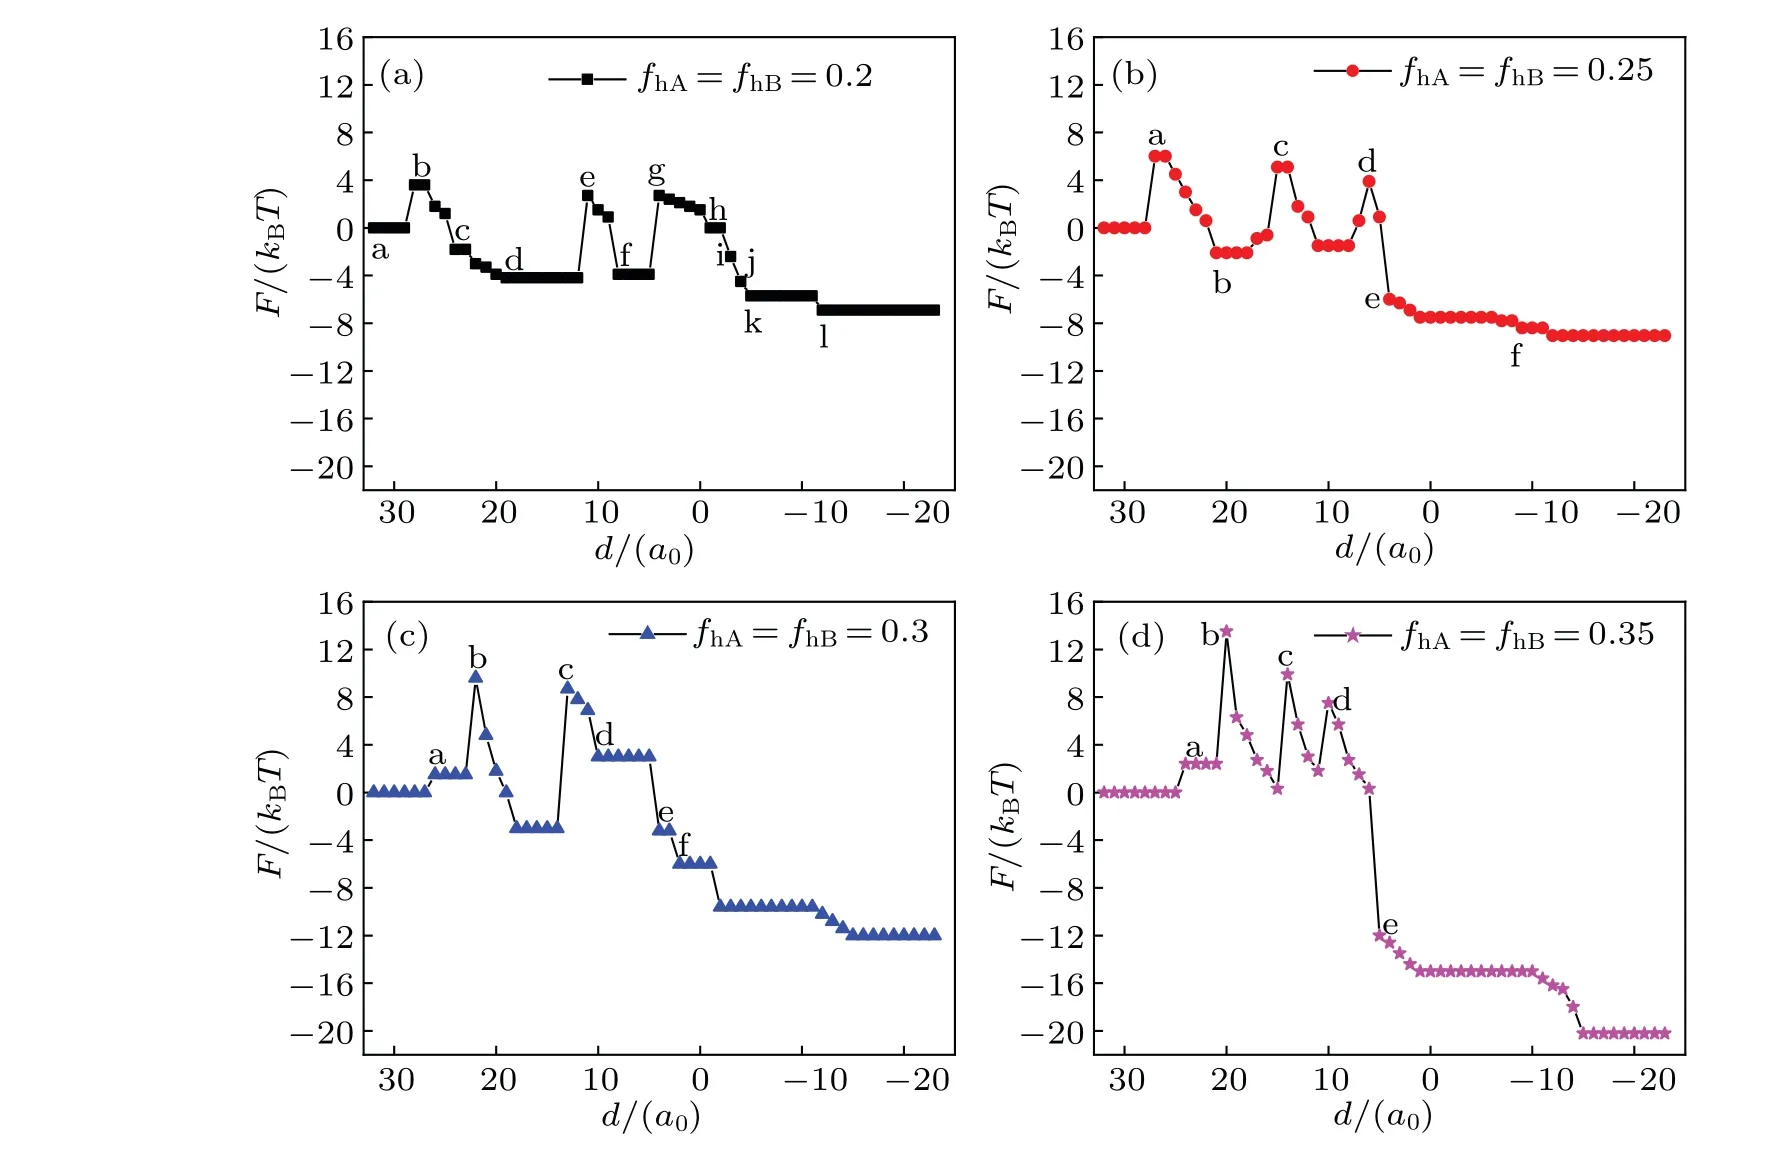
Fig.6. Free energy F of the system as a function of distance d for the same head volume fractions: fhA= fhB=0.2(a),0.25(b),0.3(c),0.35(d),and Rp=1.00Rg.
In Fig.6(a),F=0 corresponds to the initial state shown in Fig. 2(a). The first free energy barrier appears at the instant fusion of membrane when the outer layer of lipid meets the vesicle(Fig.2(b)),and this phenomenon is also discussed in the literature.[48]In the process, comparing with the initial state, the contact area between different membrane components reduces, so the interaction energy decreases. The maximum value of free energy is induced by the decrease of conformational entropy. Then the free energy decreases with the number of IMI reducing(Figs.2(c)-2(d)).The second free energy barrier appears when the IMIs arrange from multi-rows to one row (Fig. 2(e)), the extrusion degree induces the conformational entropy of the lipids to decrease,thereby the free energy increases. The third free energy barrier appears when the IMIs increase (Fig. 2(g)). In the process, the conformational entropy decreases,so the free energy increases. Later,the free energy slowly drops as IMIs decreases(Figs.2(h)-2(k)). This indicates that the extrusion degree of the lipid chain is less.Finally,the free energy falls to a minimum value and settles to a stable state in Fig. 2(l), which indicates the formation of a bilayer membrane.
In Fig.6(b),the first free energy barrier is similar to that in Fig. 6(a). Significantly, the fragmentation of the long HIIneeds to overcome an energy barrier (Figs. 3(b)-3(c)). Conformational entropy decreases and the free energy increases when the system forms two bent HIIphases (Fig. 3(d)). Free energy falls sharply when the fusion pore forms(Fig.3(e)).
In Fig.6(c),firstly,the free energy reaches to a maximum value, when the membrane changes from fusion (Fig. 4(a))into extrusion (Fig. 4(b)). The change of the free energy is mainly because of the change of conformational entropy that induced by bending the lipid chain. In Fig.4(b),the extrusion of lipid chain reaches a maximum value, the conformational entropy of lipid reaches a minimum value, and the free energy reaches a maximum value. Free energy increases significantly because of the formation of the stalk phase. When the contact area between different components is smaller than that in the initial state (Fig. 4(c)), the interaction energy is lower.Therefore, the increase in free energy is due to the change in the structure of lipid chains and the decrease in conformational entropy. The IMI phase and HIIphase do not need to overcome an energy barrier (Figs. 4(d) and 4(e)) so they are benefit the system. As shown in Fig. 6(d) (fhA=fhB=0.35),the increase in the free energy also corresponds to the change of lipid structure. The contact area between different components decreases compared with the scenario in the initial state when the system forms the HD phase. The free energy increases with conformational entropy decreasing(Fig.5(d)).The trends of the free energy curves decline in Figs.6(a)-6(d),indicating that the interaction between MLP and GV is spontaneous when the distance between them is shorter. During the interaction, an energy barrier needs overcoming for the structural transformation to occur,and the increase of the free energy is caused mainly by reducing the conformational entropy. In addition, asfhincreases, the fluctuation degree of the free energy increases, which implies that the interaction betwen MLP and GV is facile whenfhis smaller.
3.1.2. Different head volume fractions of lipid species A and B
We investigate the effects of the different head volume fractions of lipid species A and B on the membrane structure.The head volume fraction of lipid B isfhB=0.55.
Figure 7 shows the structural transformation with distance decreasing whenfhA=0.2. The vesicles are far apart in Fig.7(a). When the distance decreases to 25,the outer layers of MLP and GV touch and fuse with each other in Fig.7(c). In Fig.7(d), pronounced extrusion is observed. When two vesicles are in close contact, they form the stalk phase as shown in Fig. 7(e). When the distance further decreases, the components move to either sides of the channel and form an IMI in the middle of the channel (Fig. 7(f)), and then the number of the IMIs increase, which is shown in Fig. 7(g). The IMIs disappear whend=8 in Fig.7(h)and a fusion pore forms in Fig.7(i),which increases in size(Fig.7(j)).In Fig.7(k),membrane invagination occurs and finally, the bilayer membrane form and the particles are released into the GV(Fig.7(l)).
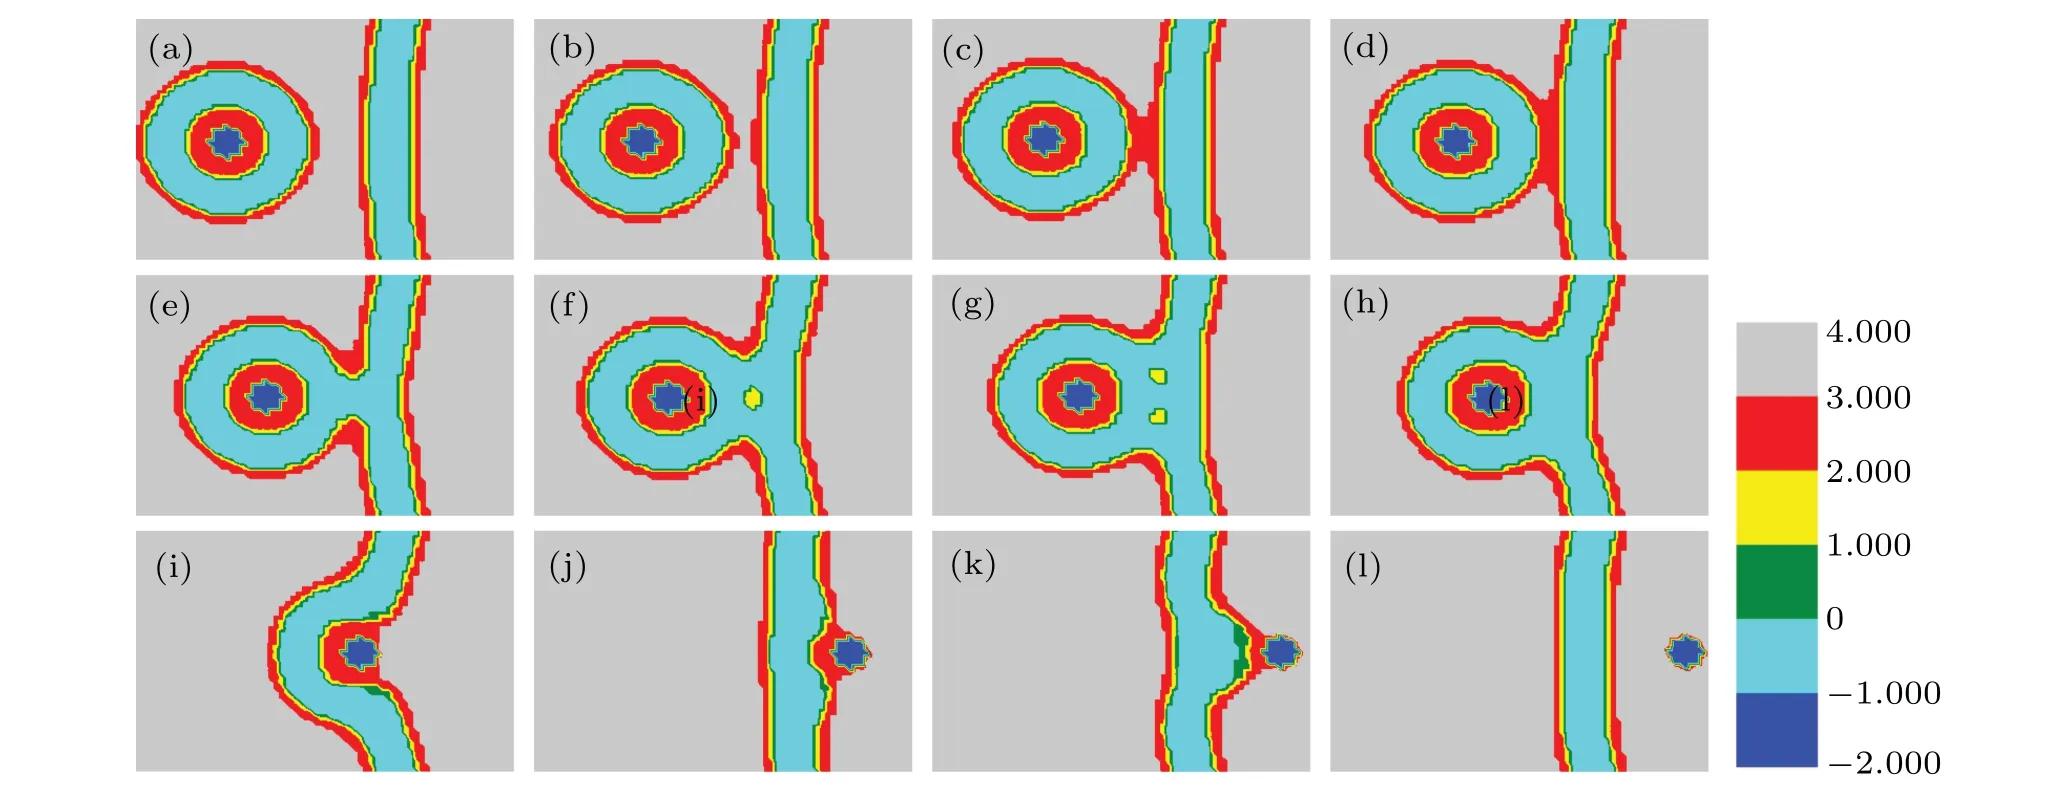
Fig.7. A part of concentration distributions of MLP and GV,with distance d=32(a),26(b),25(c),23(d),14(e),12(f),10(g),8(h),-1(i),-5(j),-11(k),-18(l), fhA=0.2, fhB=0.55,and Rp=1.00Rg. Only a part of the membranes are shown in each figure for clarity.
Figure 8 shows the membrane transformation that occurs whenfhA=0.25. Whendis between 32 and 13, the change of the membrane structure is similar to those in Figs.7(a)-7(d). In Fig.8(a),the membrane forms the stalk phase just as shown in Fig.7(e). In this system,the membrane forms the small spherical unilamellar vesicle(SUV)phase(Fig.8(b)). From Figs.8(c)-8(d), the HIIsplits into two IMI phases. The changes of the morphology in Figs. 8(e) and 8(f) (d=4 tod=0) are similar to those in Figs.7(h)and 7(i),and IMI phases disappear,the inner membrane fuses and a fusion pore forms. After that,the phase transition is the same as that in Figs.7(j)-7(l),the fusion pore becomes larger,membrane invagination occurs,and the particle is released into bilayer membrane.
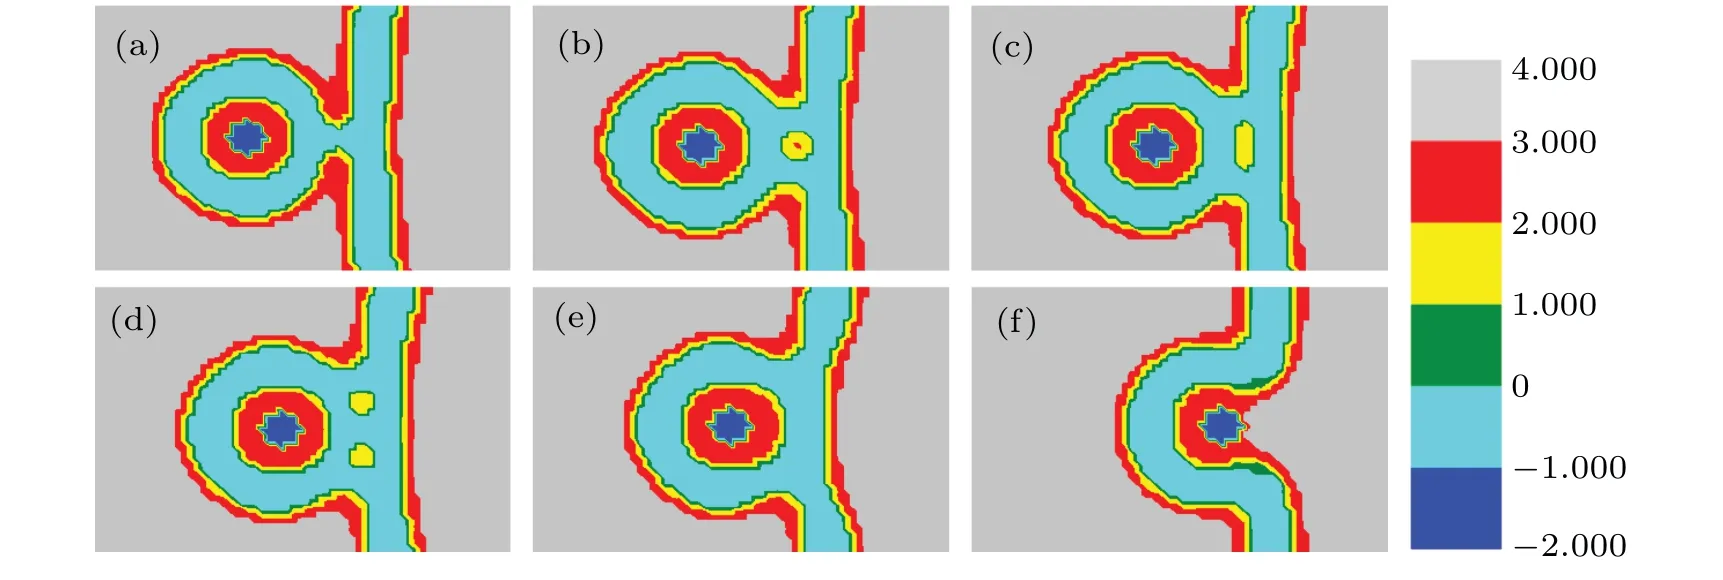
Fig.8. A part of concentration distributions of MLP and GV,with d=12(a),10(b),7(c),6(d),4(e),0(f), fhA=0.25, fhB=0.55,and Rp=1.00Rg .
Figure 9 shows the evolution of membrane structure in the system with distance decreasing whenfhA=0.35. The changing offtransforms the membrane structure of MLP and GV.Fromd=32 tod=13,the structural transformations are the same as those in Figs. 7(a)-7(d). In Fig. 9(a), the head groups of lipid B contact and fuse with each other and open a channel. In Fig.9(b),whendis 11,the system forms the stalk phase. The HD phase appears in Fig.9(c). Whenddecreases to 0, the system forms a fusion pore, and finally merges and forms a bilayer membrane.
In Fig. 10,fhA= 0.4, the structural transformations are very different from those whenfhA= 0.2, 0.25, 0.35.Figure 10(a) shows that the outer membranes gradually contact and fuse with each other as the distance between them decreases. When the distance continuously decreases(Figs. 10(b)-10(c)), the hydrophobic tails of the lipid B in MLP touch and fuse with each other. Whend=14,as shown in Fig. 10(d), the hydrophilic heads of lipids A and B also contact and fuse with each other. On further reducing the distance,hydrophobic tails of lipid B in GV begin to contact and fuse(Fig.10(e)). Finally, the particles are released into giant vesicle.
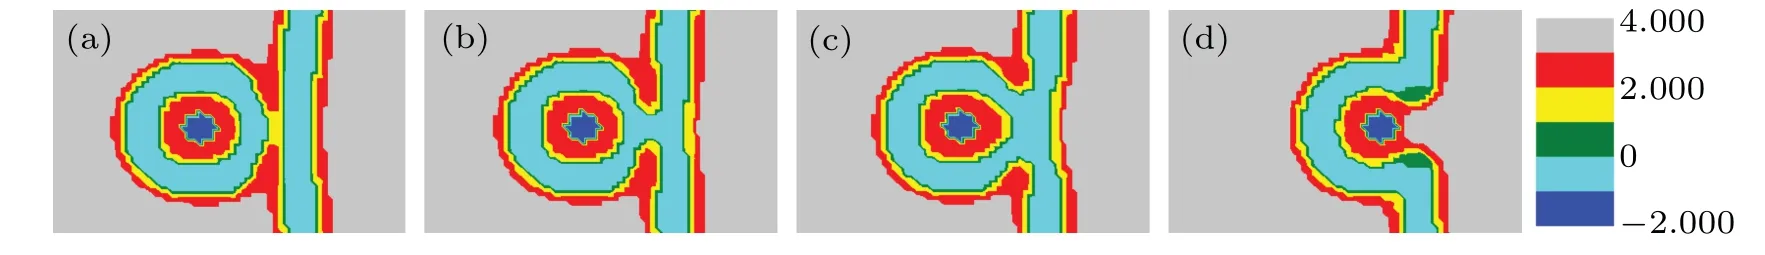
Fig.9. A part of concentration distributions of MLP and GV,with distance d=12(a),11(b),8(c),0(d), fhA=0.35, fhB=0.55,and Rp=1.00Rg.
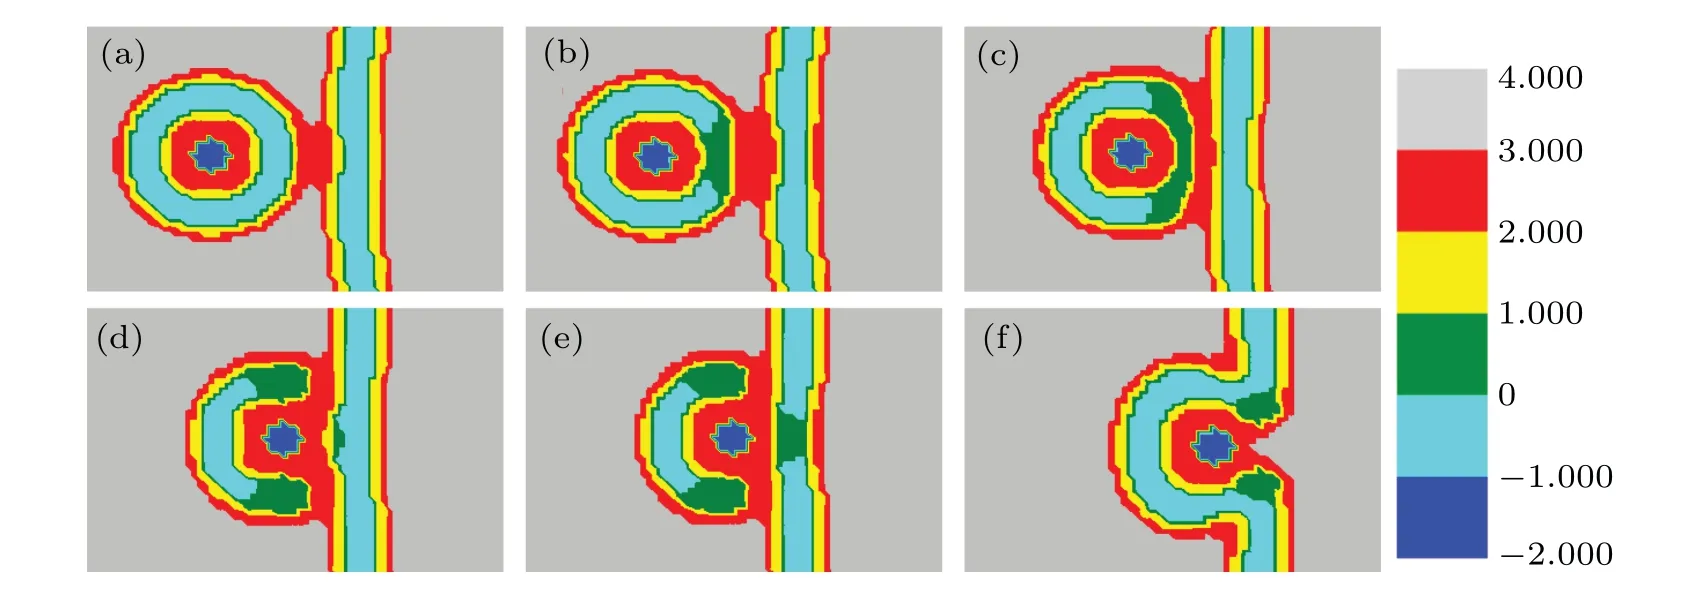
Fig.10. A part of concentration distributions of MLP and GV,with distance d=23(a),20(b),16(c),14(d),10(e),0(f), fhA=0.4, fhB=0.55,and Rp=1.00Rg.
In summary,during the interaction between MLP and GV,the membrane is easily broken down. In addition,whenfhAis smaller,the IMI,SUV,and HIIphases are observed and whenfhAis larger,the membrane tends to fuse directly.
Figure 11 shows the quantitative analyses of free energy and the interaction between different components ΔH. Figure 11(a)shows the curve of the free energyFwhenfhA=0.2 andfhB=0.55;F=0 and ΔH=0 correspond to the initial state (Fig. 7(a)). The contact area between different components is less than that in the initial state,so the interaction decreases. Therefore, the free energy change can be attributed to the change of conformational entropy in Fig. 7(g). Before the particle enters into the cell membrane, the free energy slightly elevates and then stabilizes; this is because the membrane invaginates and conformational entropy decreases.Finally, the particle is released after the system has formed a bilayer membrane. WhenfhA=0.25 andfhB=0.55, the change in the free energy is shown in Fig. 11(b). An energy barrier needs overcoming for forming the SUV phase. There is a decrease in the contact area between different components and the interaction energy and therefore the change of the free energy is ascribed to the change of conformational entropy.In Fig.11(c)(fhA=0.35,fhB=0.55),the change of free energy is related to the structural transformation. As shown in Fig.11(d)(fhA=0.4,fhB=0.55),the decline in the free energy indicates that the membrane fuses directly. The overall trend of the free energy curves decreases in Fig.11,indicating that the interaction between MLP and GV is spontaneous. The increase of free energy is primarily attributed to the decrease of conformational entropy. With the increase offhA,the fluctuation in the free energy increases,implying that it promotes the interaction between MLP and GV.
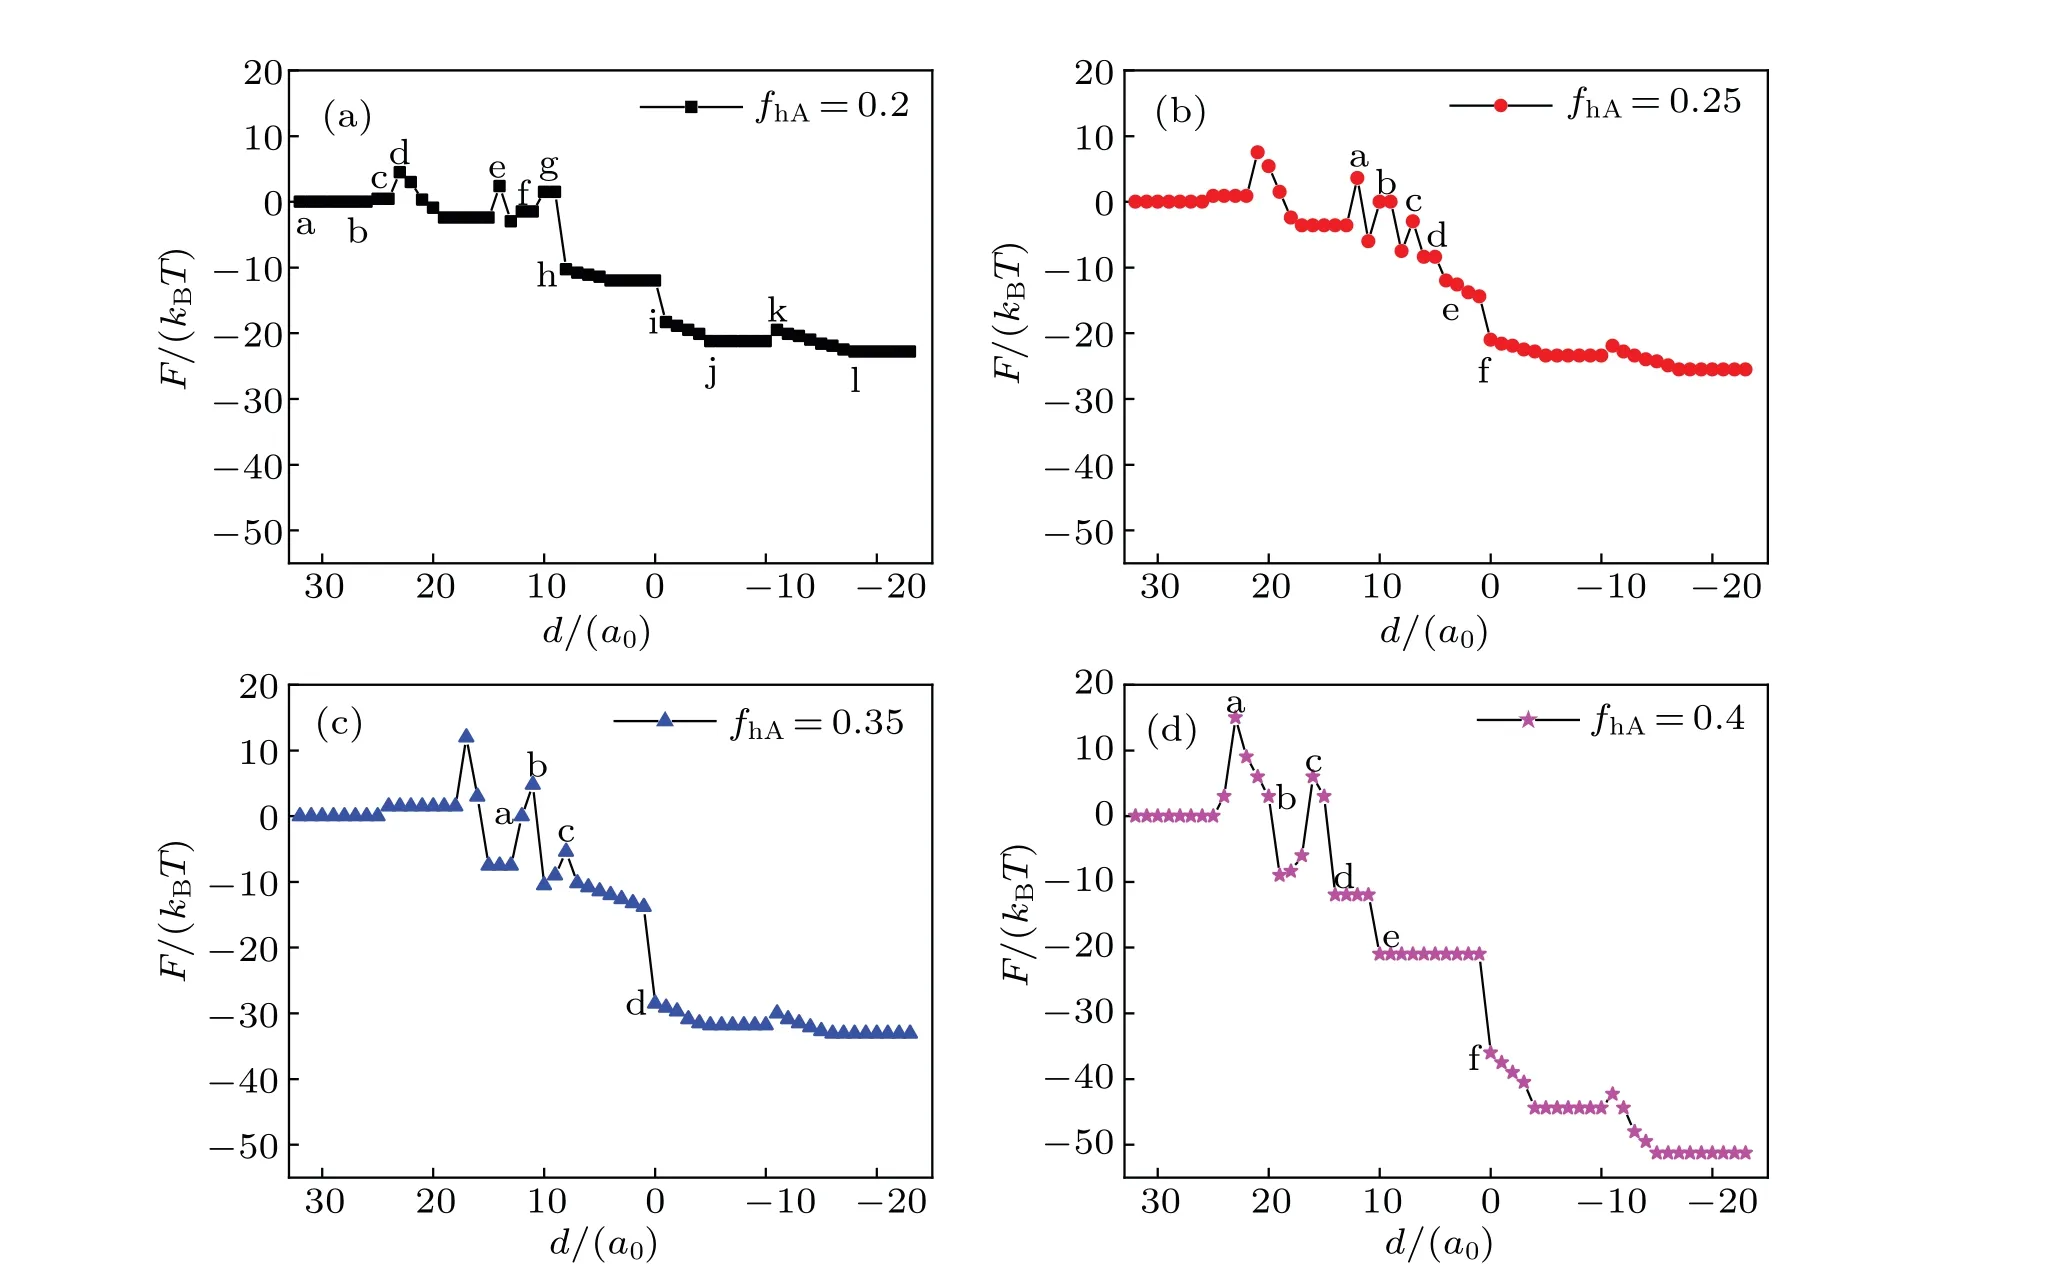
Fig. 11. System free energy F (black curves) and the interaction between different components ΔH (blue curves) as a function of the distance d for different head volume fractions: (a) fhA =0.2 and fhB =0.55, (b) fhA =0.25 and fhB =0.55, (c) fhA =0.35 and fhB =0.55, (d) fhA =0.4 and fhB=0.55,and Rp=1.00Rg.
To gain an insight into the membrane morphologies, we construct the phase diagram offhAandfhBin Fig.12.It shows thatfhAandfhBhave a greater influence on the membrane structure. WhenfhAis smaller andfhBis larger, the MLP comes into contact with GV and the membranes form the stalk and IMI phases; whenfhAis larger, MLP fuses directly with GV. WhenfhAandfhBare smaller, we observe a new structural intermediate: the rod SUV, which dissociates into two spherical SUVs,which then transform into two IMIs(Fig.13).Despite the varying head group fractions,the common features of the transmembrane transport are the formation of a fusion pore,the release of the particle into the GV,and the formation of a bilayer membrane.
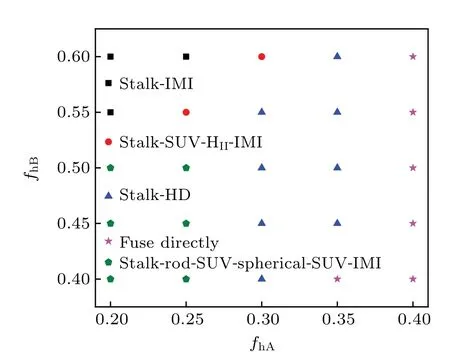
Fig.12. Phase diagram by varying the head volume fraction fhA and fhB.
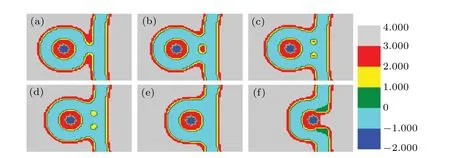
Fig. 13. A part of concentration distributions of MLP and GV, with distance d =14 (a), 10 (b), 8 (c), 6 (d), 4 (e), 1 (f), fhA =0.2, fhB =0.5, and Rp=1.00Rg.
3.2. Effect of nanoparticle radius Rp
In this subsection, we discuss the effect of the nanoparticle radiusRpon the membrane structure and find that the nanoparticle radius has no influence on morphological transition.
Figure 14 shows the change of the free energy with nanoparticle radius.ForRp=0.35Rg,1.00Rg,1.50Rg,2.50Rg,the values of their corresponding free energy are all the same.With the increase of the particle radius, the fluctuation of the free energy increases. Because the phase structure and MLPGV distance are the same,the interaction energy is unchanged even though the particle radii are different. However, whenRpis bigger,the extrusion of lipid chains around nanoparticle is larger and the conformational entropy is less;therefore,the energy barrier that needs overcoming increases.
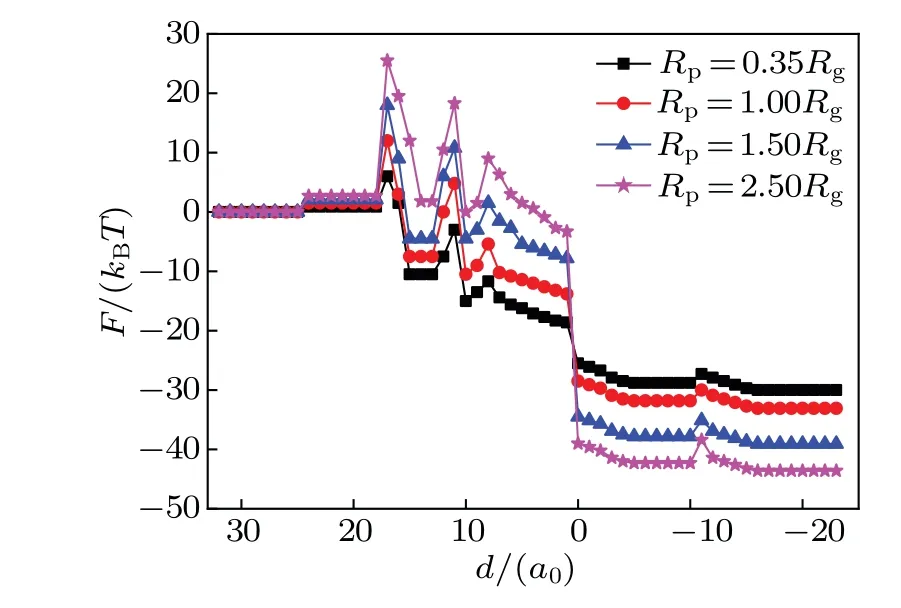
Fig.14. Variations of free energy F of the system with distance d for different nanoparticle radii when fhA=0.35 and fhB=0.55,with square denoting the results for Rp=0.35Rg,circle for Rp=1.00Rg,triangle for Rp=1.50Rg,and pentagram for Rp=2.50Rg.
4. Conclusions
The MLP, as a new gene vector, has received considerable attention due to its potential application in gene therapy.The interaction between a gene vector and the cell membrane plays an important role in implementing its wide-ranging applications. The mechanism of transport of MLP across GV membrane is studied by SCFT. With the decrease of the distance,the MLP interacts with the GV.Their interaction makes the membranes fuse and the particles enter into the GV. The free energy of the system are calculated,and it decreases with the distance decreasing, thereby demonstrating that the interaction between MLP and GV is a spontaneous process. The transformations of membrane structure with the changes offhandRpare discussed.The change of the structure is influenced primarily byfh. For the case offhA=fhB,whenfhis smaller,the membrane dissociates into metastable intermediates of the IMI phase and the HIIphase,whenfhis larger,the membrane tends to form metastable intermediates of the stalk phase and HD phase. For the case wherefhA=fhBandfhAis in a range of 0.2-0.3, we observe metastable intermediates in the IMI,SUV,and HIIphases during fusion; whereas whenfhAis 0.4,the membrane tends to fuse directly. However, the radius of the nanoparticle has no influence on membrane morphology.During interaction, the formation of the metastable intermediates needs to overcome the energy barrier, which is mainly because of the decrease in conformational entropy.The energy barrier increases to a certain degree whenfhandRpincrease.Our results provide some theoretical insight into the various stages of the transport of MLP across the GV membrane. This study is expected to be helpful in devising nanodrug carriers in clinical settings and any transmembrane carriers.
Appendix A: Metastable intermediates of phase structures
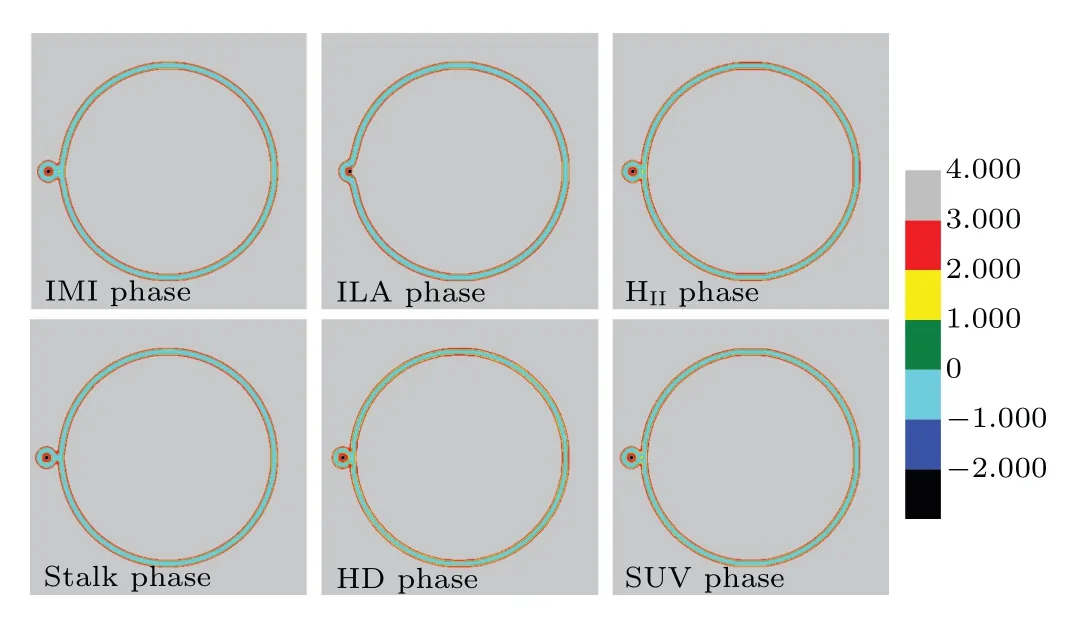
Fig.A1. Metastable intermediates in IMI phase,ILA phase,HII phase,stalk phase,HD phase,and SUV phase.
The interaction between MLP with GV is due to contact and fusion of two vesicles. By changing the hydrophilic fraction, the metastable intermediates can form in the IMI phase, ILA phase, HIIphase, stalk phases HD phase, and SUV phase(Fig.A1). For forming the metastable intermediates,the phase structures need to overcome the energy barrier,which increases with the increase of hydrophilic fraction and nanoparticle radius.
Acknowledgements
Project supported by the Science and Technology Innovation Project of Higher Education in Shanxi Province,China (Grant No. 2020L0752), the Basic Research Foundation Project in Modern College of Humanities and Sciences of Shanxi Normal University, China (Grant No. 2020JCYJ25),and the Graduate Student Science and Technology Innovation Project of Shanxi Normal University, China (Grant No.01053011).
- Chinese Physics B的其它文章
- Helium bubble formation and evolution in NiMo-Y2O3 alloy under He ion irradiation
- Dynamics and intermittent stochastic stabilization of a rumor spreading model with guidance mechanism in heterogeneous network
- Spectroscopy and scattering matrices with nitrogen atom:Rydberg states and optical oscillator strengths
- Low-overhead fault-tolerant error correction scheme based on quantum stabilizer codes
- Molecular dynamics simulations of A-DNA in bivalent metal ions salt solution
- Evaluation on performance of MM/PBSA in nucleic acid-protein systems