High sensitivity plasmonic temperature sensor based on a side-polished photonic crystal fiber
2022-02-24 08:58:16ZhigangGao高治剛XiliJing井西利YundongLiu劉云東HailiangChen陳海良andShuguangLi李曙光
Chinese Physics B 2022年2期
Zhigang Gao(高治剛), Xili Jing(井西利), Yundong Liu(劉云東), Hailiang Chen(陳海良), and Shuguang Li(李曙光)
State Key Laboratory of Metastable Materials Science&Technology and Key Laboratory for Microstructural Material Physics of Hebei Province,School of Science,Yanshan University,Qinhuangdao 066004,China
A high sensitivity plasmonic temperature sensor based on a side-polished photonic crystal fiber is proposed in this work. In order to achieve high sensitivity and high stability,the gold layer is coated on the side-polished photonic crystal fiber to support surface plasmon resonance. The mixture of ethanol and chloroform is used as the thermosensitive liquid.The performances of the proposed temperature sensor were investigated by the finite element method(FEM).Simulation results indicate that the sensitivity of the temperature sensor is as high as 7.82 nm/°C.It has good linearity(R2=0.99803),the resolution of 1.1×10?3 °C,and the amplitude sensitivity of 0.1008 °C?1. In addition,the sizes of the small air hole and polishing depth have little influence on the sensitivity. Therefore, the proposed sensor shows a high structure tolerance. The excellent performance and high structure tolerance of the sensor make it an appropriate choice for temperature measurement.
Keywords: photonic crystal fiber,sensors,surface plasmon
1. Introduction
Owing to the flexibility of photonic crystal fiber (PCF)structure design, many optical devices based on PCF have been developed, such as filters,[1–3]sensors,[4]and beam splitters.[5]The PCF-based sensors can measure a variety of environmental parameters including temperature,[6,7]refractive index,[8–10]and pressure.[11]Surface plasmon resonance(SPR) is an advanced optical sensing technology.[12]It provides a broad development space in the field of biosensing.[13]Because SPR is very sensitive to the change of the refractive index of the medium near the metal film,the PCF sensor based on SPR technology has many advantages,such as wide tunable range,[14]good temperature stability and high sensitivity.[15,16]
In recent years, many SPR-based PCF temperature sensors have been reported. Penget al.studied a gold-coated PCF temperature sensor.[17]Its structure is relatively simple and the temperature sensitivity is 720 pm/°C. A temperature sensor filled with silver nanowires and liquid was proposed by Luet al.[18]Its sensitivity reaches 2.7 nm/°C within the temperature measuring range from 10°C to 40°C . Liuet al.proposed a temperature sensor,which is gold-coated inside the air hole and filled with liquid.[19]The temperature detection range of the sensor is 0°C–100°C, and the temperature sensitivity is 3080 pm/°C. In addition, Wenget al.designed a D-shaped hole double-cladding temperature sensor.[20]The D-shaped hole is coated with a gold film and liquid is injected into the hole to achieve high-sensitivity temperature sensing.The sensitivity of the sensor can reach to?3.65 nm/°C.However, these sensors need a plate gold on the inner wall of the air hole or filling the air hole with liquid. Such requirements pose a challenge to the fabrication of the sensors.
In this paper, a gold-coated side-polished PCF temperature sensor based on SPR is designed and demonstrated. The structure of PCF is very simple, it has only two layers of air holes. The side-polished structure can reduce the difficulty in depositing metal film and avoid filling thermosensitive liquid into the air holes. The performance of the proposed temperature sensor was analyzed by the finite element method(FEM).We have studied the influence of structural parameters on the sensing performance, the resolution and amplitude sensitivity of the temperature sensor. Simulation results show that the sensitivity of the proposed sensor is higher than reported previously,[17–20]and it can become a strong competitor of temperature sensors.
2. Sensor design and theoretical basis
The two-dimension cross-section view of the temperature sensor is presented in Fig. 1. There are two small air holes and two large air holes near the fiber core, and their diameters ared1andd2, respectively. The diameter of the other air holes isd3. The distance between the air holes, the polishing depth, and the radius of the PCF are considered asΛ,h,andr, respectively. The gold layer is coated on the surface of the side polished PCF, and the thickness is depicted bytg.The thermosensitive liquid is placed outside of the gold-coated side-polished PCF.
The proposed temperature sensor uses silica as the background material, and its dispersion relationship is demon-strated by the Sellmeier equation,which is expressed as[21]
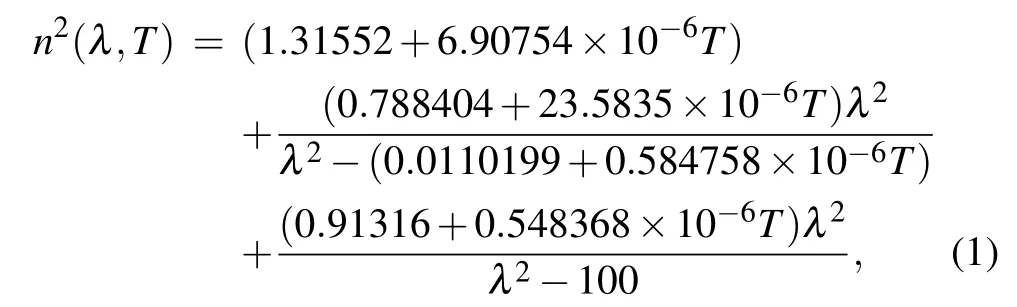
whereλis the incident wavelength,Tis the environment temperature,and their units areμm and°C,respectively. The dielectric constant of the gold attached to side-polished PCF can be calculated using the Drude–Lorentz model, which can be evaluated by[22]
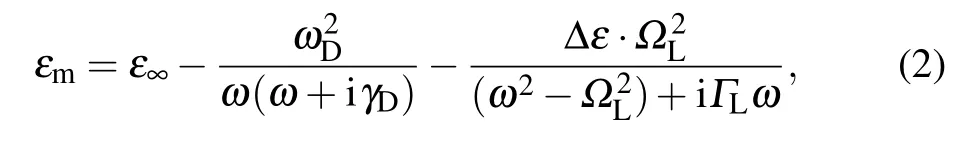
whereε∞=5.9673 is the permittivity in the high frequency.ωis the angular frequency of incident light.γD,ωD,ΩL,andΓLrepresent the damping frequency,plasma frequency,the oscillator strength of the Lorenz oscillator,and the frequency spectrum width of the Lorenz oscillator, respectively.γD/2π=15.92 THz,ΩL/2π=650.07 THz,ωD/2π=2113.6 THz,andΓL/2π=104.86 THz. In addition, the thermosensitive liquid of this temperature sensor is composed of alcohol and chloroform. Its refractive index can be expressed as[23]
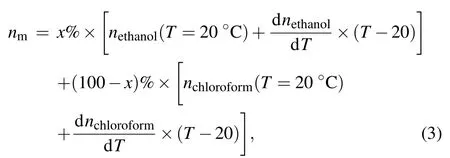
wherex%and(100?x)%are the ratios of ethanol and chloroform in the mixed thermosensitive liquid. dn/dTindicates the thermo–optical coefficient. The values of ethanol and chloroform are?3.94×10?4°C?1and?6.328×10?4°C?1,respectively.When the temperature is 20°C,the refractive indices of alcohol and chloroform are 1.36048 and 1.43136,respectively.The thermosensitive sensitive liquid is a mixture of 80%alcohol and 20%chloroform. It should be noted that the material dispersion of the mixed liquid is ignored in this work. The confinement loss and wavelength sensitivity are respectively determined by[24,25]
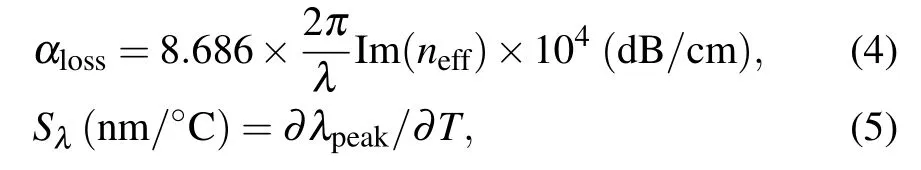
where Im(neff)is the imaginary part of the effective refractive index,?λpeakindicates the change in resonance wavelength,and?Tis the change of temperature.
The transmission relationship between different modes can be investigated by FEM. The real effective refractive index (neff) of the fundamental mode is an important parameter. It has a positive correlation with the plasmon mode.[26]The energy of the core mode will be transferred to the SPP mode in the form of surface plasmon waves(SPWs)when the phase matching condition is reached. The special wavelength at this time is called the resonance wavelength. Consequently,a propagation loss peak will be found at the resonance wavelength. The resonance wavelength will shift when the temperature changes. Therefore, the temperature measurement can be achieved by observing the movement of the resonance wavelength.

Fig. 1. Cross-section of the gold-coated side-polished PCF of the proposed temperature sensor with d1 =0.6 μm, d2 =2.2 μm, d3 =1.6 μm,Λ =2.3μm,h=3.1μm,and tg=40 nm.
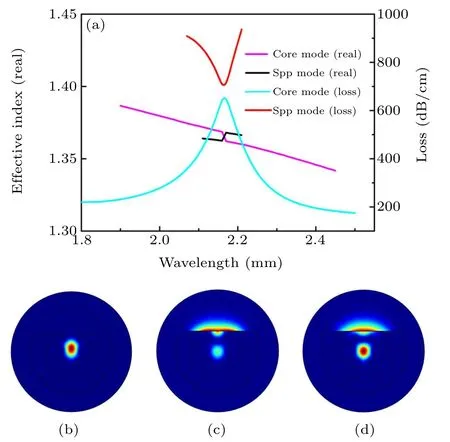
Fig.2.(a)Dispersion relationship between core mode and SPP mode,energy relationship between core mode and SPP mode. Energy distribution of optical field: (b)core mode,(c)plasmonic mode,and(d)coupling of the core mode and the plasmonic mode at the temperature of 40 °C.
3. Results and discussion
3.1. Confinement loss and dispersion relationship
Figure 2(a) shows the loss spectrum and the dispersion relationship between the core mode and the SPP mode at thetemperature of 40°C.The red line and the cyan line represent the loss of SPP mode and core mode, respectively. The resonance wavelength is 2170 nm. The effective refractive indexes of the core mode and SPP mode correspond to the purple line and the black line,respectively.Figures 2(b)–2(d)respectively indicate the optical field distributions of the core mode, SPP mode,and coupled mode in theypolarization direction.
3.2. Optimization of structural parameters
The temperature sensor with different structural parameters will shows different sensing characteristics. In order to achieve the excellent performance, the influences of air hole size, gold layer thickness and polishing depth on the sensor performance were analyzed.
The loss spectrum and the linearity of the sensor with differentd1from 0°C to 60°C are illustrated in Fig. 3. With the increase ofd1, there is a slight blueshift of the resonance wavelength,and the sensitivity is slightly reduced. Moreover,we can see that the small change of thed1has little influence on the performance of the sensor,which increases the realistic manufacturing tolerance of the designed sensor to some extent. Figure 3(d) shows the linearity of the sensor from 0°C to 60°C for differentd1. Whend1=0.4 μm, 0.6 μm, and 0.8 μm, the linearity (R2) is 0.99641, 0.99803, and 0.99934,respectively. Although the sensitivity is not the highest whend1=0.6μm,the linearity is better,so we consider 0.6μm as the diameter of the small air hole.
Figure 4 represents the influence of different gold layer thickness on sensor performance. It can be seen that the thickness of the gold layer has a greater impact on the loss spectrum of the sensor. When the thickness of the gold layer is 30 nm,the spectrum is not good at temperature of 0°C and 10°C.With the increase of temperature,the loss peak appears to increase first and then decrease when the thickness of the gold layer is 50 nm. This is due to the strongest coupling between the core mode and the SPP mode at temperature of 30°C,and the coupling strength becomes weaker as the temperature increases. It can be seen from Fig. 4(d) that the spectrum at 40 nm is better and the sensitivity is higher, so we are more inclined to choose the gold layer thickness of 40 nm.
The loss spectrum at different polishing depths from 0°C to 60°C is shown in Fig.5. As the polishing depth increases,the resonance wavelength has a slight blue shift. The confinement loss decreases when temperature changes from 0°C to 50°C. This is because the effective mode area of the proposed temperature sensor will decrease as the polishing depth increases, which will result in less core mode energy being transferred to the SPP mode.Therefore the confinement loss is reduced. Whenh=2.9μm,the loss peak does not always increase with the increase of temperature,but decreases at 60°C.That happens because the coupling between core mode and SPP mode is weakened,and the energy of the core mode cannot be transferred to the SPP mode in a large amount. Although this data changes, the sensitivity of the temperature sensor hardly changes. It can be seen from Fig. 5(d) that the linearity with the deeper polishing depth is better, so the polishing depth is considered to 3.1μm.

Fig.3.Loss spectrum from 0°C to 60°C:(a)d1=0.4μm,(b)d1=0.6μm,(c)d1=0.8μm.(d)The linear fitting of the resonance wavelength in the case with three different d1.

Fig.4. Loss spectrum from 0 °C to 60 °C:(a)tg=30 nm,(b)tg=40 nm,(c)tg=50 nm. (d)The linear fitting of the resonance wavelength in the case of three different tg.
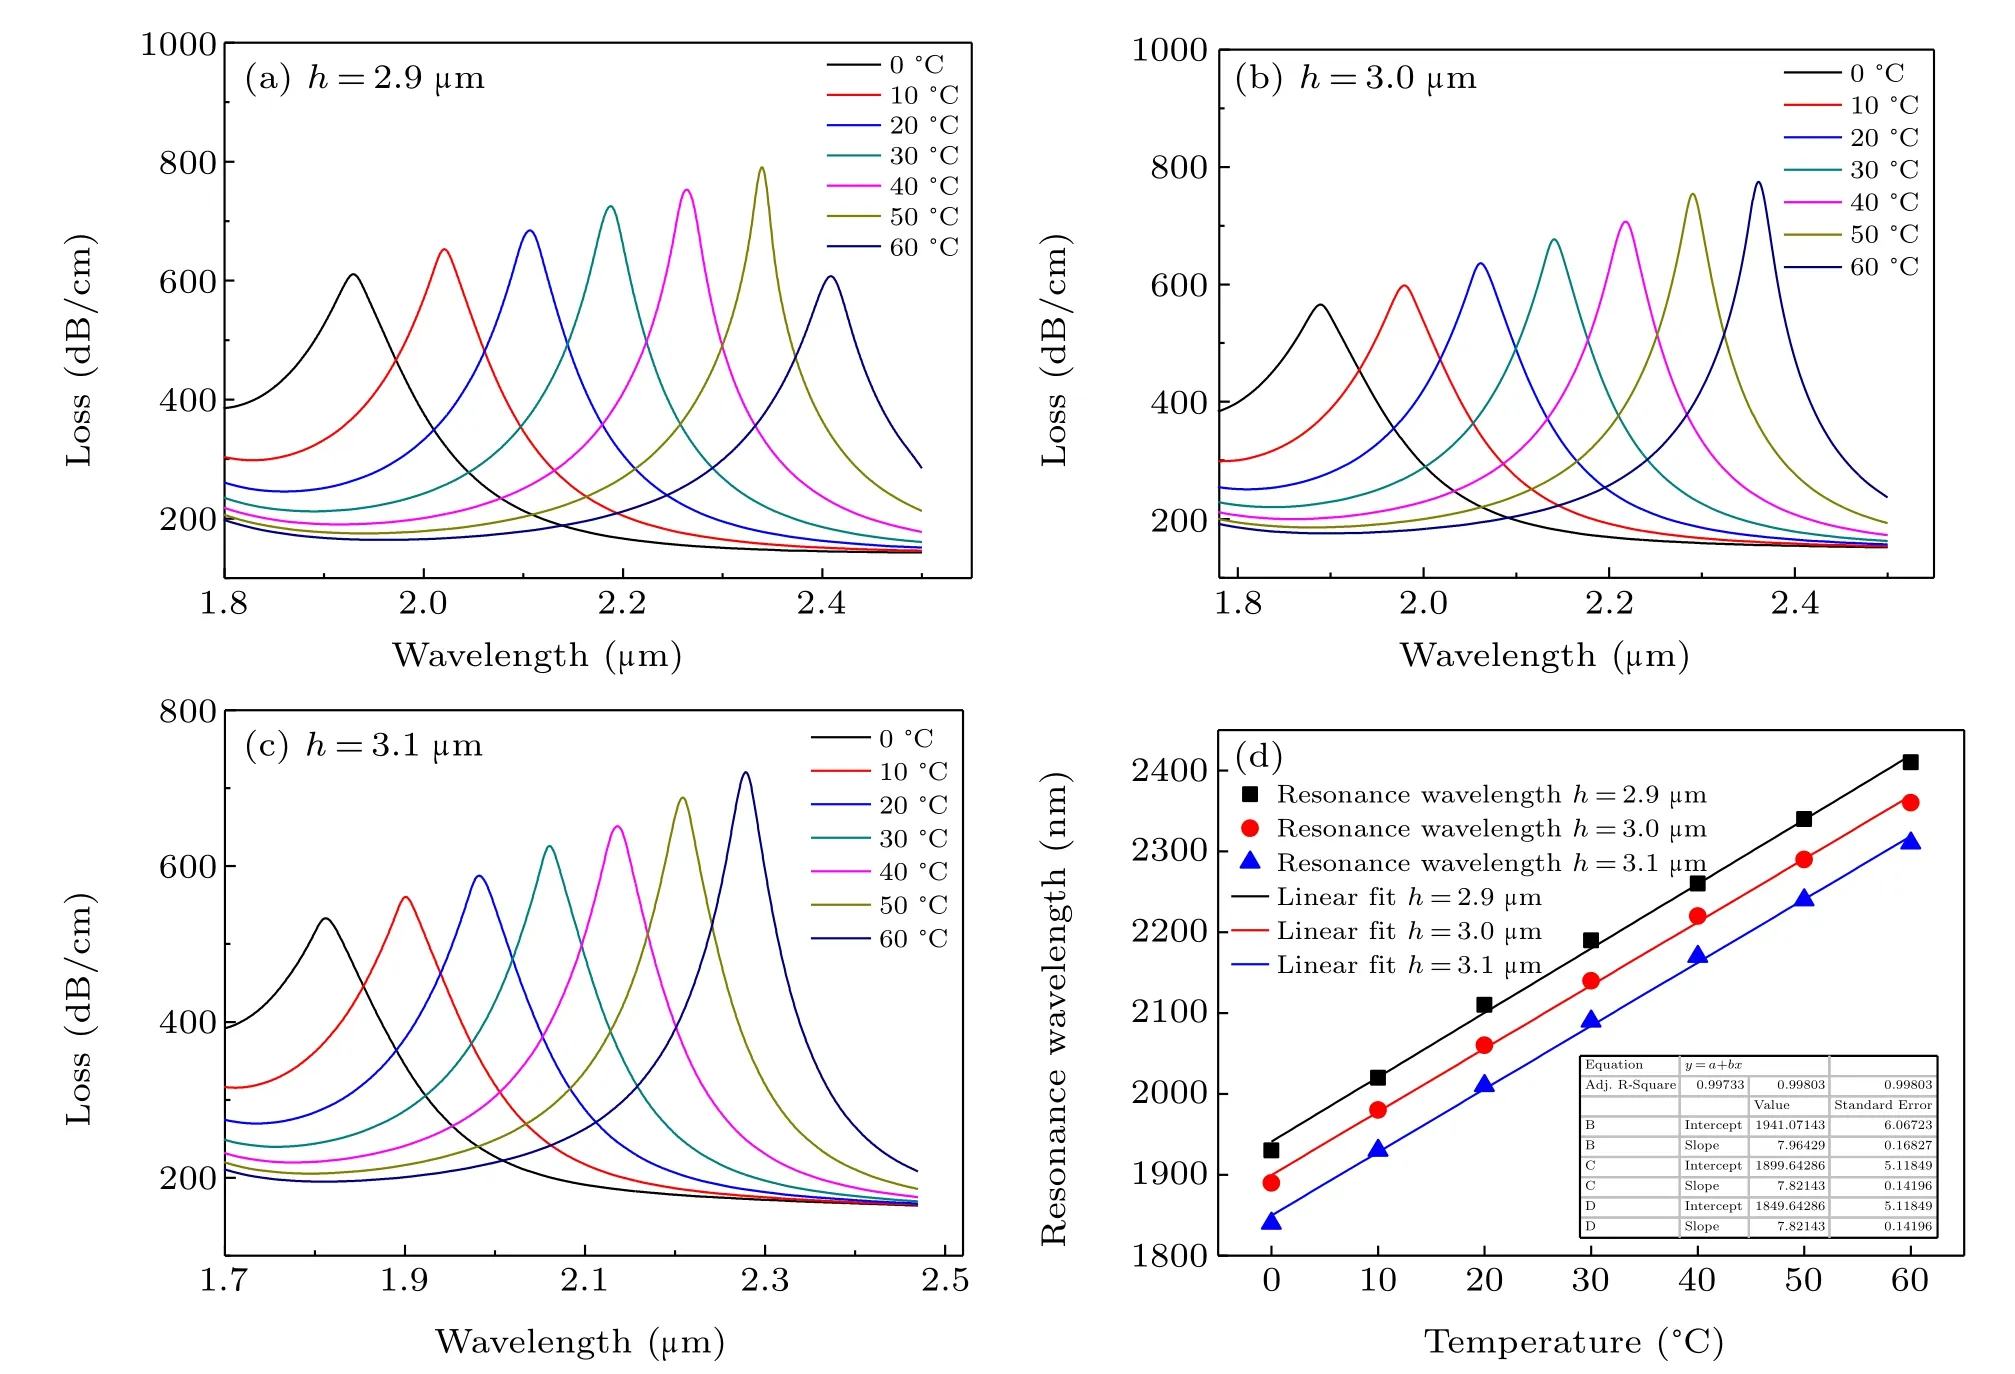
Fig.5. Loss spectrum from 0 °C to 60 °C:(a)h=2.9μm,(b)h=3.0μm,(c)h=3.1μm. (d)The linear fitting of the resonance wavelength in the case of three different h.
3.3. Sensing performance of the proposed temperature sensor
The loss spectrum of the proposed sensor at different temperatures is illustrated in Fig.6(a).It can be seen that the spectrum is particularly good and the resonance wavelengths are 1840 nm, 1930 nm, 2010 nm, 2090 nm, 2170 nm, 2240 nm,and 2310 nm, respectively. Since the thermosensitive liquid we used corresponds to different refractive indexes at different temperatures, and the SPR is very sensitive to the change in refractive index near the metal film. So the change in refractive index of thermosensitive liquid corresponds to the change in temperature, and the corresponding resonance wavelength will also change. In this chart,as the temperature increases,a red shift of the resonance wavelength is observed. Figure 6(b)shows the linear fitting of the relation between the resonance wavelength and temperature. The results show that the proposed sensor has high linearity (R2=0.99803), and the sensitivity is 7.82 nm/°C. These results indicate that the performance of the proposed temperature sensor is better than the reported previously.[17–20]
The resolution of a temperature sensor describes that the smallest variation of the temperature can be detected by this sensor. The resolution of the proposed temperature sensor can be calculated as[27]
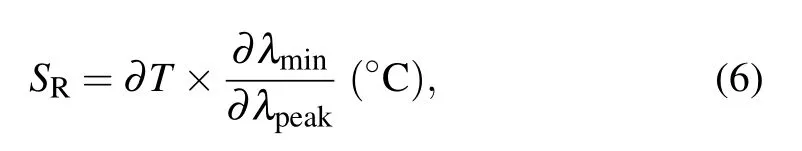
where?Tis the change of temperature,?λpeakrefers to the wavelength of the loss peak difference, and?λminindicates the minimum wavelength resolution. From Eq. (6), the resolution at 0°C and 50°C is 1.1×10?3°C and 1.4×10?3°C,respectively. Therefore, the proposed sensor has the ability to response to a small variation of temperature at the order of 10?3.
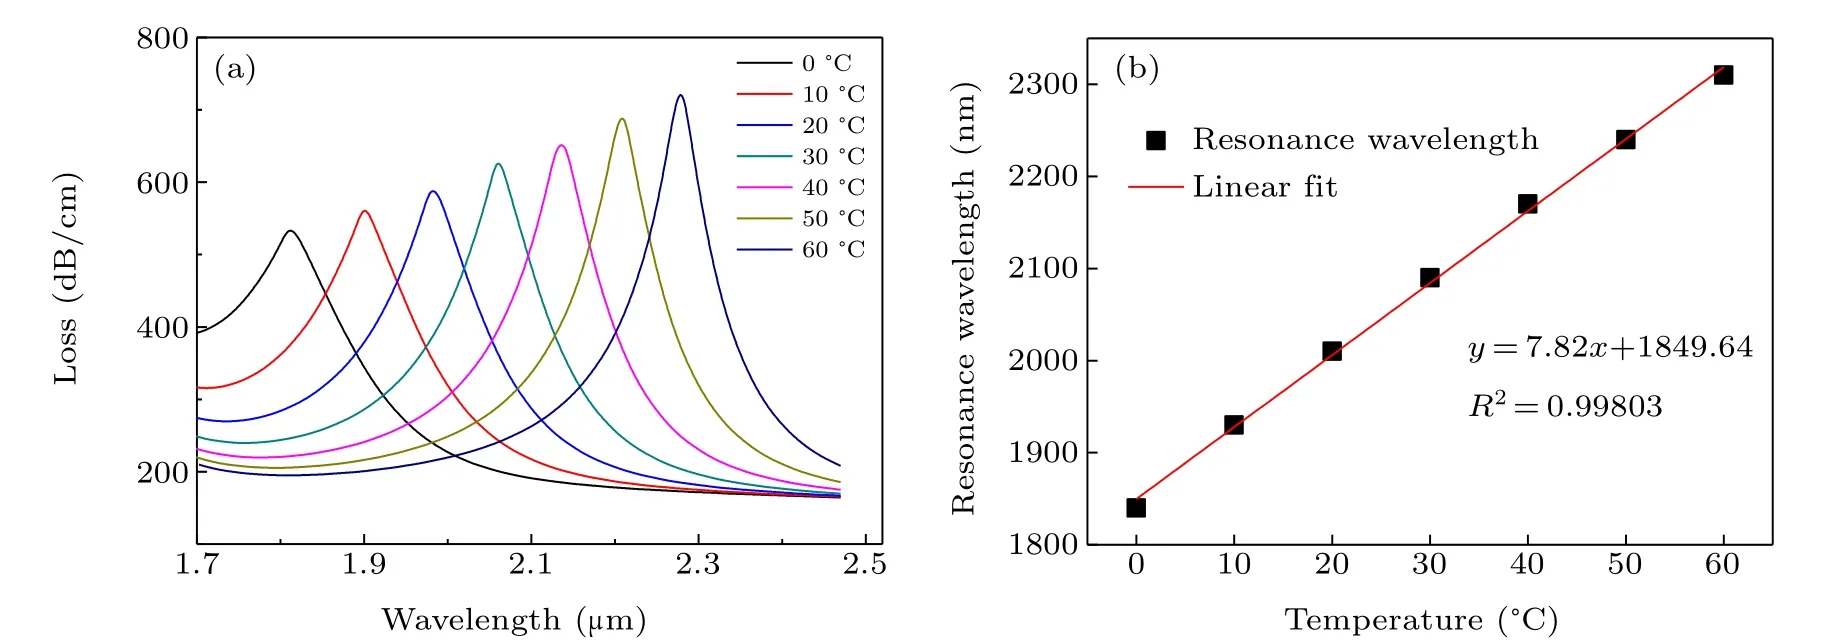
Fig.6. (a)The loss spectrum of the sensor from 0 ° to 60 °. (b)Linear fitting of sensor resonance wavelength.
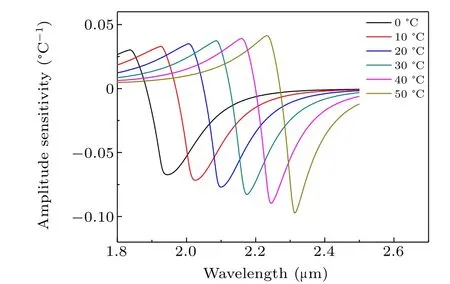
Fig.7. Amplitude sensitivity of the temperature sensor from 0 °C to 50 °C.
Amplitude sensitivity is an important parameter,it can be expressed as
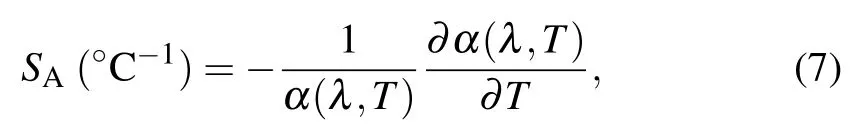
whereαis defined as the loss value for anyT,and?α(λ,T)is the loss difference for two adjacent thermosensitive liquid temperature. The amplitude sensitivity obtained by Eq.(7)is shown in Fig. 7. It can be seen that the amplitude sensitivity becomes higher as the temperature rises. Higher temperature reveals the stronger loss and,as a consequence,amplitude sensitivity increases. Amplitude sensitivities are expressed about 0.0674,0.0720,0.0774,0.0841,0.0918,and 0.1008°C?1,respectively,with the temperature of 0,10,20,30,40,and 50°C,respectively.
There are some other important parameters to investigate the performance of the sensor, which is closely related to the full width at half maxima (FWHM) of the loss curve. These parameters are signal-to-noise ratio (SNR), figure of merit(FOM), and detection limit (δn), respectively. They can be expressed as[28]
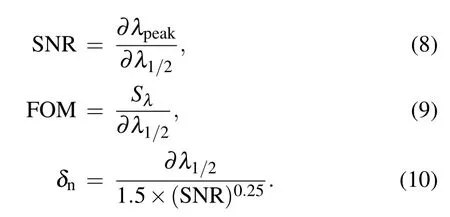
In Eqs. (8)–(10),?λ1/2represents FWHM of the loss curve for respective temperature. And the computed results are tabulated in Table 1.
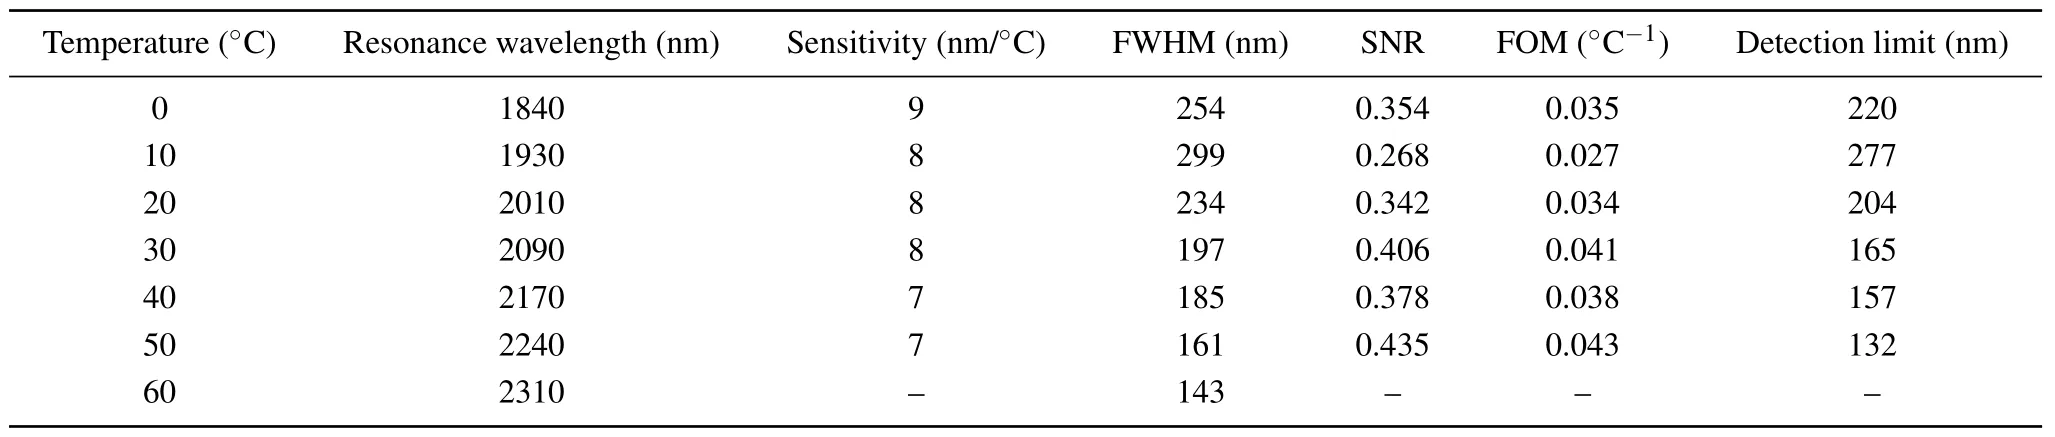
Table 1. Sensing performance of the proposed SPR sensor.
4. Generalized measurement setup
The side polished PCF can be prepared by professional grinding machines. The PCF is connected to the laser and the optical power meter,the polishing depth can be accurately obtained by measuring the power of the received light during the polishing process.[29]Using commercial magnetron sputtering equipment,the gold layer can be coated on the PCF.[30]The experimental principle of the proposed temperature sensor is shown in Fig.8. First of all,a single-mode fiber is fused on both ends of the gold-coated side-polished PCF to facilitate the connection of the light source and the spectrometer,and then the PCF is put into the temperature chamber. At this time, the light source is turned on, and the incident light enters the PCF through the single-mode fiber. It interacts with the gold and causes surface plasmon excitation, and the energy of the core mode will be transferred to the SPP mode.Consequently,a trough will be displayed on the spectrometer.Finally, we change the temperature through the temperature control chamber,the movement of the trough will be displayed on the spectrometer, and sensing characteristics of the sensor can be measured by the movement of the trough.
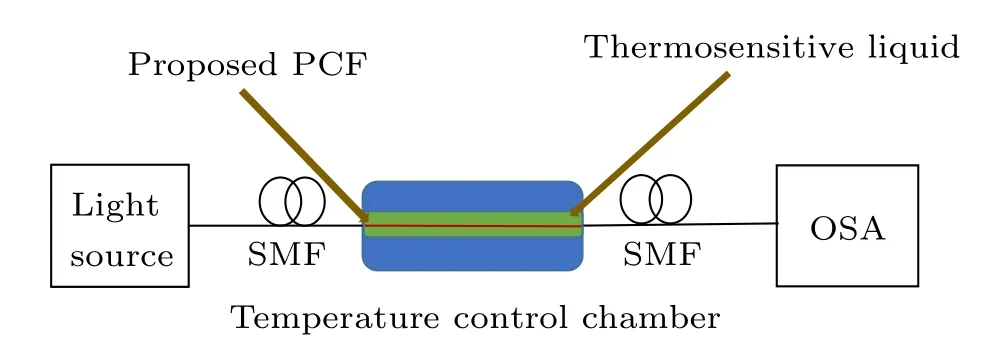
Fig.8. The experimental principle of the proposed temperature sensor.
5. Conclusion
A high sensitivity and high linearity SPR based PCF temperature sensor is proposed in this article.Both the thermosensitive liquid and the gold layer are deposited on the outer surface of the side-polished PCF to reduce the fabrication complexity. After we optimized the structure parameters, a high sensitive and high linear temperature sensor was obtained.The temperature detection range of the sensor is 0°C to 60°C,and the sensitivity is as high as 7.82 nm/°C.The sensor shows good linearity(R2=0.99803)and resolution of 1.1×10?3°C?1as well. The simulation results show that the size of the small air hole and the polishing depth have little influence on the sensitivity of the sensor. Therefore,the requirements for manufacturing accuracy of the sensor are reduced. Such excellent temperature sensing characteristics and low difficulty for fabrication make the proposed sensor have a distinctive advantage in temperature measurement.
Acknowledgments
Project supported by the National Natural Science Foundation of China (Grant No. 12074331), the Natural Science Foundation of Hebei Province, China (Grant No. F2020203050), and the Postdoctoral preferred funding research project of Hebei Province, China (Grant No.B2018003008).

- Chinese Physics B的其它文章
- A broadband self-powered UV photodetector of a β-Ga2O3/γ-CuI p-n junction
- High-sensitive terahertz detection by parametric up-conversion using nanosecond pulsed laser
- High efficiency,small size,and large bandwidth vertical interlayer waveguide coupler
- High-fidelity resonant tunneling passage in three-waveguide system
- An analytical model for cross-Kerr nonlinearity in a four-level N-type atomic system with Doppler broadening
- Determine the physical mechanism and source region of beat wave modulation by changing the frequency of high-frequency waves