Heterogeneous traffic flow modeling with drivers’timid and aggressive characteristics?
2021-10-28 07:20:04CongZhai翟聰WeitiaoWu巫威眺andSongwenLuo羅淞文
Chinese Physics B 2021年10期
Cong Zhai(翟聰) Weitiao Wu(巫威眺) and Songwen Luo(羅淞文)
1School of Civil Engineering and Transportation,South China University of Technology,Guangzhou 510641,China
2School of Transportation and Civil Engineering and Architecture,Foshan University,Foshan 528000,China
Keywords: heterogeneous car-following model,driver characteristic,penetration rate,stability
1. Introduction
Traffic congestion and emission are the major issues in the transportation engineering. The growing number of ridership results in unprecedented advances in traffic management technology, such as public transit operational strategies[1–3]and transportation electrification.[4]A good understanding of driving behavior and traffic flow can also benefits the transportation planning and control. This raises a distinct line of research on the traffic flow modeling in an aim to analyze the formation and propagation mechanism of traffic congestion.
Methodologically,traffic flow models can be grouped into two categories: microscopic models and macroscopic models.The former group is represented by car following models[5–10]and cellular automaton models,[11–13]while the latter is represented by continuous flow models[14–19]and lattice hydrodynamics models.[20–27]Different to microscopic models,the macroscopic models take the traffic flow as a compressible continuous fluid composed of a number of vehicles,of which the simulation time is indifferent to the number of vehicles.However, the macroscopic models cannot capture the interactions among vehicles and the resulting microscopic driving behaviors. In comparison, the microscopic models take individual vehicles as the research object, which facilitates the analysis of driving behaviors of each vehicle. Given these advantages, the microscopic traffic flow models have promoted rapidly in the transportation research community over the past decades.
In 1995, Bandoet al.[28]proposed a seminar work of single-lane car-following model. This work is a stimulusresponse model, where the stimulus source is the difference between the real-time speed and the optimal speed of the target vehicle. As opposed to previous microscopic traffic flow models, this model introduced the optimal velocity function with inflection points, enabling to perform linear and nonlinear stability analysis to obtain kink–anti-kink solitary waves.Since then,this model has been widely applied in the field of traffic flow research, especially in traffic physics, and a number of extended models have been given. For example,Zhang and Tang[29]proposed a car-following model accounting for the preceding car’s taillight, which showed that the taillight effect can improve the traffic flow stability and enhance the safety. Jin and Cheng[30]considered the effect of the optimal velocity changes with memory in the car-following model.Liet al.[31]incorporated the time-varying reaction time delay of the drivers in the car-following model, and designed a robust state feedback control strategy to suppress the traffic jam.Liet al.[32]presented a car-following model for electronic vehicle traffic flow to minimize the energy consumption. Table 1 provides an overview of the extended models of the traditional optimal velocity car-following model.
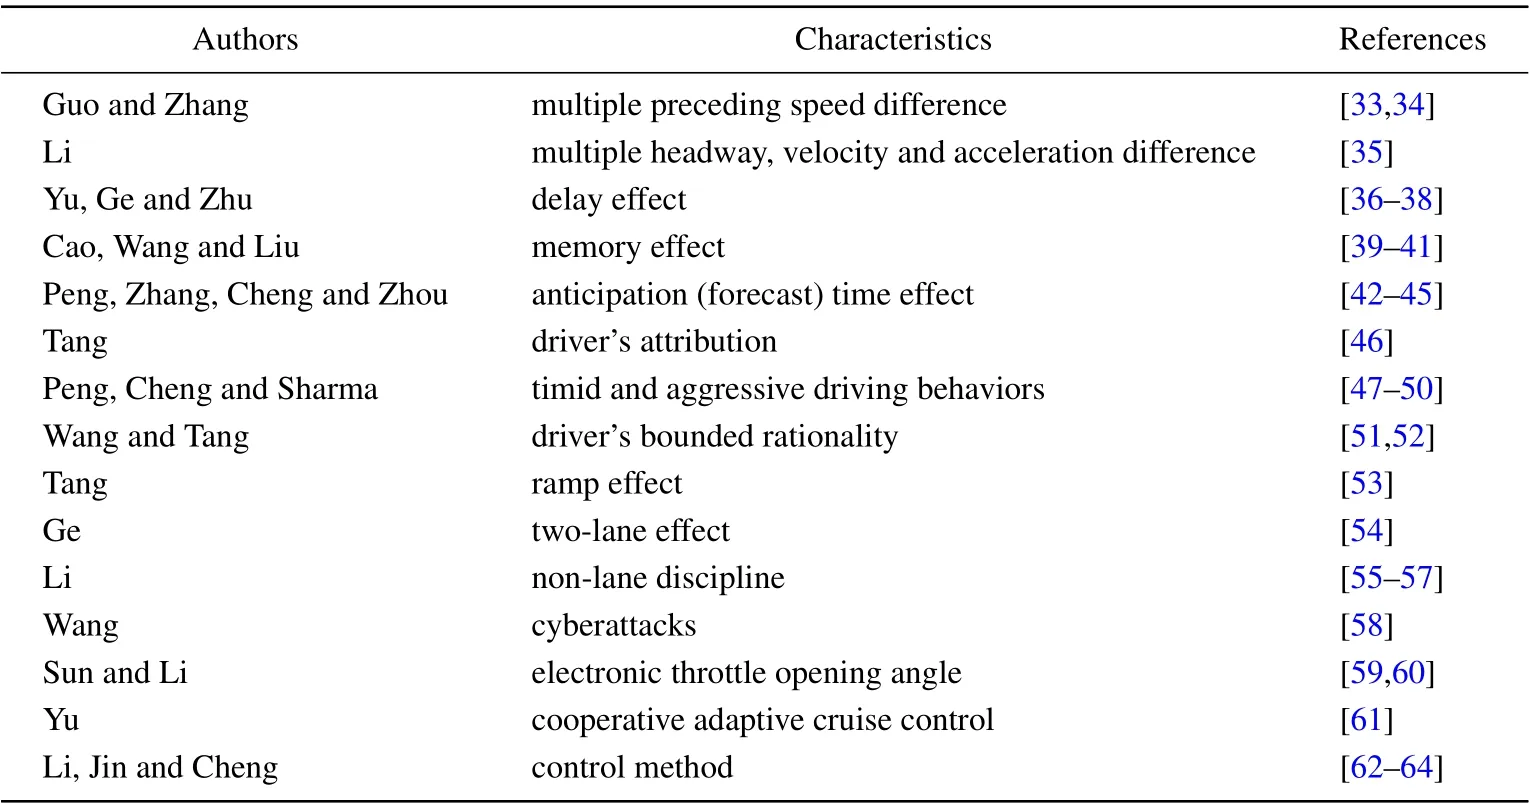
Table 1. Research overview of optimal velocity car-following model.
Although a variety of factors have been investigated in the car-following models,most of the extant studies primarily focused on one single type of drivers and vehicles, underlying that the drivers are homogeneous. However, in the real traffic environment, the driving behaviors are heterogeneous in the presence of different driver’s characteristics, such as the age, gender, and vehicle types. There are only a handful of works that investigate the heterogeneous traffic flow. At the micro level,Yanget al.[65]developed a car–truck cellular automata model considering the difference in safety distance,reaction time and randomization probability. Liet al.[66]presented a cellular automata traffic flow model considering the differences in acceleration and delay probabilities of different types of vehicles. Literatures[67–70]introduced the differences in driver’s sensitivity, anticipation driving behavior and maximum and minimum speed and driver’s psychological headway of different types of vehicles into the optimal velocity car-following model. At the macro level, considering that the difference of electronic throttle angle between different types of vehicles and the psychological headway between different types drivers, two heterogeneous continuous flow models were proposed in literatures.[71,72]As pointed out by literatures,[47–50]the driving style can be roughly divided into two types: aggressive and timid, based on the prevalent driving behavior. The former group of drivers with skillful driving capability speed up by taking advantage of predicted traffic state, while the latter group is risk aversion and more prudent in acceleration. Although the driver’s characteristics(e.g.,timid and aggressive)is a proven contributor to the traffic flow performance,the underlying assumption in most of the extant studies is that all drivers are homogeneous(see our analysis in Section 2). In the real traffic environment, the drivers are distinct due to a variety of factors. Motivated by this fact,in this paper we will construct a new heterogeneous traffic flow model with different driver’s characteristics. The heterogeneity is reflected by their personality characteristics (i.e., timid and aggressive) and the corresponding penetration rates. To the best of our knowledge, this is the first time that the effect of timid and aggressive drivers is simultaneously incorporated into the heterogeneous car-following model. This research is expected to provide theoretical insights into the microscopic traffic flow simulation and traffic control.
The structure of this paper is as follows: In Section 2,a new heterogeneous traffic flow model considering different driver’s characteristic is given. In Section 3,the stability criterion is obtained through performing a linear stability analysis.In Section 4, the impact of critical parameters is investigated by simulation. The conclusions of the paper and future works are given in Section 5.
2. Model
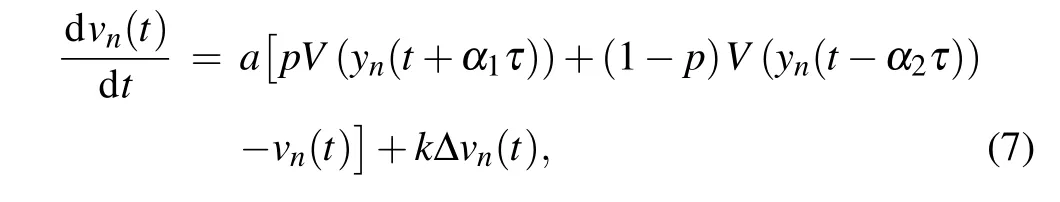
In this section, we will revisit the traditional model and introduce the rationale behind our proposed model. The primary notations used in this paper are listed in Table 2. To analyze the car-following behaviors on a single lane,Bandoet al.[28]proposed an optimal velocity (OV) model, the motion equation of which is
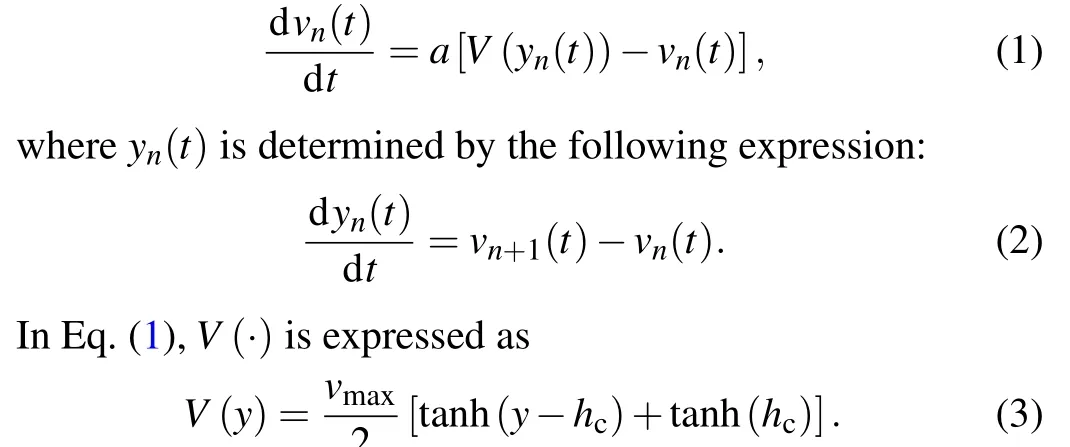
Following the literature,[28]we havevmax=2,andhc=4.
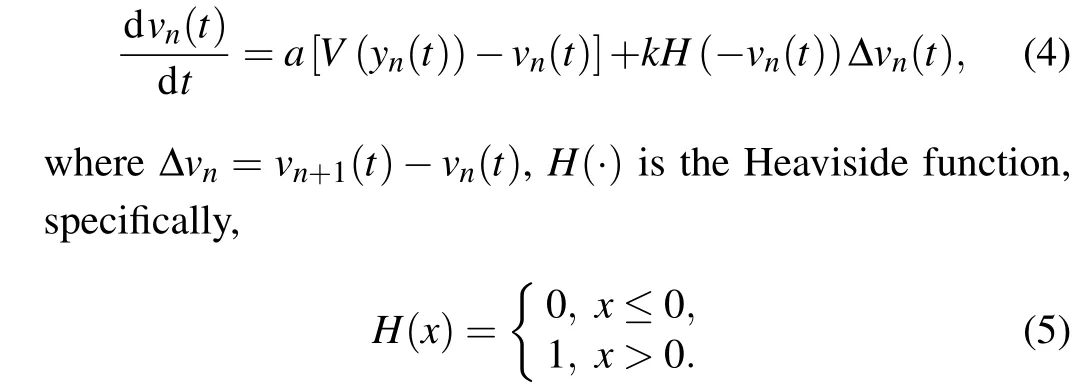
Later,Helbing and Tilch[73]carried out the parameter tuning on the OV model based on the measured data. They found that the acceleration of the vehicle is too large and the deceleration is unreasonable,such that the collisions may even occur.For this reason, they proposed that the influence of the speed difference should be included when the current vehicle speed is lower than the following vehicle. As a result, the general force(GF)model is given,specifically,
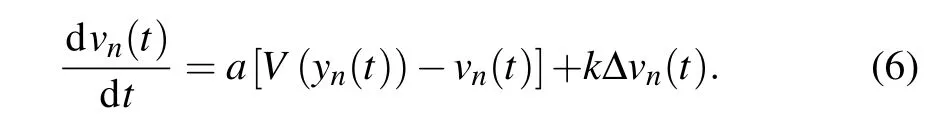
Jianget al.[74]used the above GF model to simulate the start-up process of a stationary vehicle and found that the starting wave speed of the traffic flow was too small. Given this fact, they proposed that the effect of speed difference should be considered when the current vehicle speed was greater than the following vehicle. Consequently, the full velocity difference (FVD) model was presented, and the formulation is expressed as follows:
As mentioned previously, the driving styles are affected by a variety of factors such as personality characteristics and driving years. Generally,the drivers exhibit two types of driving styles,i.e.,aggressive and timid characteristics. When the aggressive characteristics dominate,the external performance of drivers will be aggressive. To pursue a faster driving speed,aggressive drivers will predict the next time step traffic situation based on their experience and use the forecast traffic information to adjust the vehicle speed. On the contrary,when the timid characteristics dominate, the drivers are inclined to use the traffic state at the last moment to adjust the vehicle acceleration. Based on this,Penget al.[47]presented a homogeneous car-following model by incorporating the timid and aggressive driving behaviors. The motion equation is specified as follows:
where the values of prediction time and delay time can be obtained through traffic survey. To ease the subsequent analysis,we assumeα1=α2=α. When 0≤p<1/2(1/2
Remark 1 According to Eq. (7), the driver characteristics of then-th car are also determined by the parameterp,α1, andα2, whereby the motion equation of then-th car can be given. To analyze the effect of driver’s characteristics,previous works[44–48]assumed that the dynamic equations of all vehicles along the road comply with Eq. (7). As such, if the driver ofn-th vehicle is a timid (aggressive) characteristic,then the remaining drivers on the road are also timid(aggressive),which indicates that all drivers are homogeneous.In this way,different characteristics of each driver are ignored. Since drivers in the real traffic environment are affected by a variety of factors such as age and personality, the above assumption is difficult to defend. In reality,there exist differences among drivers on the road. For example,both aggressive drivers and timid drivers coexist on the road.Even if all drivers on the road are of the same type(i.e., all drivers are timid or aggressive),some personality differences still exist. The distinctions are mainly reflected by the difference of parameterpin Eq.(7).
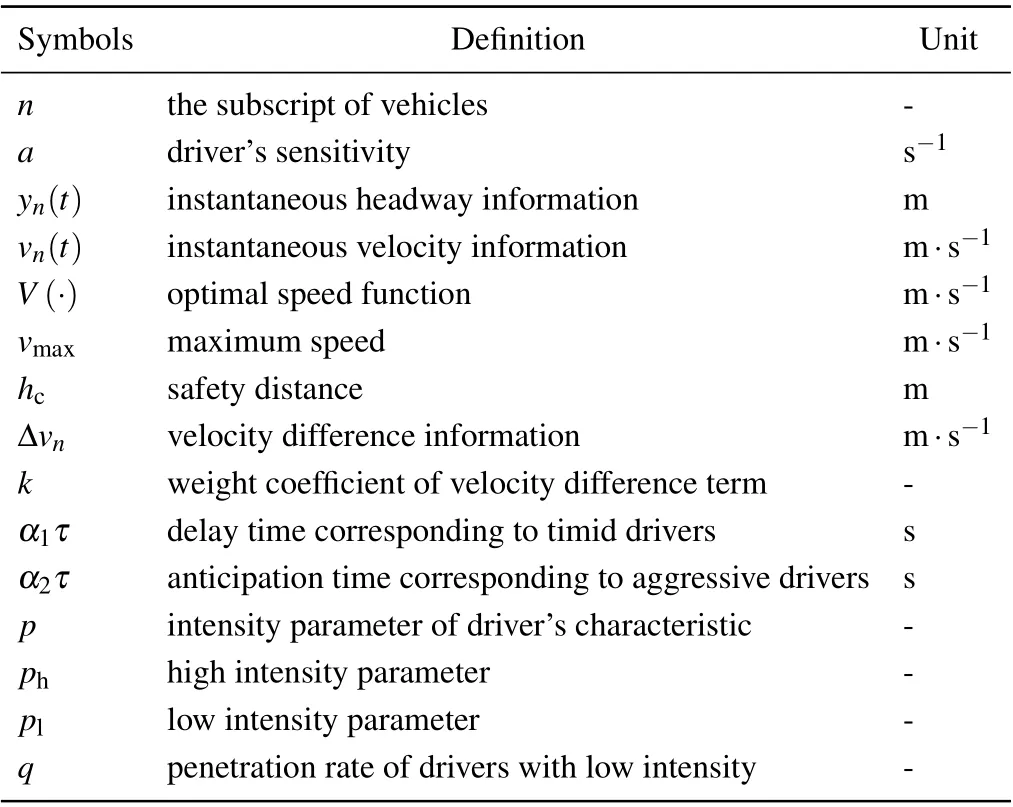
Table 2. Primary notations used in the proposed model.
Based on the above analysis,we assume that there are two different types of drivers on the road.To this end,we introduce parameterqto represent the heterogeneity between drivers on the road. As a result,an extended traffic flow model with heterogeneous drivers’ characteristics is proposed, and the specific expression of the proposed model is given as follows:

Ifq=0 orq=1, our heterogeneous traffic flow model collapses into the traditional homogeneous traffic flow model.
Remark 2 Although the parameterαmay vary among different drivers,this study focuses on the impact of different driver’s characteristics on traffic flow stability. Therefore, in the future study we will further analyze the effect of different driving skills on the stability of traffic flow under the same driver’s characteristics.
3. Linear stability analysis
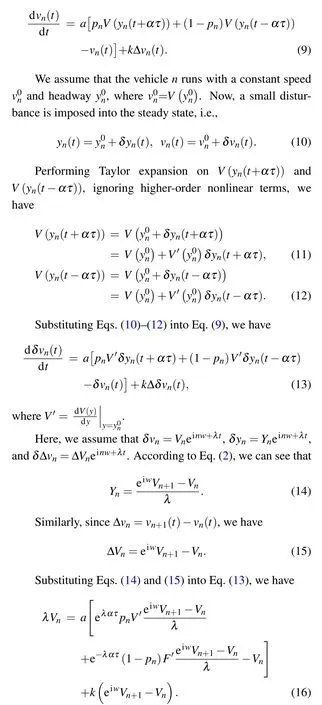
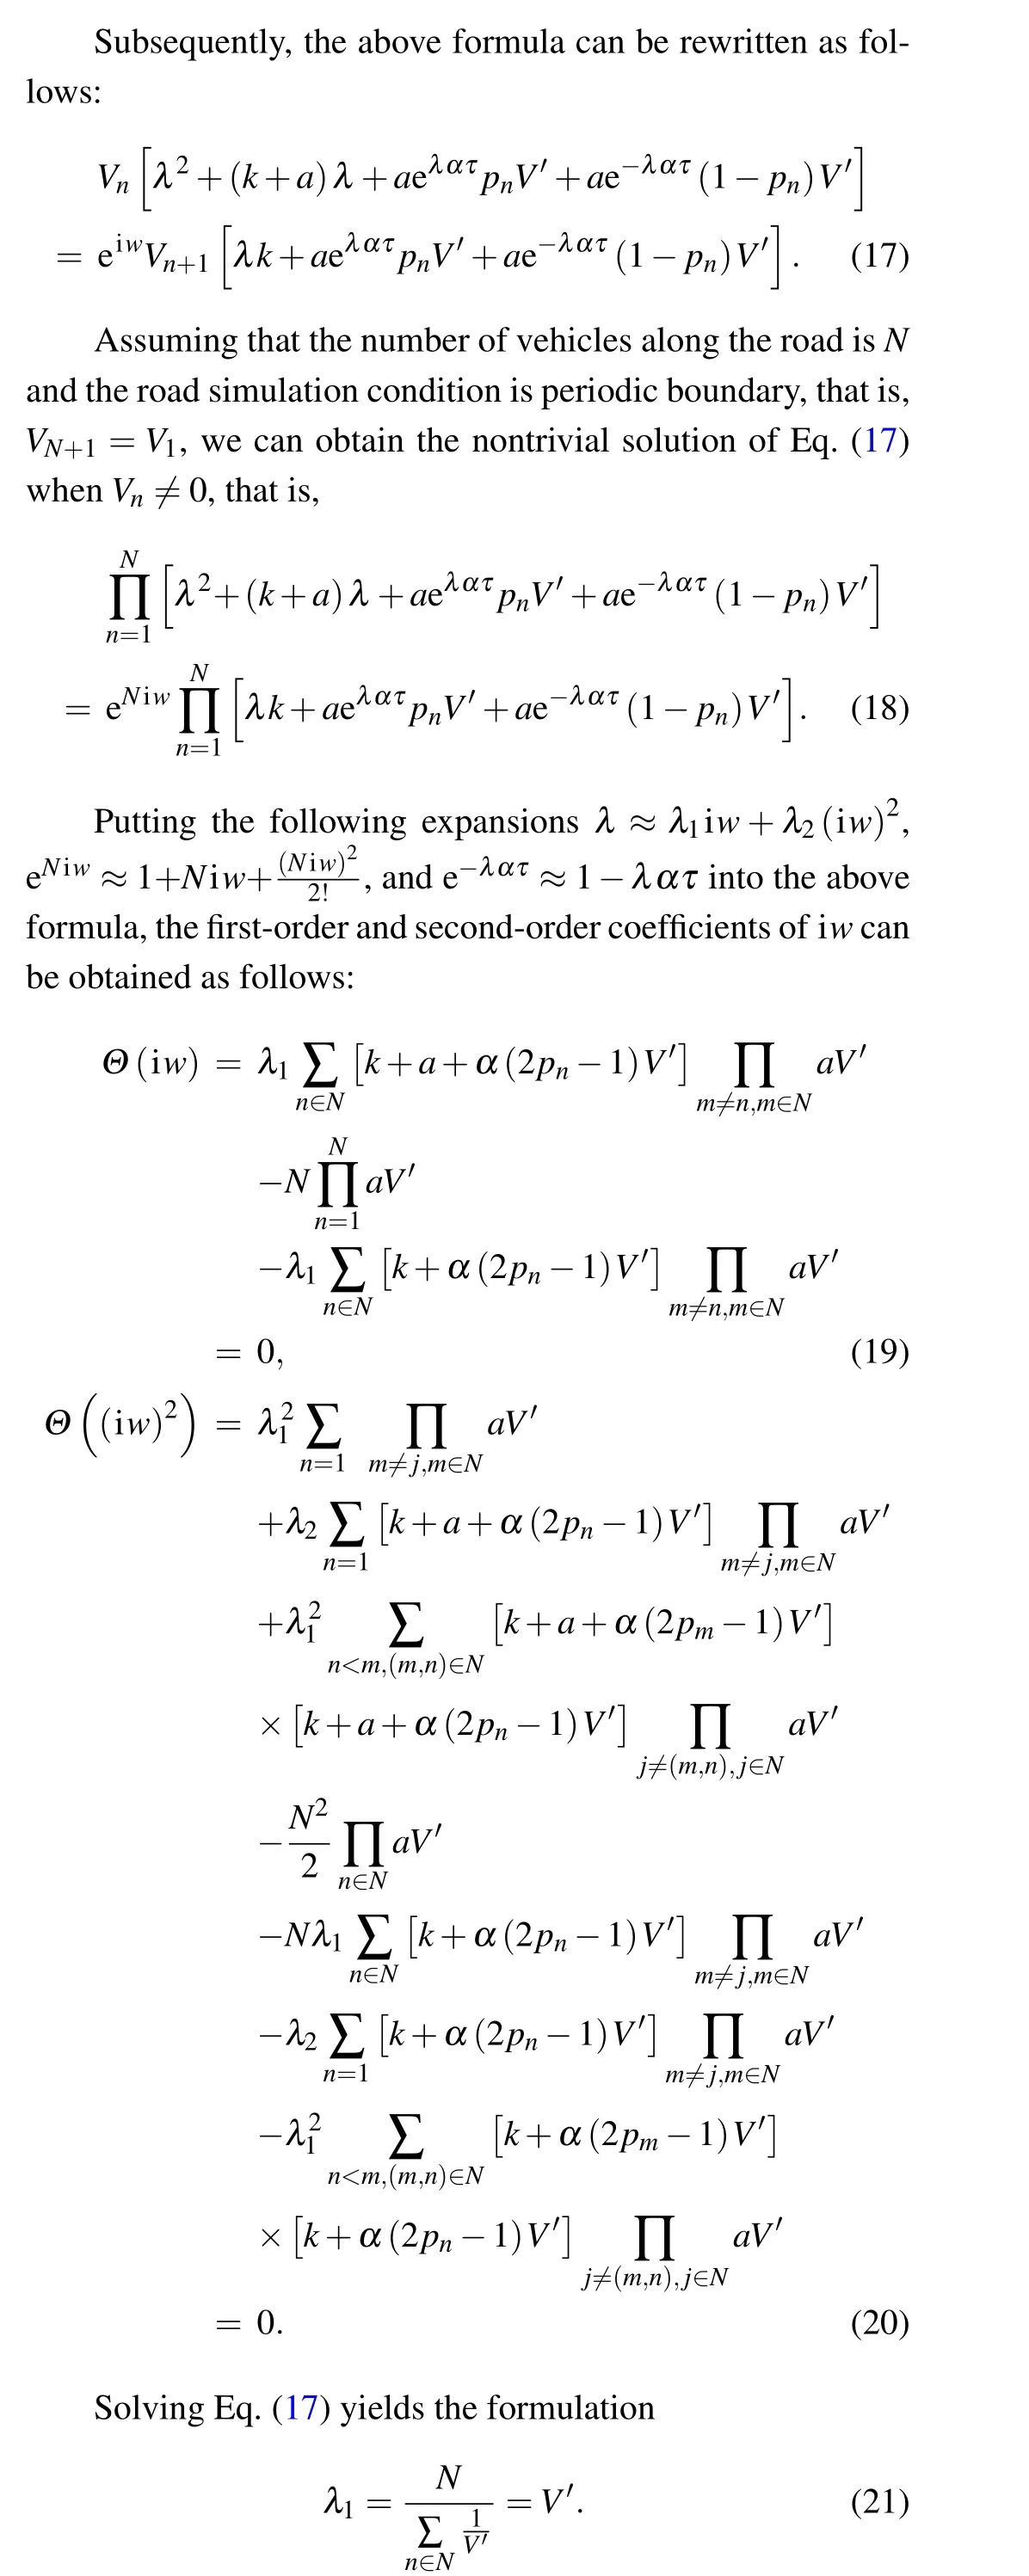
In this section, we will analyze the stability of the new heterogeneous traffic flow model based on the perturbation method. To facilitate the analysis, we first transform Eq. (8)into the following form:
The above curve is consistent with the conclusion in the literature.[74]Therefore,the heterogeneous traffic flow model proposed in this paper can be regarded as a generalized form of the traditional homogeneous traffic flow model.
Figure 1(a)shows the neutral stability curve under different values of penetration rate of drivers with low intensityq,where the apex of the curve represents the critical point. The entire phase space is subdivided into two parts by this curve.The area above the curve is the stability region,while the area below the curve is an unstable region. As the value of parameterqincreases, the critical point of the curve rises, such that the entire stability area is compressed and the traffic flow stability is weakened.Figure 1(b)shows the corresponding relationship between the critical point and the parameterq. As we can see, as the value of parameterqincreases, the critical point also shows an increasing trend. This conclusion also explains Fig.1(a).
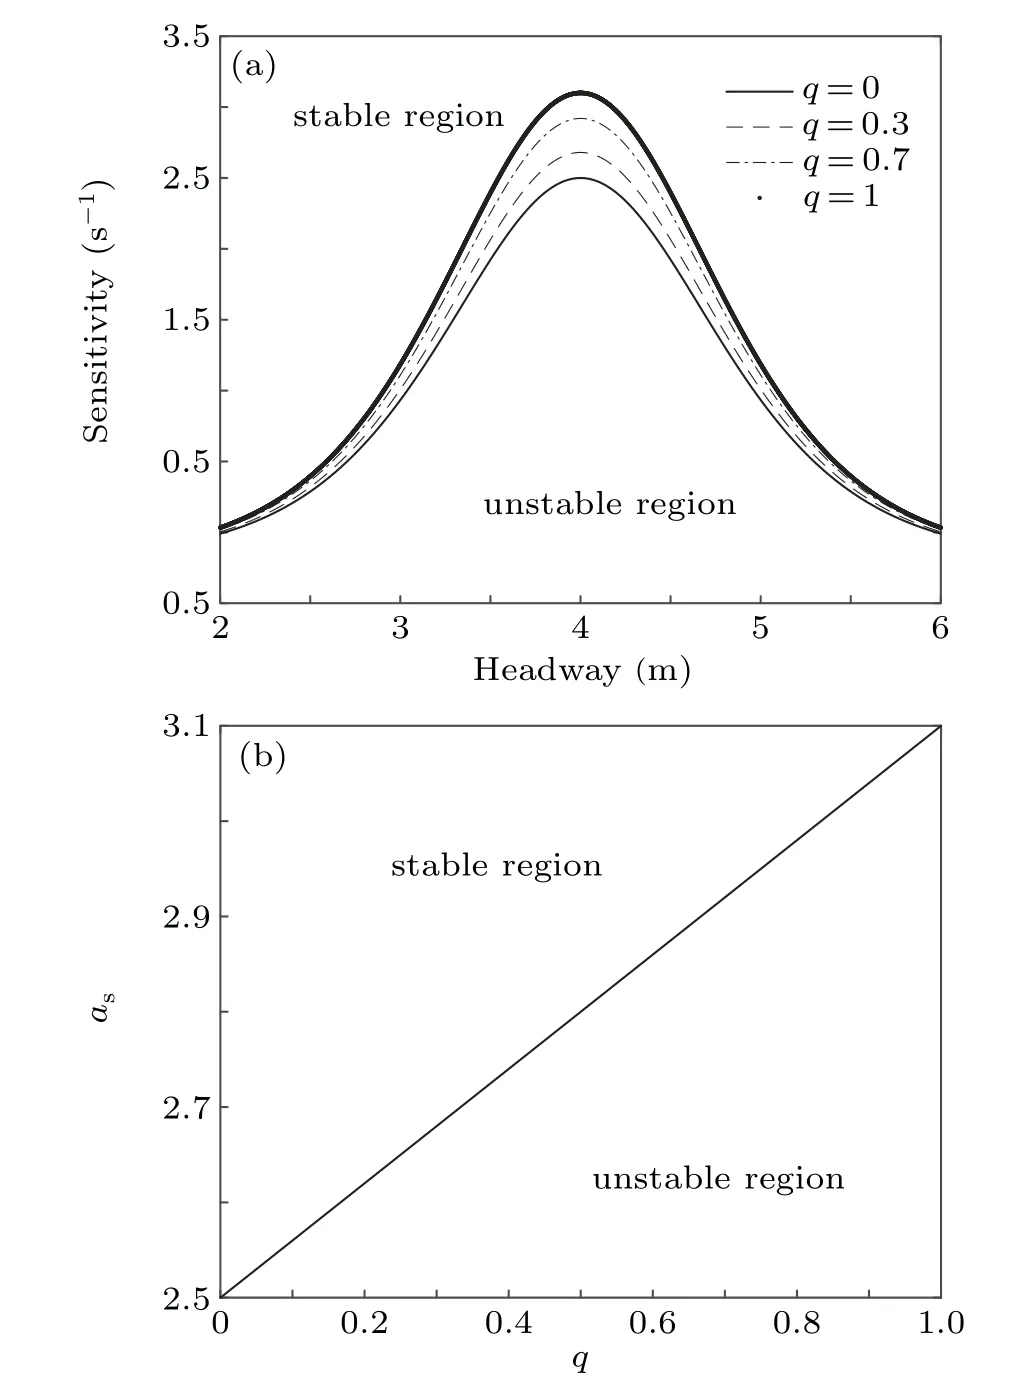
Fig. 1. (a) Neutral stability curves under different values of the parameter p. (b) Critical point as against the parameter p, where pl =0.3, ph =0.7,α =0.25,and k=0.1.
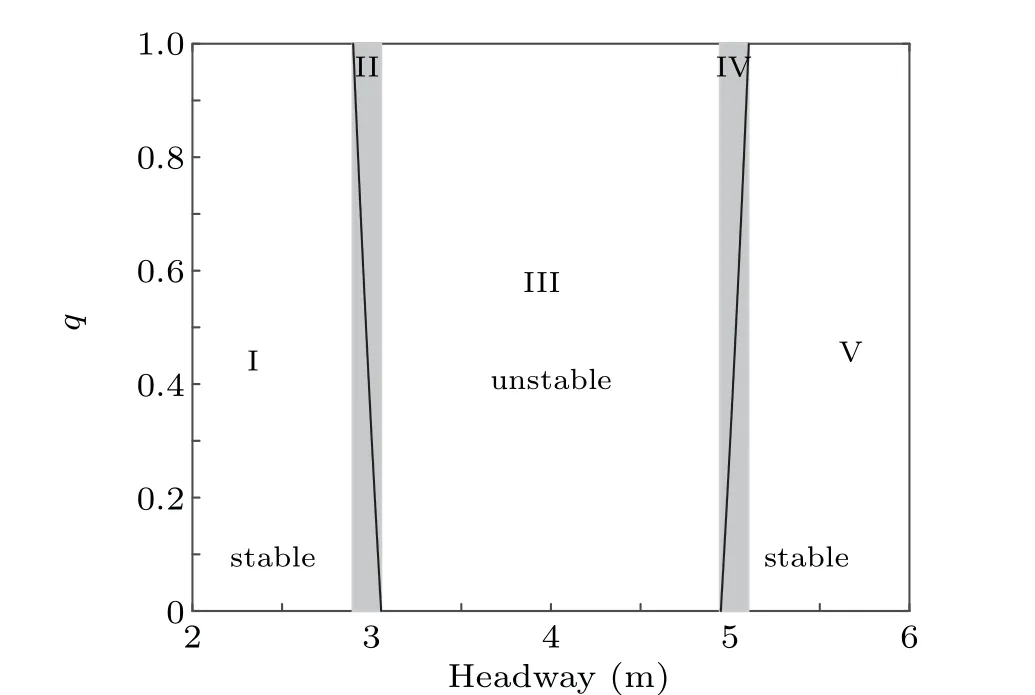
Fig.2. The space(y,p)divided into five distinct regions by the critical curve.
In order to better quantify the relationship between the parameterqand the headwayy, the neutral stability curve is simplified as follows:
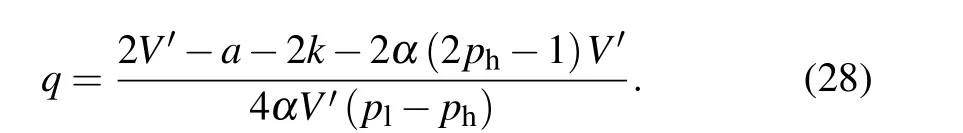
Figure 2 shows the neutral stability curve in the phase space(y,p). As we can see,the entire phase space is divided into five regions by the neutral curve. In the high-density region I and the low-density region IV,the heterogeneous traffic flow satisfies the stability regardless of the value of coefficientp.When the headway ?xfalls into regions II and IV,as the parameterpincreases, the stability of the heterogeneous traffic flow is weakened. When the headway ?xfalls into region III,the stability of the heterogeneous traffic flow is not satisfied regardless of the value of the coefficientp,such that any small disturbance will evolve into a traffic jam.
In the literature, the impact of heterogeneity and traffic flow stability was analyzed by simulation, whereas no evidence on analytical results has been provided. To address this issue,we assume that the penetration rate of drivers with low intensity parameter of driver’s characteristics is half,i.e.,q=1/2,and introduce the following variables:
wherepais the average value of two intensity parameter of driver’s characteristicsplandph,and ?pis the standard deviation of all drivers.
Fig.3. (a)Neutral stability curves under different values of the parameter pa.(b) Critical point as against the parameter pa, where α =0.1, k=0.1, and?p=0.1.
Substituting Eq. (29) into Eq. (25), the following new neutral stability curve can be obtained:
Figures 3 and 4 present the effect of the average valuepaand standard deviation ?pon the traffic flow stability,respectively. We can see that the effects of these two parameters on traffic flow stability are quite distinct.More specifically,as the value of parameterpaincreases,the critical point of the curve reduces and the area of the stability area expands,which indicates that the stability of traffic flow is enhanced. As shown in Fig.4,the change of neutral stability curve is trivial as the parameter ?pincreases,and that the critical point is nearly an constant(Fig.4(b)).
Fig.4. (a)Neutral stability curves under different values of the parameter?p.(b) Critical point as against the parameter ?p, where α =0.1, k=0.1, and pa=0.4.
4. Simulation example
In this section, simulation is conducted to verify the linear stability analysis. We assume that all vehicles are running along a single lane under periodic boundary conditions, and the initial conditions of the proposed model are taken as follows:
In order to better compare with the Peng’s model,[47]the key parameters are borrowed from the literature.[47]More specifically,the average headwayy0=4,the number of vehiclesN=100,the initial disturbanceδ=0.5,and the driver’s sensitivitya=2.58. In order to obtain a less biased result,the effect of the vehicle positions should be eliminated. To this end,we randomly distributepNdrivers with low intensity parameter of driver’s characteristics in the platoon.
4.1. Impact of penetration rate
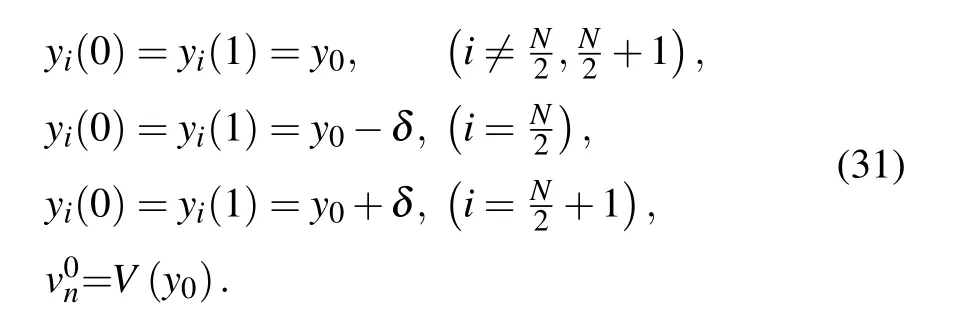
Figure 5 shows the spatiotemporal evolution of vehicle velocity under different values of penetration rate of drivers with low intensity,q. Whenq=0, there are only aggressive drivers and the traffic flow is relatively stable. As the parameterqincreases, two types of drivers coexist along the road and their interactions become more evident,such that the traffic flow is more fluctuated. When parametersqincreases to 1,all drivers become timid and the traffic fluctuation becomes worst. These results suggest that the provision of aggressive drivers contribute to the traffic flow stability,whereas the provision of timid drivers has a negative impact on the traffic flow stability. This is due to the fact that the aggressive drivers tend to preemptively adjust the speeds that prepare the system for delays. Figure 6 shows the instantaneous velocity distribution corresponding to Fig. 5, from which we found that as the parameterqincreases, the amplitude of vehicle velocity fluctuation gradually increases. This result matches the above conclusion from Fig.5.
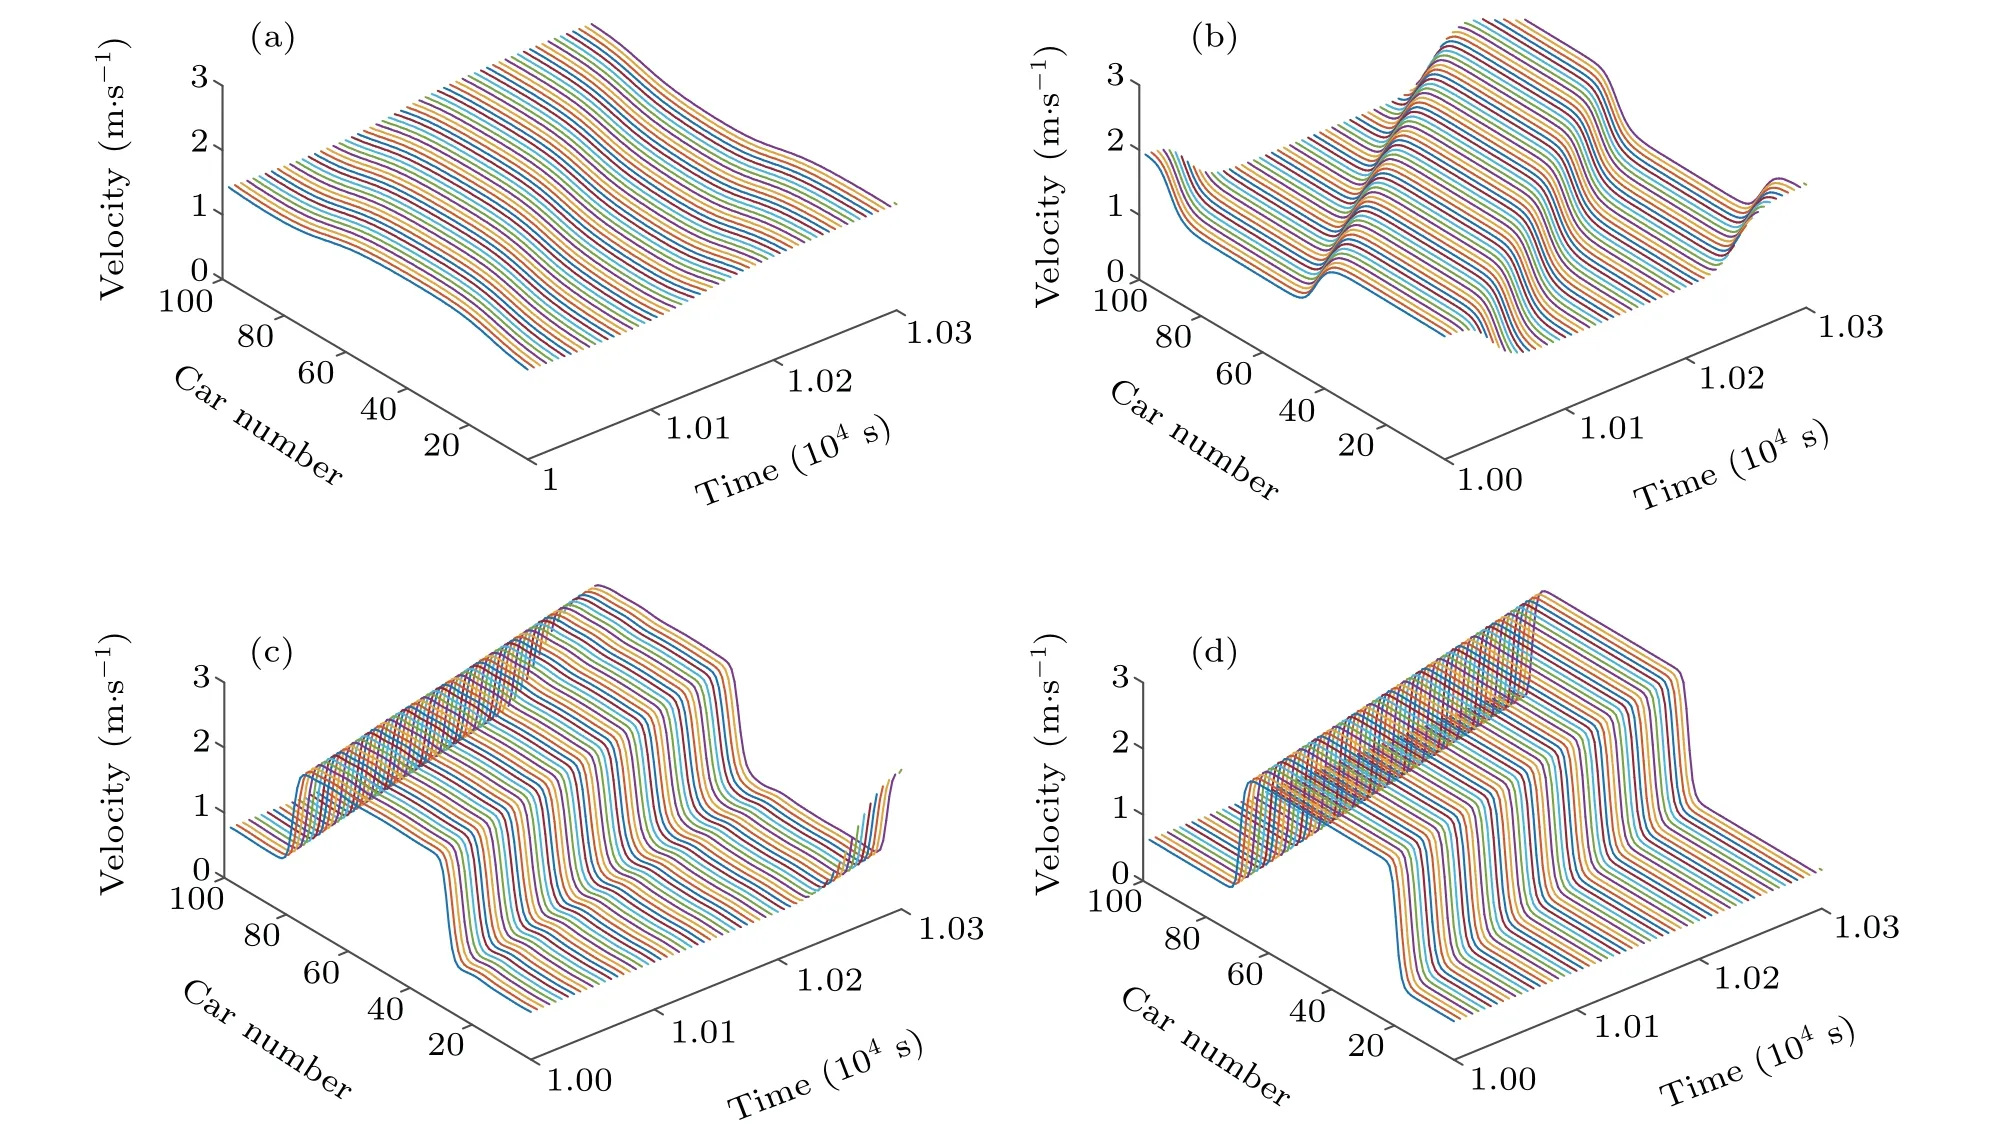
Fig. 5. Spatiotemporal evolution profiles of vehicle velocity under different values of the parameter q, (a) q=0; (b) q=0.3; (c) q=0.7; (d)q=1,where pl=0.3, ph=0.7,k=0.1,α =0.1.
Figure 7 shows the hysteresis loop curves under different values of the parameterq. The relationship between the parameterqand the traffic flow stability can be explored based on the area enclosed by the curve. Generally,a larger area indicates the more unstable traffic flow. As we can see, as the parameterqincreases,the area enclosed by the hysteresis loop curve expands,which indicates that the traffic flow stability is stronger. This result agrees with Figs. 5–7. Therefore, it is concluded that the penetration rateqcontributes negatively to the stability of the traffic flow.
4.2. Impact of average value pa and standard deviation ?p
In order to analyze the effect of driver heterogeneity characteristic on the traffic flow stability, in what follows we analyze the relationship between the average valuepaand the standard deviation ?pof two intensity parameters characterizing two types of drivers and the traffic flow stability. Figures 8–10 depict the effect of average valuepaon the traffic flow stability. As the parameterspaincreases, the interaction between vehicles is weakened, and the fluctuation amplitude of velocity is gradually reduced. Accordingly,the area enclosed by the hysteresis loop curve gradually decreases. Therefore, a higher parameterpacan improve the traffic flow stability,which is consistent with the conclusion in the literature.[47]
Figures 11–13 depict the effect of the standard deviation?pon the heterogeneity traffic flow stability. As we can see,given the average valuepa,the change of velocity fluctuating amplitudes and hysteresis loop curves are trivial as the standard deviation ?pincreases.Therefore,compared to the effect of average valuepa,the effect of the standard deviation ?pon the stability of traffic flow is trivial.
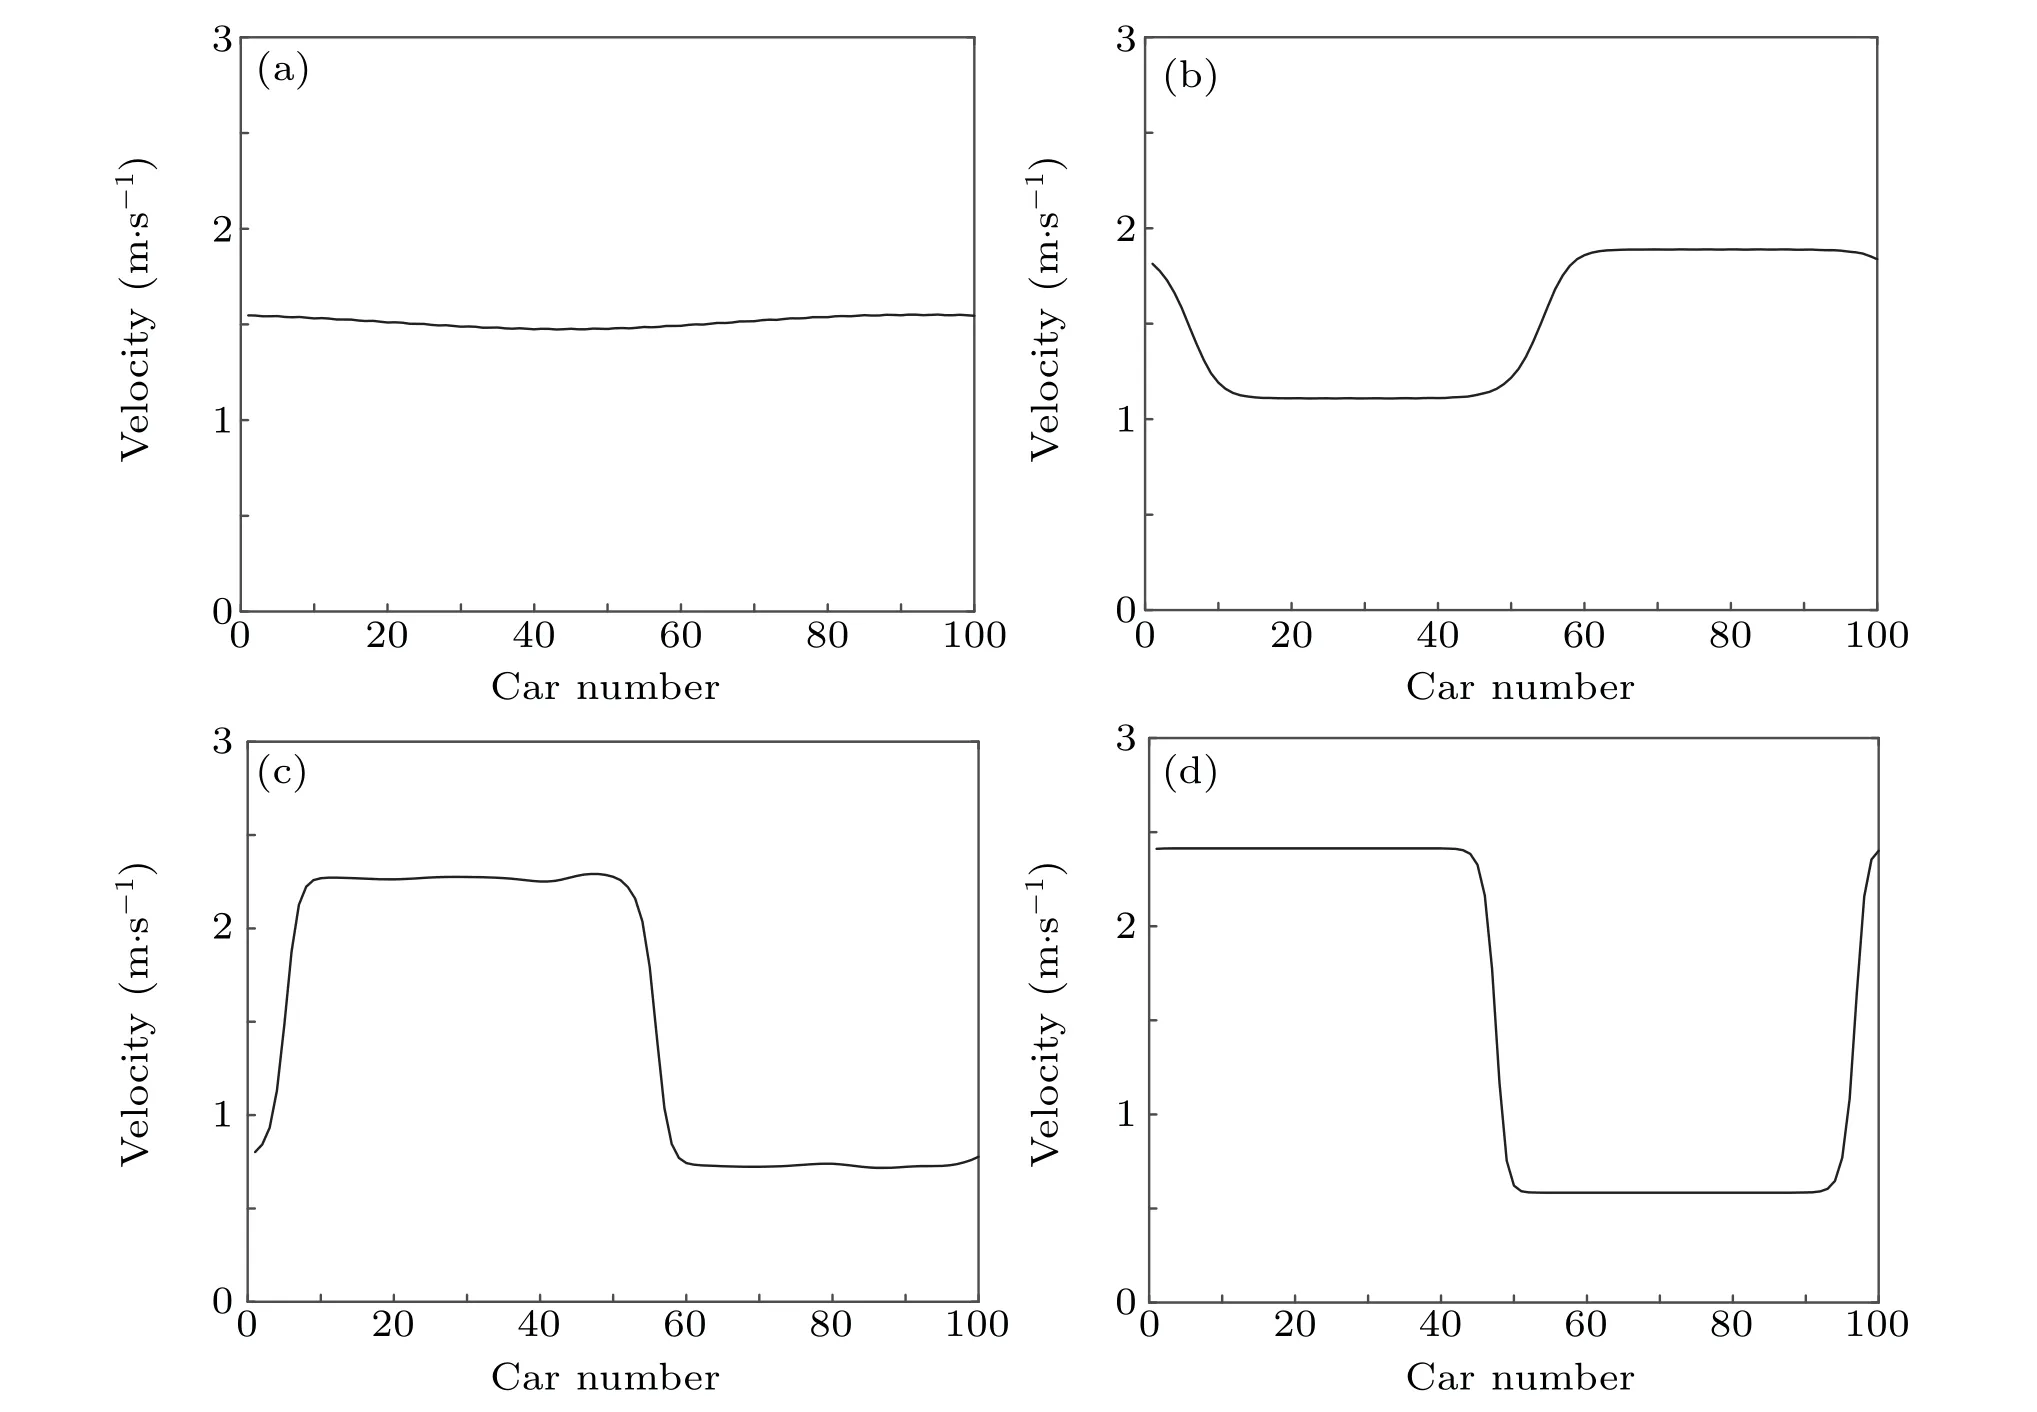
Fig.6. The instantaneous velocity distribution corresponding to Fig.5.
Fig.7. Hysteresis loop curves of mid-position vehicle corresponding to Fig.5.
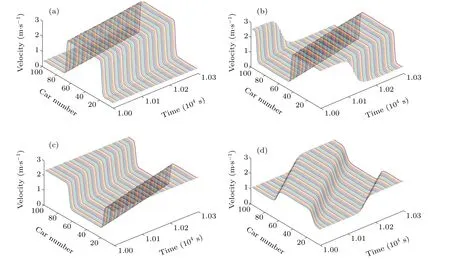
Fig.8. Time evolutions of velocity profiles under different values of the parameter pa,(a)pa=0.1;(b)pa=0.2;(c)pa=0.3;(d)pa=0.4,where ?p=0.1,k=0.3,α =0.2,and q=0.5.
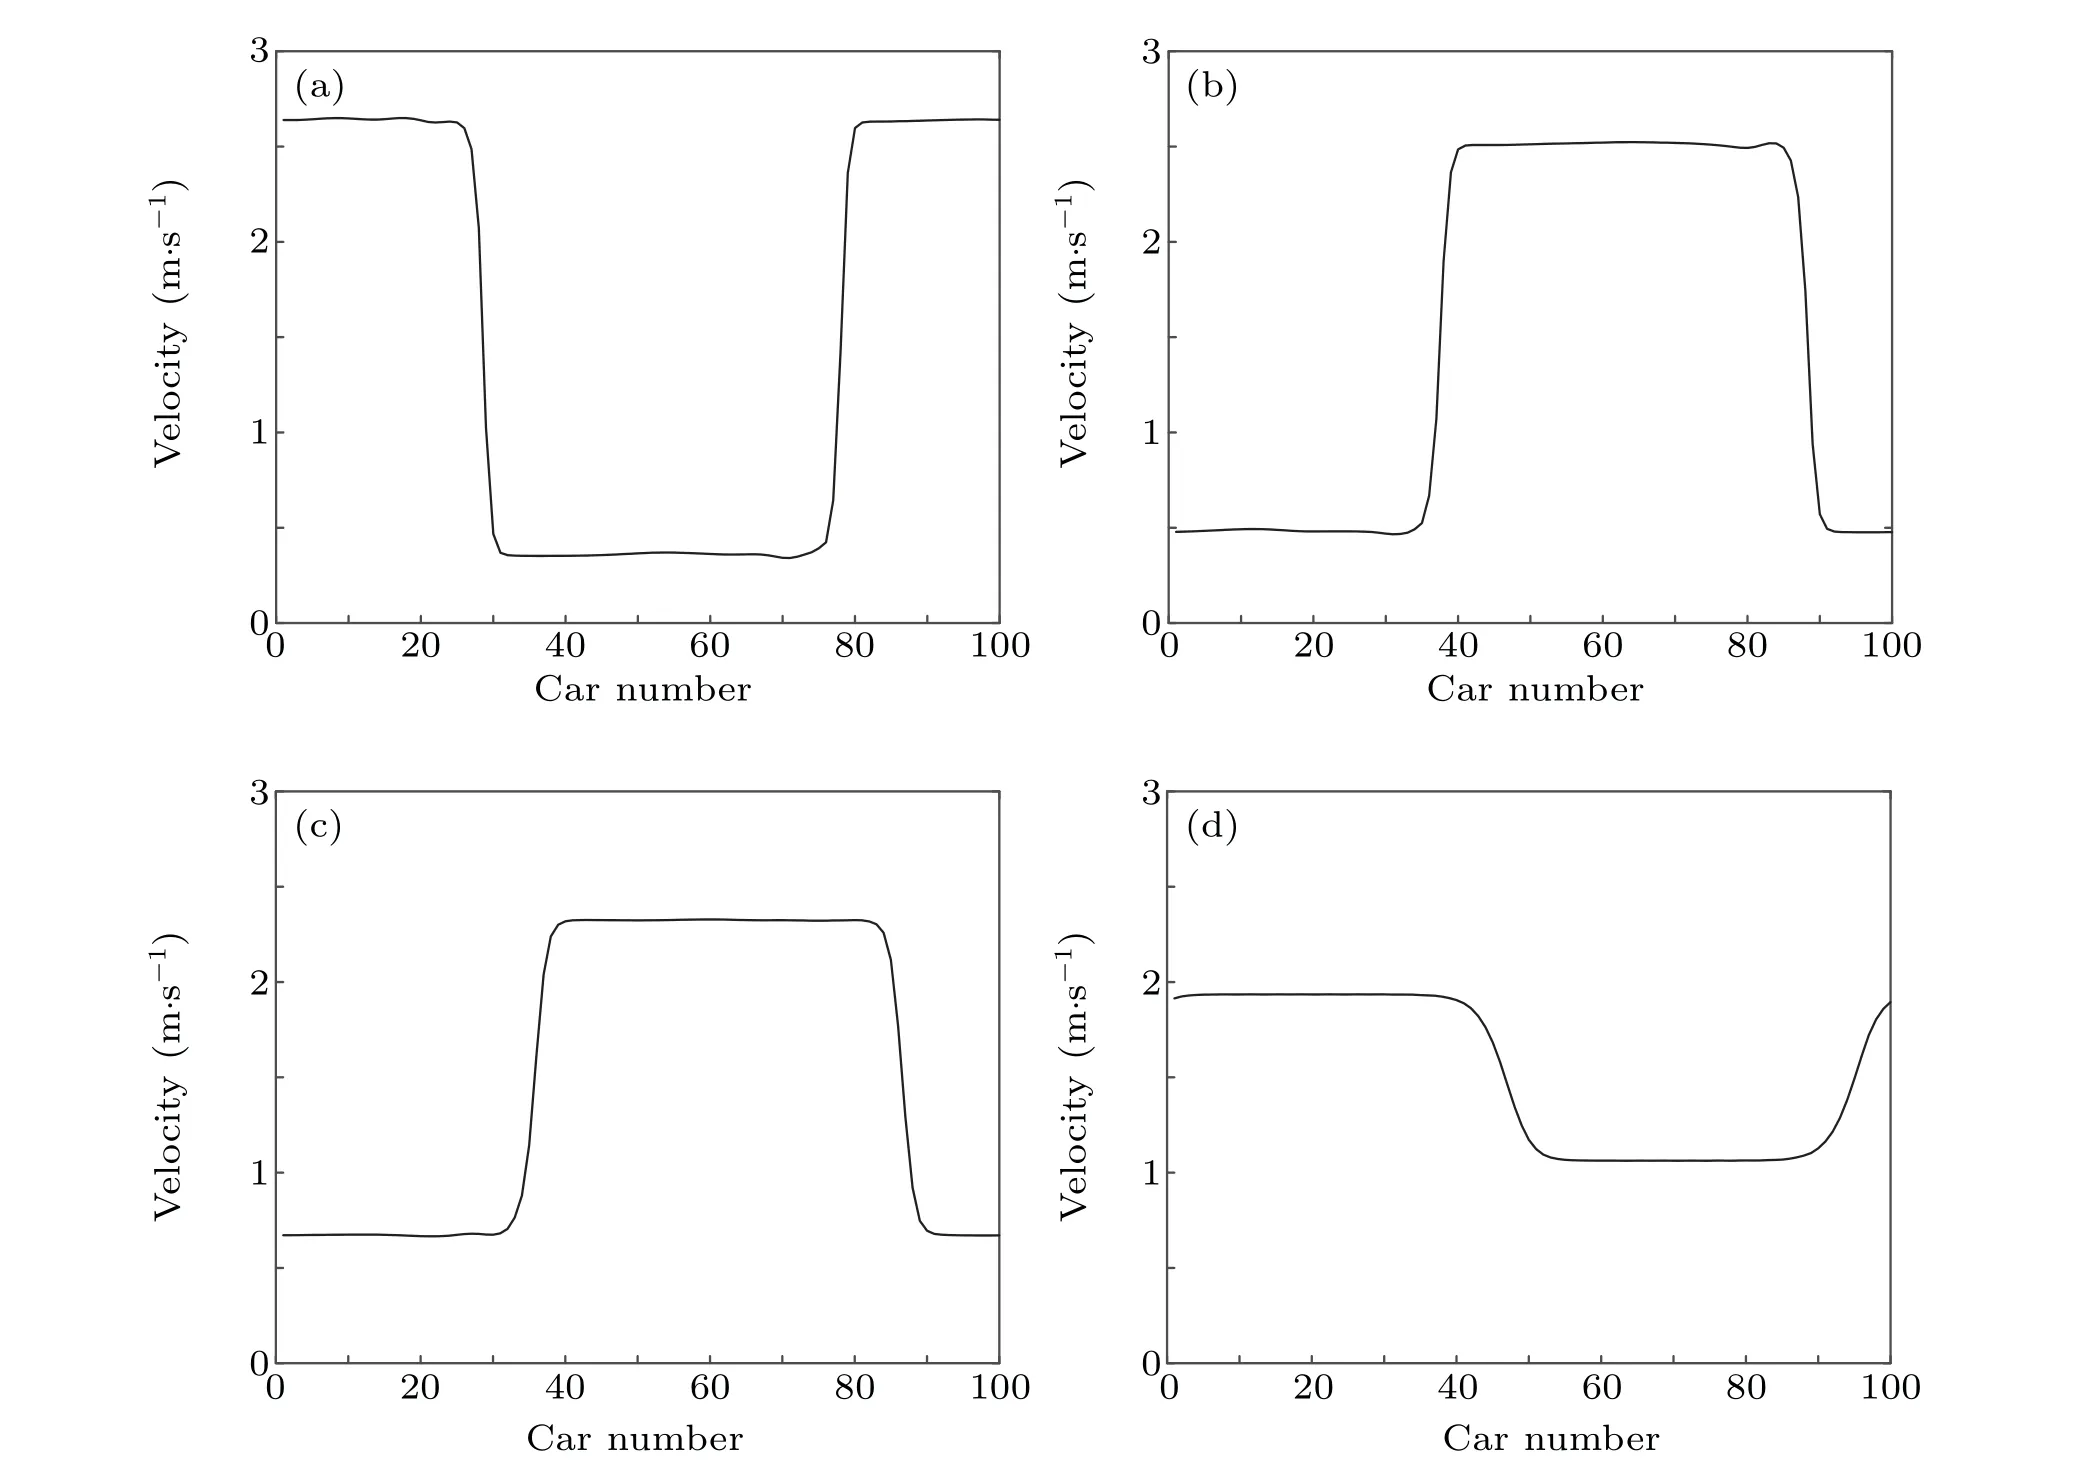
Fig.9. The instantaneous velocity distribution corresponding to Fig.8.
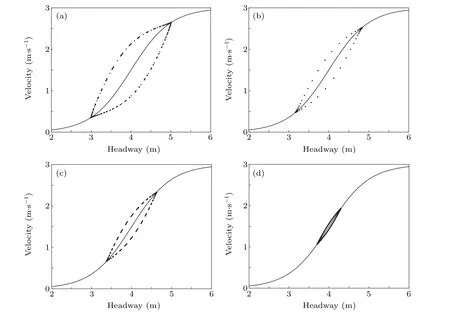
Fig.10. The hysteresis loop curves of mid-position vehicles corresponding to Fig.8.
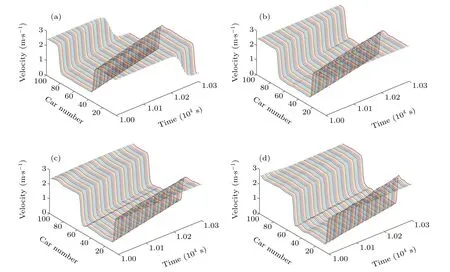
Fig. 11. Time evolutions of velocity profiles under different values of the parameter ?p, (a) ?p=0.1; (b) ?p=0.2; (c) ?p=0.3; (d) ?p=0.4, where pa=0.4,k=0.1,α =0.2,and q=0.5.

Fig.12. The instantaneous velocity distribution corresponding to Fig.11.
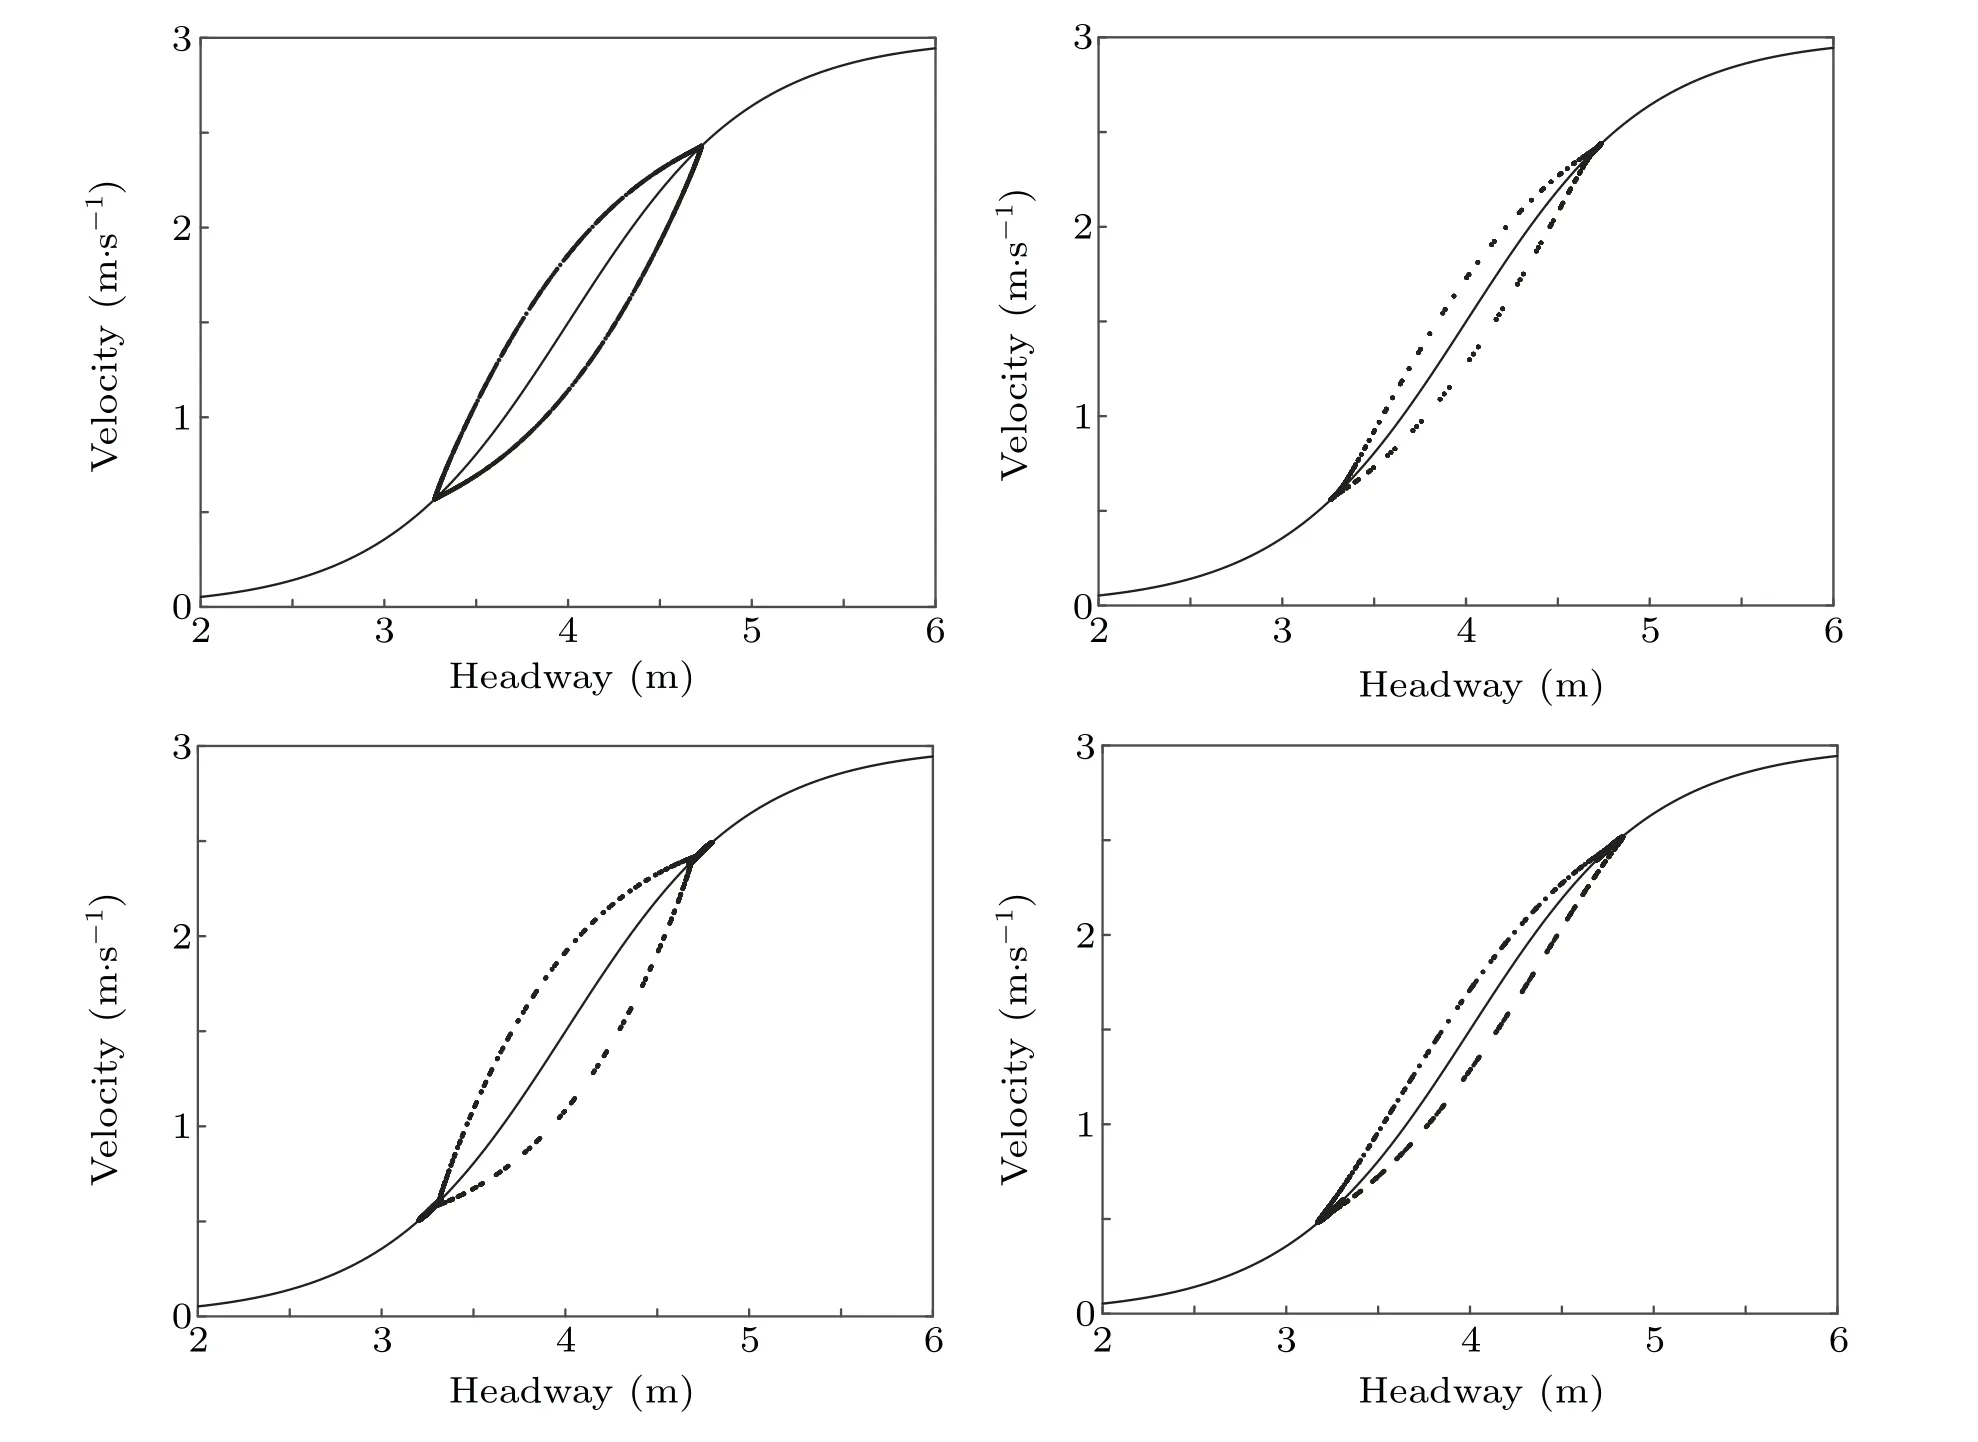
Fig.13. The hysteresis loop curves of mid-position vehicles corresponding to Fig.11.
5. Conclusion
In this paper,we proposed a new car-following model for heterogeneous traffic flow with timid and aggressive drivers.In the linear stability analysis, we obtained the stability conditions of the proposed heterogeneous traffic flow model. The neural stability diagram with five distinct regions was also derived. Simulation results showed that the traffic flow stability decreases as the penetration rate of timid drivers increases,which suggests that the provision of timid drivers contributes negatively to the stability of traffic flow. The effect of driver heterogeneous characteristics on the stability of traffic flow was explored through the average value and standard deviation of intensity parameters characterizing two types of drivers.Results showed that the average value has a great impact on the stability of traffic flow,whereas the impact of the standard deviation is trivial.
To the best of the authors’knowledge,this is the first paper on heterogeneous traffic flow model with timid and aggressive drivers. This research is expected to provide insights for the traffic simulation and platform development. Future studies can incorporate the effect of vehicle overtaking, merging and leaving of vehicles. In addition, it would be also interesting to incorporate a fine-grained road environment into the heterogeneous traffic flow.

- Chinese Physics B的其它文章
- Physical properties of relativistic electron beam during long-range propagation in space plasma environment?
- Optimized monogamy and polygamy inequalities for multipartite qubit entanglement?
- CO2 emission control in new CM car-following model with feedback control of the optimal estimation of velocity difference under V2X environment?
- Non-peripherally octaalkyl-substituted nickel phthalocyanines used as non-dopant hole transport materials in perovskite solar cells?
- Dual mechanisms of Bcl-2 regulation in IP3-receptor-mediated Ca2+release: A computational study?
- Diffusion of nucleotide excision repair protein XPA along DNA by coarse-grained molecular simulations?