溶劑熱一鍋法合成Ag-TiO2微球及其對過氧化氫的電化學檢測
2021-07-10 07:08:12褚有群黃章烤王鑫杭周夢蕾趙峰鳴
無機化學學報 2021年7期
褚有群 黃章烤 王鑫杭 周夢蕾 趙峰鳴
(浙江工業大學化學工程學院,綠色化學合成技術國家重點實驗室培訓基地,杭州 310032)
0 Introduction
Hydrogen peroxide has been used frequently as an eco-friendly chemical in industrial production, food preservation and environmental protection[1-3]. It is of great significance to develop the method for accurate detection of hydrogen peroxide because H2O2might be an intermediate for industrial processes and a byproduct of chemical or biological reaction[4-8]. Since traditional detecting techniques have shortcomings of high cost,time consuming and complex operation,electrochemical detection may be preferable due to its low consumption,fast response and simplicity[9-12].Although enzyme-based electrochemical sensors exhibit specific advantages, their application is limited by stability issues and high cost[13-15]. Therefore, non-enzyme electrochemical sensors have become one of the research hotspots for H2O2detection due to their high stability and no-dependency on temperature, ion concentration,pH and toxic chemicals[16-19]. In recent years, various noble metal composites have been widely used in nonenzymatic sensor with the development of material preparation technology. Recent researches show that silver is the best conductive metal with good chemical properties[20], catalytic properties[21]and biocompatibility[22]. Hence, it is widely used in the fields of electronics, chemical engineering, biomedicine, medicine, and daily necessities[23]. Many methods have been used to prepare silver nanoparticles, such as template method[24-25], wet chemical method[26-27], electrochemical method[28-29]and polyol method[30]. However, the catalytic properties are often affected due to their tendency to agglomerate during preparation. Particle′s agglomeration is a key problem not to be ignored for the preparation of nano silver.
In order to prepare highly dispersed nano silver,in this paper titanium dioxide (TiO2) was introduced as carrier due to its excellent optical properties[31], electrical properties[32]and certain catalytic activity[33]. The preparation method of titanium dioxide is simple and its morphology is highly controllable[34-36]. It has attracted the more attention for electrochemical sensing and is often used as catalyst carrier[37-38]. In this work, silver decorated TiO2microspheres (Ag-TiO2MS) were synthesized by one-pot solvothermal method. As shown in Fig.1, an alcoholysis of tetrabutyl titanate (TBOT) was controlled in alcohol solvent to obtain TiO2microsphere and a reducing reaction of enol in vitamin C(VC) was performed with surrounding nano silver uniform dispersion during the high temperature and pressure. As a result, the one-pot reaction can still retain the metallic properties of silver. Herein, Ag-TiO2composite was provided for detecting H2O2. Combining this composite with other catalytic materials can promote new ideas for electrochemical sensors.
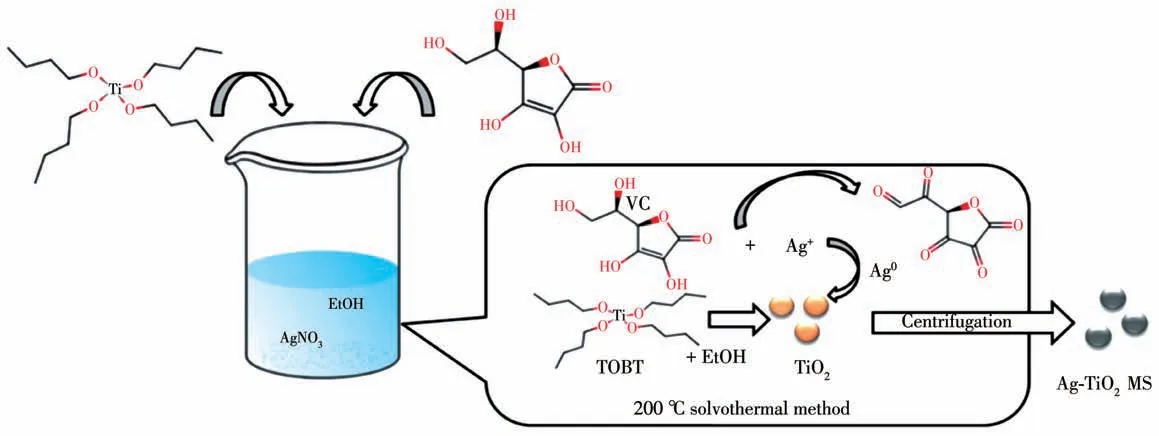
Fig.1 Schematic illustration of one-pot solvothermal synthesis of finely-dispersed Ag-TiO2 MS
1 Experimental
1.1 Materials and reagents
The reagents required in synthesis of Ag-TiO2MS were silver nitrate (AgNO3, 99.8%), VC (99.7%) and TBOT (99.0%) purchased from Aladdin, China. The reagents used for electrochemical measurements included hydrogen peroxide (H2O2, 30%), urea(99.0%), glucose (L-Glu, 98%) and lactose (Lac, 98%)that were purchased from Aladdin, China. Phosphate buffer solution(PBS,pH=7.0,0.02 mol·L-1)as supporting electrolyte was prepared with KH2PO4and KOH(Sinopharm,China).
1.2 One-pot synthesis of Ag-TiO2 MS
In a typical procedure, 30 mmol·L-1VC and 0.03 g AgNO3were dissolved in 70 mL absolute ethanol in a beaker with magnetic stirring, and then 8 mmol·L-1TBOT was added to form a transparent solution with brown color. Subsequently, the solution was transferred into 100 mL Teflon-line stainless steel autoclave(Microreactor, Yanzheng Instrument Ltd., Shanghai)and heated in an oven at 200 ℃for 7 h.After the autoclave was cooled down to room temperature in air, the solid product (Ag-TiO2MS) was separated by centrifugation, washed with deionized water and absolute alcohol several times,and dried in vacuum at 60 ℃for 6 h.TiO2microspheres (TiO2MS) can be synthesized by the same method just without adding AgNO3.
1.3 Preparation and characterization of Ag-TiO2 MS electrode
Prior to use, glassy carbon electrode (GCE,φ=3.0 mm,S=0.070 7 cm2) was polished with 300 and 50 nm aluminum oxide powders to a mirror-like, respectively,and then washed successively with acetone, ethanol and double-distilled water for several times.A homogeneous mixture was formed by adding 2.0 mg Ag-TiO2MS into 100 μL double-distilled water, 100 μL absolute ethanol and 10 μL Nafion (5%,w/w). The mixture was sonicated for 30 min. The preparation procedures of Ag-TiO2MS electrode as follows: 3.5 μL mixture was dropped on the surface of GCE and dried in ambient air for 20 min.
The morphology was examined by high resolution transmission electron microscopy (HR-TEM, 300 kV),high angle annular dark field scanning transmission electron microscopy (HAADF-STEM,300 kV),coupled with energy dispersive X-ray spectrometer (EDX),using CuKαradiation and spherical-aberration corrected field-emission transmission electron microscope(Philips-FEI, Tecnai G2 F30 S-Twin). The oxidation states of chemical species were detected by X-ray photoelectron spectroscopy (XPS, Kratos Axis Ultra DLD)using a focused monochromatized AlKαoperated at 300 W. The binding energies were referenced to the C1sline at 284.6 eV from adventitious carbon.
1.4 Electrochemical measurement of H2O2
Electrochemical measurements were performed on an Ivium potentiostat in N2-satruated 0.02 mol·L-1PBS (pH 7.0), with or without H2O2, using a three-electrode cell with the Ag-TiO2MS electrode as working electrode, a Pt foil counter electrode, and a Ag/AgCl reference electrode. The electrochemical impedance spectroscopy (EIS) was measured by applying amplitude of 5.0 mV over the frequency ranging from 105to 10-2Hz. For electrochemically sensing H2O2, the sensitivity, stability, reproducibility and anti-interfering activity studies were also performed in N2-saturated 0.02 mol·L-1PBS (3.0 mL, pH 7.0) using chronoamperometry at-0.3 V.
2 Results and discussion
2.1 Characterization of Ag-TiO2 MS
Fig.2 shows a typical SEM image of the TiO2MS and Ag-TiO2MS. As shown in Fig.2a, the average size of TiO2MS was hundred nanometers but not uniform.The inset of Fig.2a showed a rough TiO2MS with a diameter of about 250 nm.As shown in Fig.2b,the layers of material superimposed on the surface of Ag-TiO2MS and the surface roughness of the spheres was improved by Ag modification. The average diameter of each sphere was about 200~300 nm. In addition, it can be found that some spheres twined together, which may be related to the growth process of Ag-TiO2MS. By changing the reaction time, we found that the adhesion phenomenon was gradually obvious with the increase of solvent heat time during the growth of TiO2MS(Fig.S1).
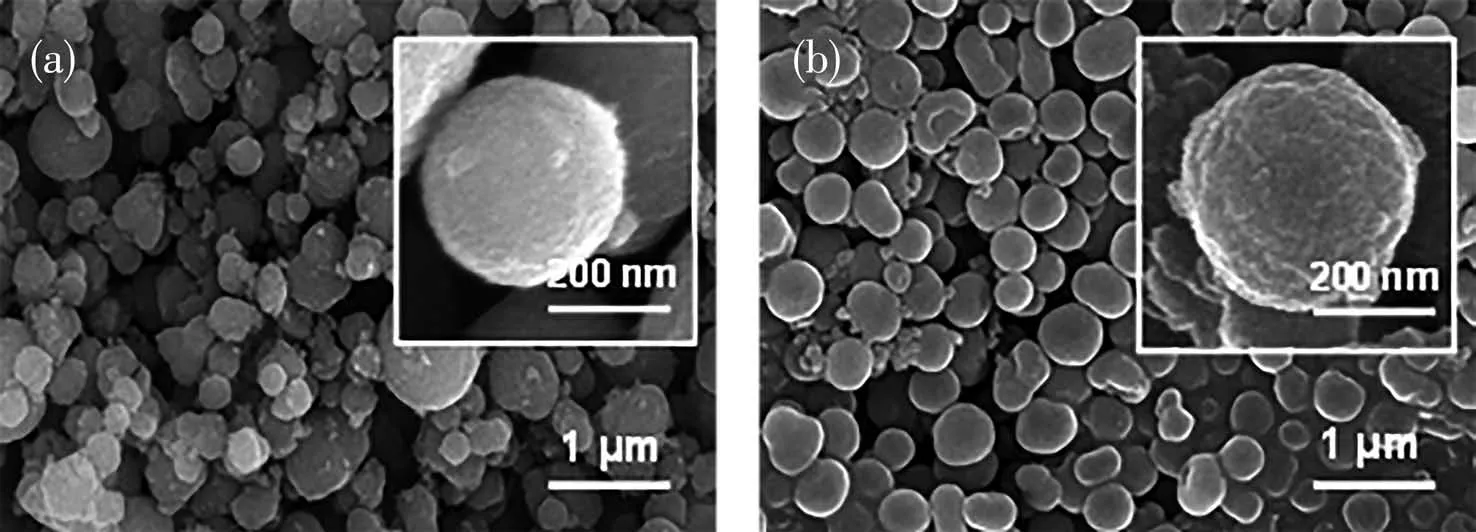
Fig.2 SEM images of TiO2 MS(a)and Ag-TiO2 MS(b)
XPS spectra was further used to confirm the surface chemical composition and oxidation state. Fig.3 shows the high resolution XPS spectra of Ti2p, O1s,Ag3dand AgMVVfor Ag-TiO2MS. Ti2pspectra can be divided into Ti2p1/2and Ti2p3/2peaks, and the peaks at 463.7 and 457.9 eV can be assigned to Ti—O bonds.The O1sXPS spectrum for Ag-TiO2MS at 530.2 eV is ascribed to Ti—O bonds. The Ag3dXPS spectrum of Ag-TiO2MS shows peaks at 368.0 and 374.0 eV, corresponding to the Ag3d5/2and Ag3d3/2, respectively. The Auger parameter (α′), which is defined as the sum of the kinetic energy of the Auger electron(αAgM4VV) and the binding energy of the core level Ag3d5/2(αAg3d5/2),can be calculated by the equation ofα′=αAgM4VV+αAg3d5/2[39]. The characteristic peak appeared in the AgM4VVXPS spectrum at 358.0 eV and theα′was calculated to be 726.0 eV, which is ascribed to Ag0in Ag-TiO2MS.
XRD patterns of TiO2MS and Ag-TiO2MS are shown in Fig.4. It can be seen that TiO2MS might be amorphous and this can be confirmed by the selected area electron diffraction (SAED, Fig.S2). Four diffraction peaks with 2θvalues of 38.1°, 44.3°, 64.4° and 77.4° can be assigned to (111), (200), (220) and (311)planes of face-centered cubic(fcc)Ag.
Fig.5a and 5d show the TEM images of TiO2MS and Ag-TiO2MS, which reveal the detailed structure of the spherical morphology. Both in TiO2MS and Ag-TiO2MS, there was no obvious lattice stripe of TiO2, which indicates that it mainly exists in amorphous form. However, Ag0were grown on the surface of Ag-TiO2MS. These Ag nanoparticles (Ag NPs) had highly crystalline and the lattice spacing was determined to be 0.236 nm, which is attributed to (111)plane of Ag(Fig.5f).
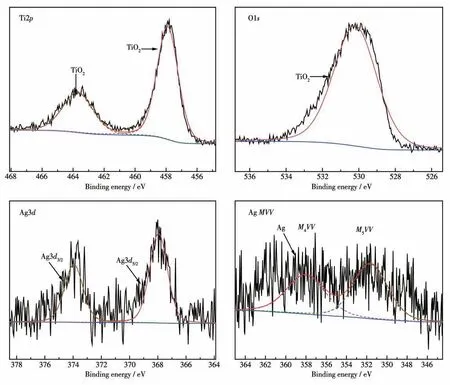
Fig.3 XPS spectra of Ag-TiO2 MS
Furthermore, the composition of TiO2MS and Ag-TiO2MS was confirmed by EDX. Fig.6 illustrated that the TiO2MS included Ti, O elements and the Ag-TiO2MS included Ti, O, and Ag elements, suggesting that TiO2MS and Ag-TiO2MS were successful by one-pot synthesis method. In addition, Fig.7 is the HAADFSTEM images and the corresponding EDX mappings of TiO2MS and Ag-TiO2MS.Obviously,it proved that the distribution of Ti, O and Ag elements was relatively homogenous, and Ag0was highly dispersed on the surface of TiO2MS.
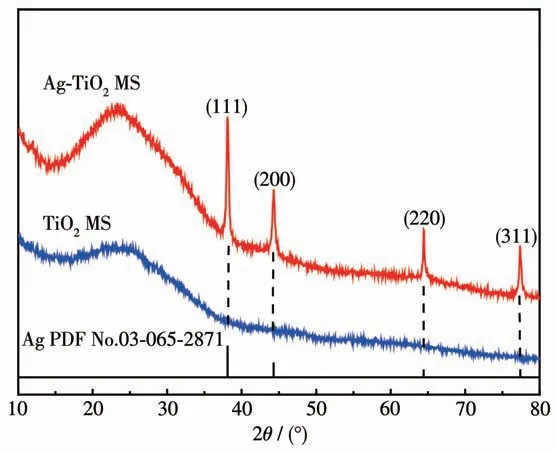
Fig.4 XRD patterns of TiO2 MS and Ag-TiO2 MS
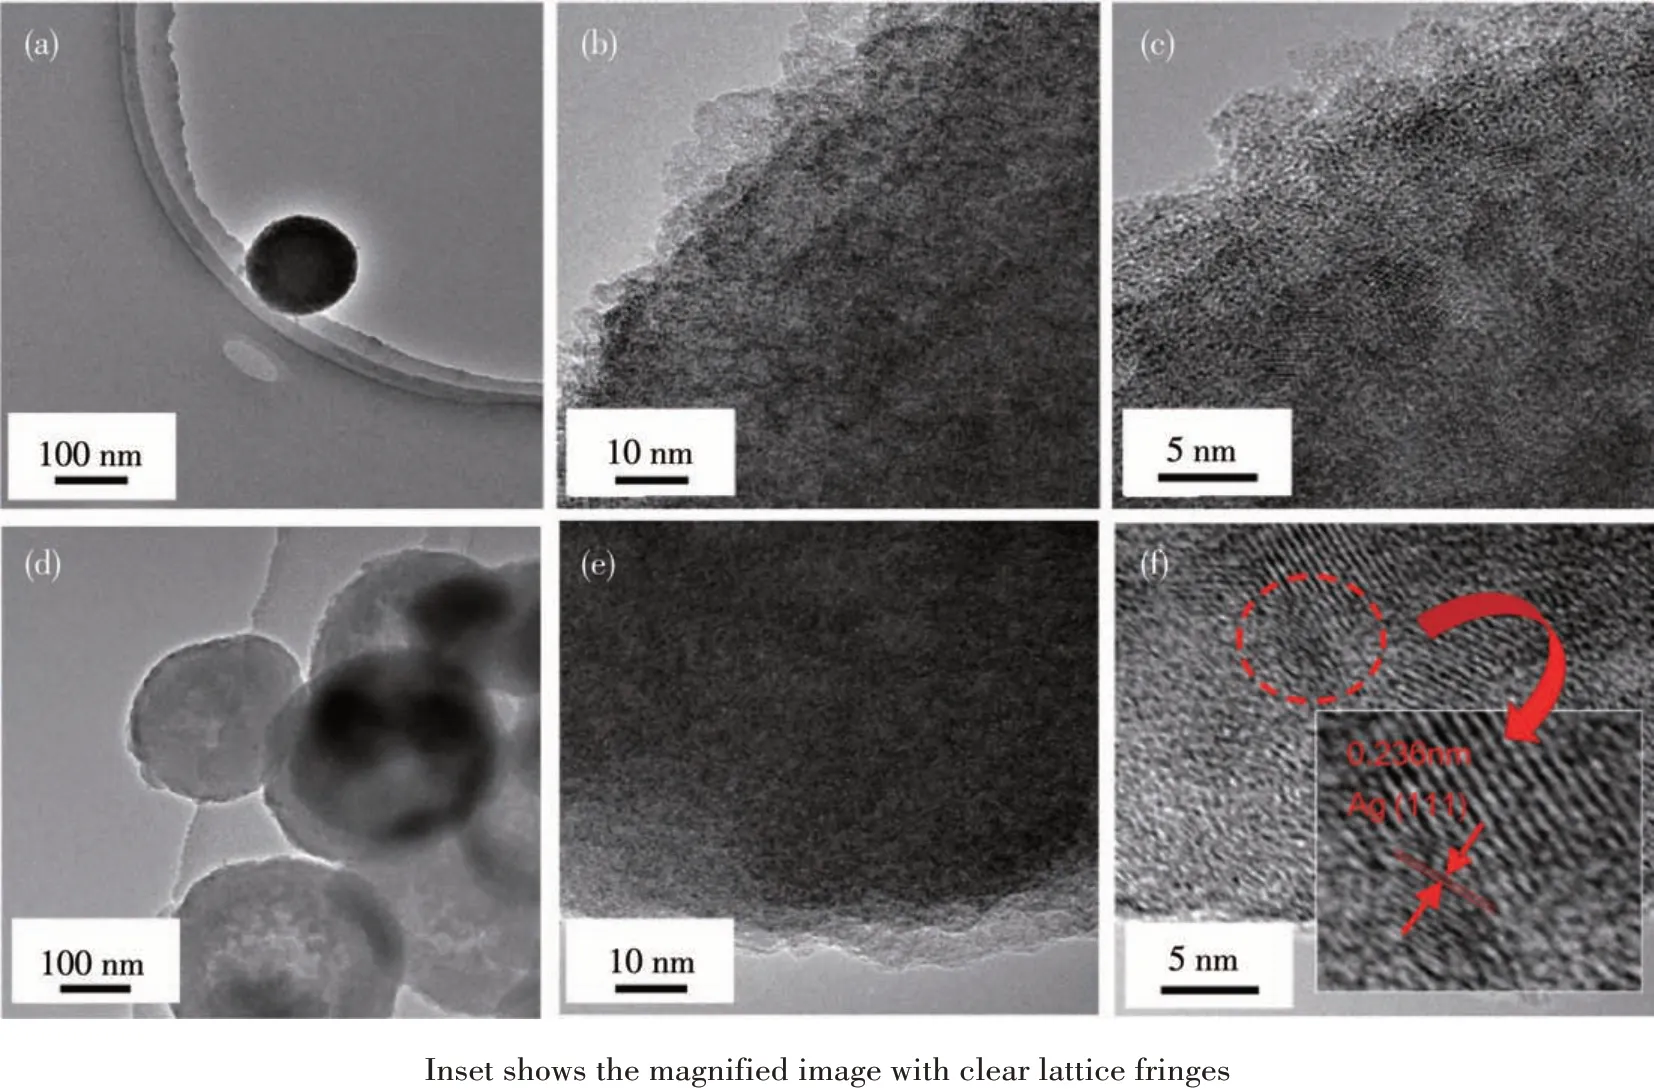
Fig.5 TEM images of TiO2 MS(a~c)and Ag-TiO2 MS(d~f)
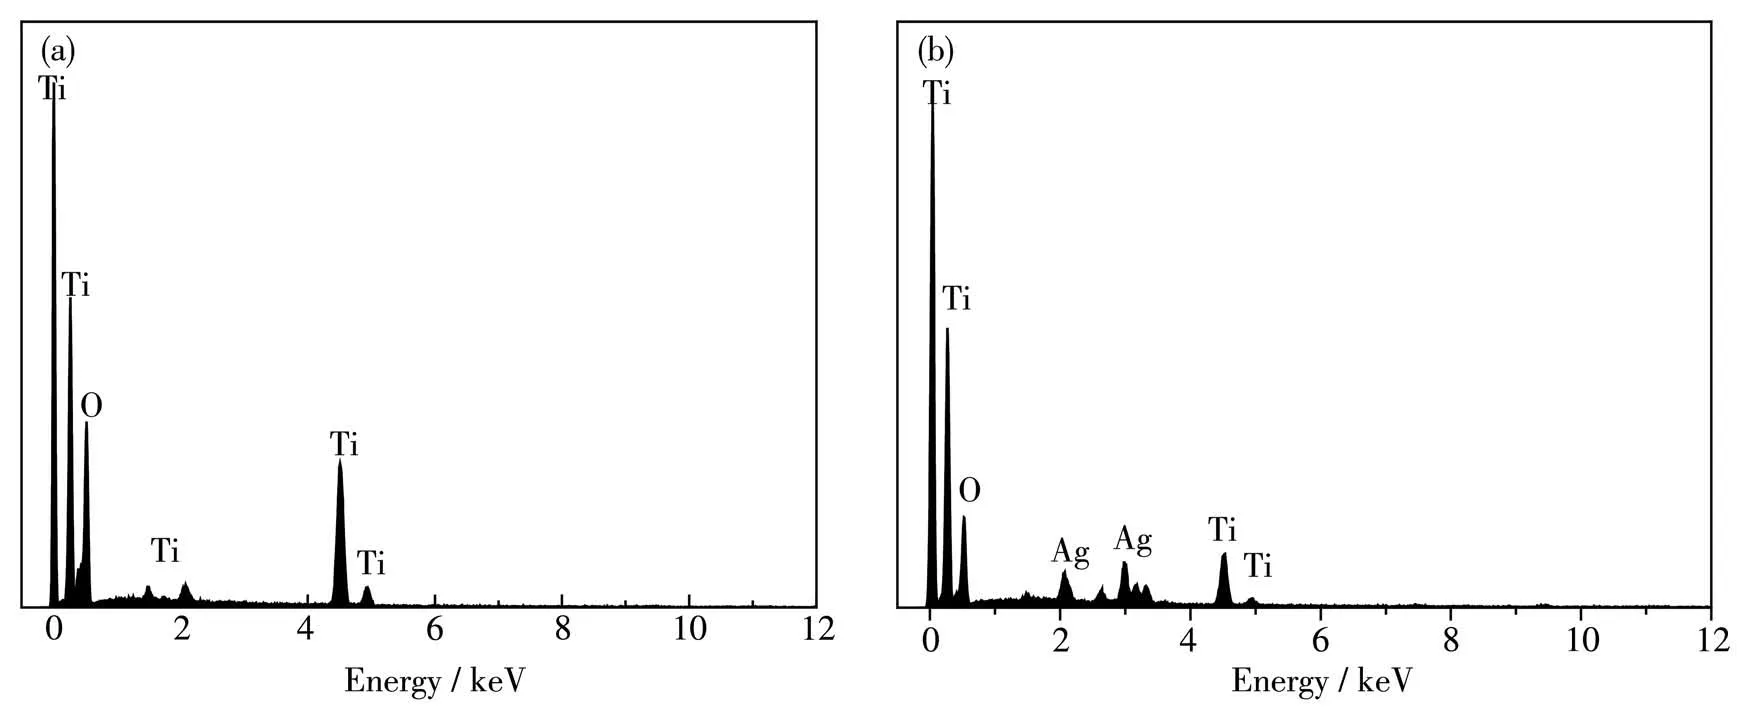
Fig.6 EDX spectra of(a)TiO2 MS and(b)Ag-TiO2 MS
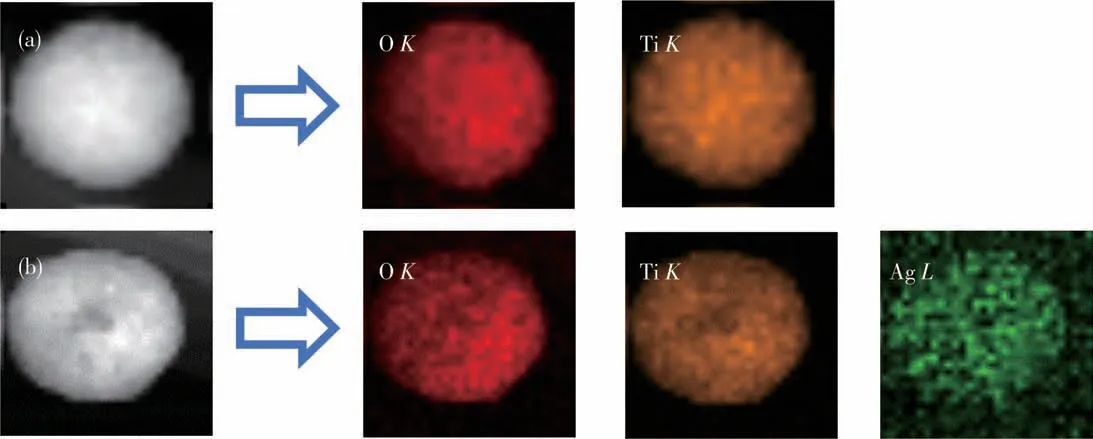
Fig.7 HAADF-STEM images and the corresponding EDX mappings of (a)TiO2 MS and(b)Ag-TiO2 MS
2.2 Electrochemical performance of Ag-TiO2 MS for H2O2
Cyclic voltammetry (CV) was employed to characterize the electrochemical behavior of the electrode.Fig.8 shows the CV curves of TiO2MS and Ag-TiO2MS electrodes in 0.02 mol·L-1PBS (pH 7.0)with and without 1 000 μmol·L-1H2O2at scan rates of 20 mV·s-1.Compared with TiO2MS,Ag-TiO2MS electrode showed a reduction peak at around -0.4 V, suggesting the strong reduction ability of Ag-TiO2MS for H2O2.
The electrochemical performance of Ag-TiO2MS electrode towards H2O2reduction was further examined via changing the H2O2concentrations (Fig.9) and scan rates (Fig.10). As seen in Fig.9b, the increase of H2O2concentration led to a regular increase in the reduction peak current in Ag-TiO2MS electrodes.Compared with Fig.9a, it was no obvious response to hydrogen peroxide for TiO2MS electrode, indicating that the Ag-TiO2MS electrodes have good electrocatalytic activity and an application prospect as a sensor after loading with Ag.
The kinetic parameters were further calculated by the relation graph of H2O2concentration and scan rates(Fig.10). In the irreversible process, the diffusion coefficient(D0)and reaction rate constant(k0)were calculated using the Eq.1 and Eq.2[40].
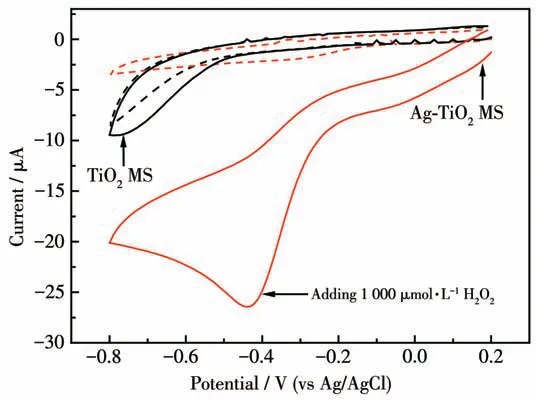
Fig.8 CVs of TiO2 MS(black curves)and Ag-TiO2 MS(red curves)electrodes in 0.02 mol·L-1 PBS(pH 7.0)with(solid curves)or without(dotted curves)1 000 μmol·L-1 H2O2 at 20 mV·s-1
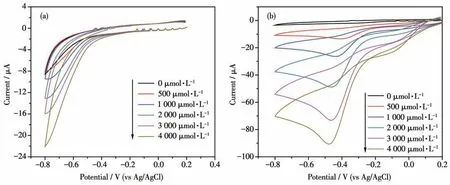
Fig.9 CVs of TiO2/MS(a)and Ag-TiO2/MS(b)electrodes at 20 mV·s-1 with adding different concentrations of H2O2
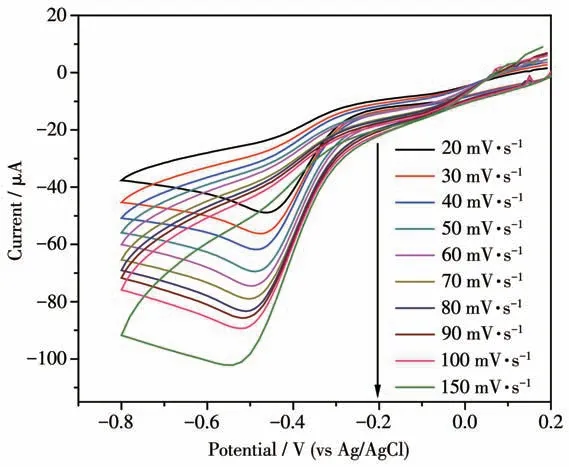
Fig.10 CVs of Ag-TiO2 MS electrode in the presence of 2 000 μmol·L-1 H2O2 at different the scan rates
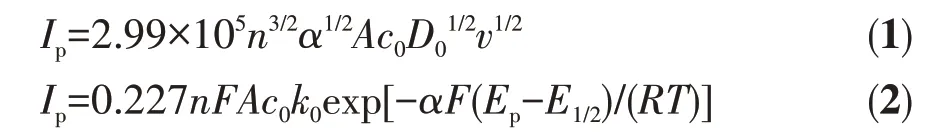
WhereIpis the peak current (A),nis the number of electrons,Fis Faraday constant,Ais the area of the electrode (cm2),c0is the concentration of H2O2(mol·L-1),Epis the peak potential (V),E1/2is the half-wave peak potential (V),αis the charge transfer coefficient,vis the scan rate (V·s-1). The concentration of H2O2was 2 000 μmol·L-1and the electroactive surface area for Ag-TiO2MS was 0.070 7 cm2.Eq.3 is built by evaluating the logarithm of Eq.2.

The linear relationship ofIpandv1/2for Ag-TiO2MS electrode wasIp=120.07v1/2+4.992 (R2=0.996)(Fig.11a).The calculatedD0value on Ag-TiO2MS electrode was 1.96×10⁻⁵cm·s-1.
The relationship of lnIpand (Ep-E1/2) for Ag-TiO2MS was lnIp=-15.897(Ep-E1/2)-12.117(R2=0.996).The calculatedk0value on Ag-TiO2MS electrode was 1.45×10⁻³cm·s-1.
In order to illustrate the effect of the loaded silver,EIS of TiO2MS and Ag-TiO2MS electrodes were carried out. The obtained Nyquist plots are shown in Fig.12 and the constant phase angle element (CPE)replaces the electrode double layer capacitance in the equivalent circuit diagram. Two typical semicircles can be observed at high frequency range and the low frequency region, respectively. Based on the equivalent circuit, charge-transfer resistance (Rct) can be determined from the diameter of the left most semicircle,and the polarization resistance (Rp) can be determined from the diameter of the second semicircle.The parameters obtained from the fitting curves of EIS are shown in Table 1. The ohmic serial resistance (Rs) can be obtained by the intercept on the real axis at high frequency.TheRctof TiO2MS and Ag-TiO2MS electrodes were 726 and 613 Ω, and theRpwere 291.5 and 28.34 kΩ,respectively. Obviously, theRctandRpof Ag-TiO2MS were lower than that of TiO2MS, which conformed that Ag-TiO2MS has better electronic conductivity and electrochemical reaction rate.
In conclusion, hydrogen peroxide can be adsorbed by nano silver in neutral medium[41], the cathodic reaction process may be shown as fllows:
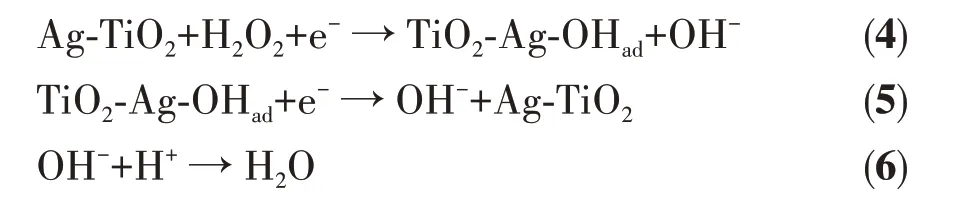
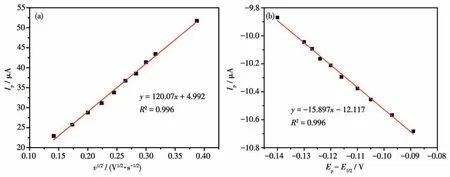
Fig.11 (a)Relationship of Ip and v1/2 and(b)relationship of ln Ip and(Ep-E1/2)for Ag-TiO2 MS electrode
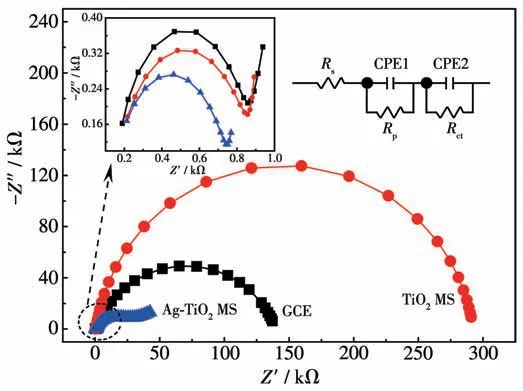
Fig.12 Nyquist plots of Ag-TiO2 MS,TiO2 MS and GCE electrodes
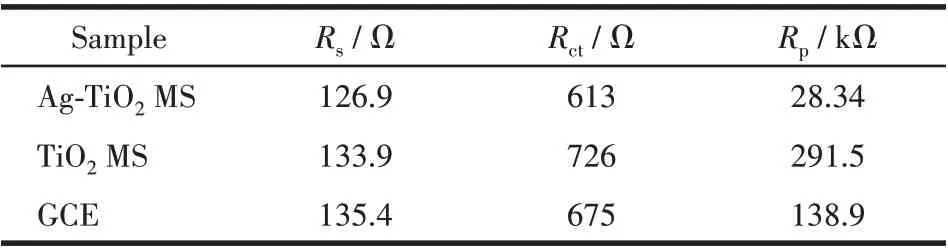
Table 1 Parameters obtained from the fitting curves of EIS in Fig.12
Successful loading of nano silver will make the reaction step 4 and 5 easier to perform, which provide higher electrochemical reaction rates for catalytic reactions and effectively improve the electrical conductivity of the material.
2.3 Detection performance of Ag-TiO2 MS towards H2O2
Amperometric response (I-t, the relation between current and time) curves were performed with the successive addition H2O2into a stirring electrochemical cell containing 3 mL PBS (0.02 mol·L-1, pH 7.0) at an optimized potential of-0.3 V (Fig.13).For Ag-TiO2MS electrode, each response current step showed a downward trend between 0.1 to 102 μmol·L-1and an upward trend between 478 to 699 μmol·L-1. It is clear that the response current can remain stable only in the intermediate concentration range.

Fig.13 I-t curve of Ag-TiO2 MS in 0.02 mol·L-1 PBS(pH 7.0)with the successive adding H2O2
Fig. 14 presents the linear fitting relationships between the current response and H2O2concentration.The current responses as functions of H2O2concentration can be represented by three different linear equations, which are valid at different concentration ranges.The linear regression equations of Ag-TiO2MS wereI=2.21×10⁻⁴cH2O2+0.278 (R2=0.979) forcH2O2=0.1~102 μmol·L-1,I=5.41×10⁻⁴cH2O2+0.240 (R2=0.997) forcH2O2=102~478 μmol·L-1andI=1.234×10⁻³cH2O2-0.109 (R2=0.985) forcH2O2=478~699 μmol·L-1. The limit of detection(LOD)was determined by using the equation LOD=3SB/b, wherebis the slope of the calibration curve andSBis the standard deviation of the blank solution. The LOD (S/N=3) of Ag-TiO2MS sensor was calculated to be 0.04 μmol·L-1. Meanwhile the obtained sensitivity of Ag-TiO2MS was 3.13×10⁻³μA·L·μmol-1·cm-2.
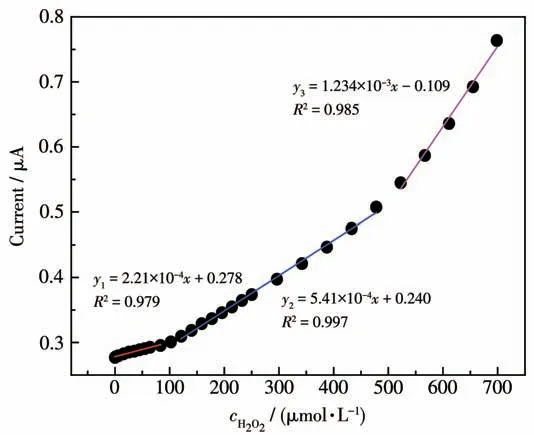
Fig.14 I-cH2 O2 linear fitting results for Ag-TiO2 MS
Compared with several previous reports, as shown in Table 2, the as-prepared sensors exhibited the lowest detection limit with good linear range and the fastcurrent response towards H2O2,whichit can be attributed to the special properties of Ag-TiO2MS.In the composite, the metallic oxide plays a significant as substrate material. Therefore, the good electron transfer efficiency of the Ag-TiO2MS may lead to the short response time.
2.4 Selectivity, reproducibility, repeatability and storage stability of Ag-TiO2 MS electrodes
Fig.15a is the long-term stability chart of Ag-TiO2
MS electrode. The electrodes were stored at room temperature and exposed to air before use. After one month, the current response of the sensor to H2O2decreased by 17.9%. By analysis of SEM, XRD, TEM and XPS (Fig.S3, S4, S5, S6), it can be seen that the catalytic performance of the Ag-TiO2MS electrode was decreased due to the weakening of crystalline surface strength and the destruction of the morphological structure. Fig.15b is theI-tcurve of Ag-TiO2MS in 0.02 mol·L-1PBS (pH 7.0) for selective studies. 500 μmol·L-1H2O2,L-Glu, VC, urea and Lac were added successively. The results showed that the addition of H2O2caused a significant current response,and further addition of interfering substances did not have an obvious reaction,indicating that Ag-TiO2MS has good selectivity and sensitivity for H2O2.
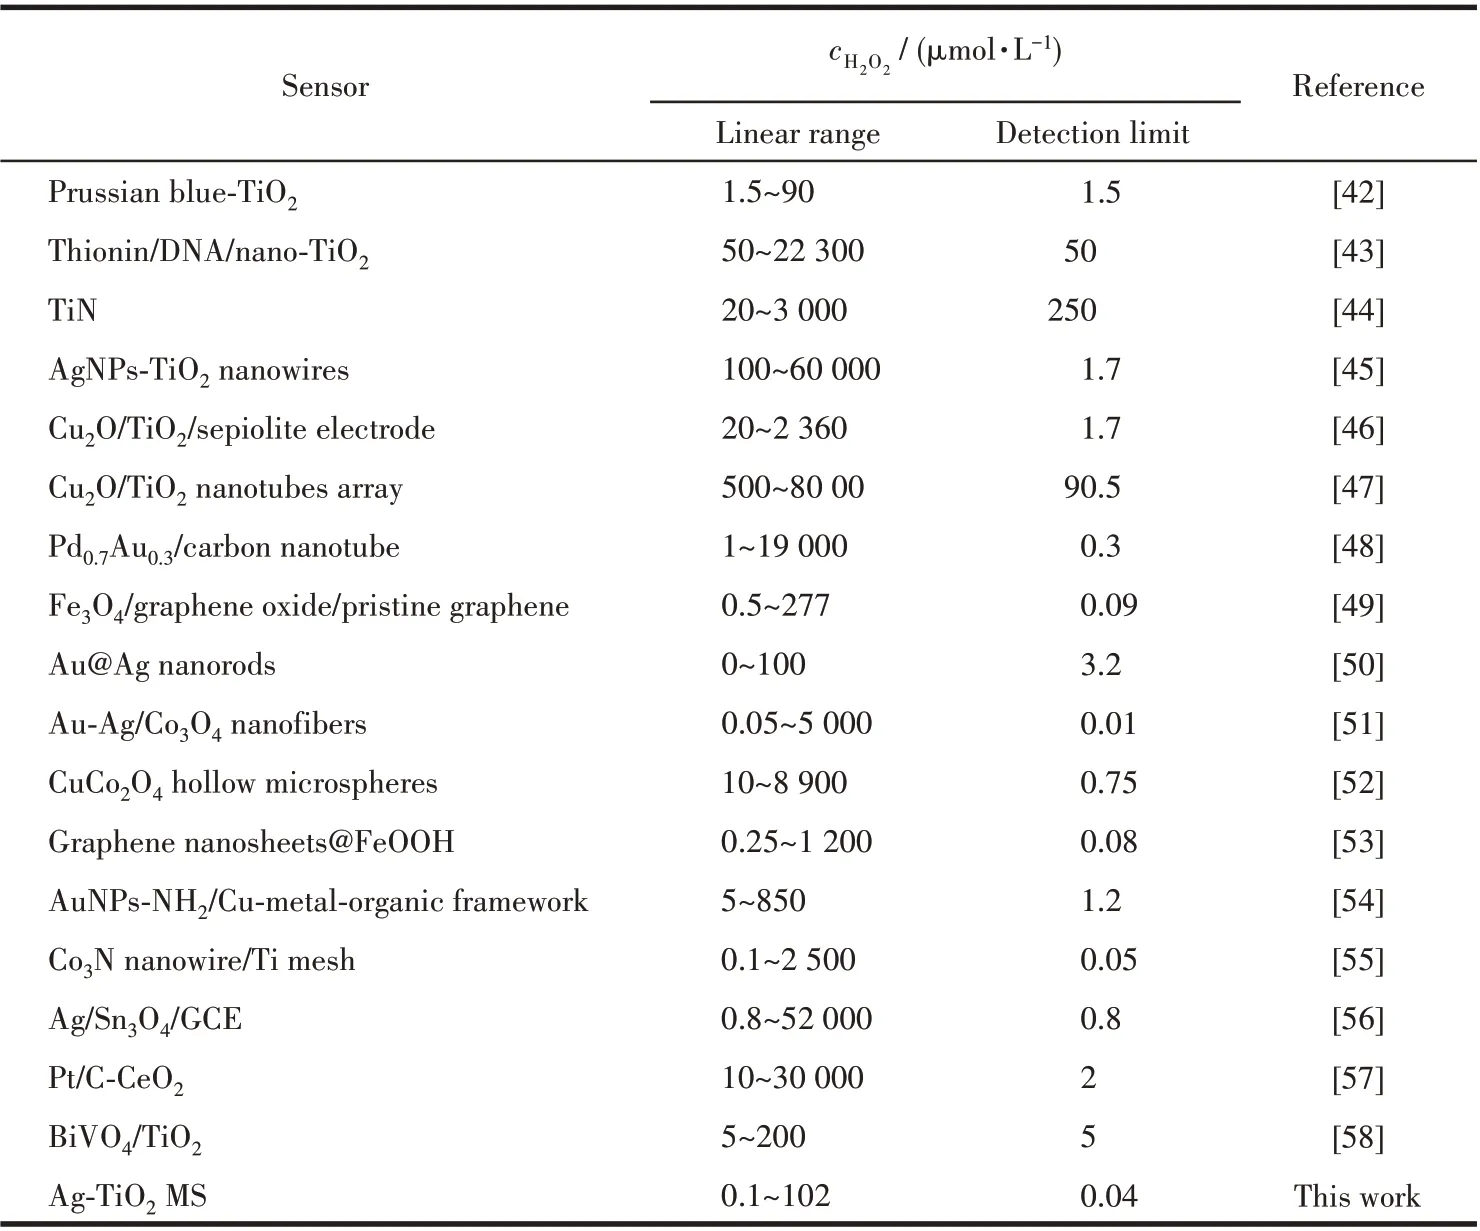
Table 2 Comparison of H2O2 sensors reported previously with Ag-TiO2 MS sensor
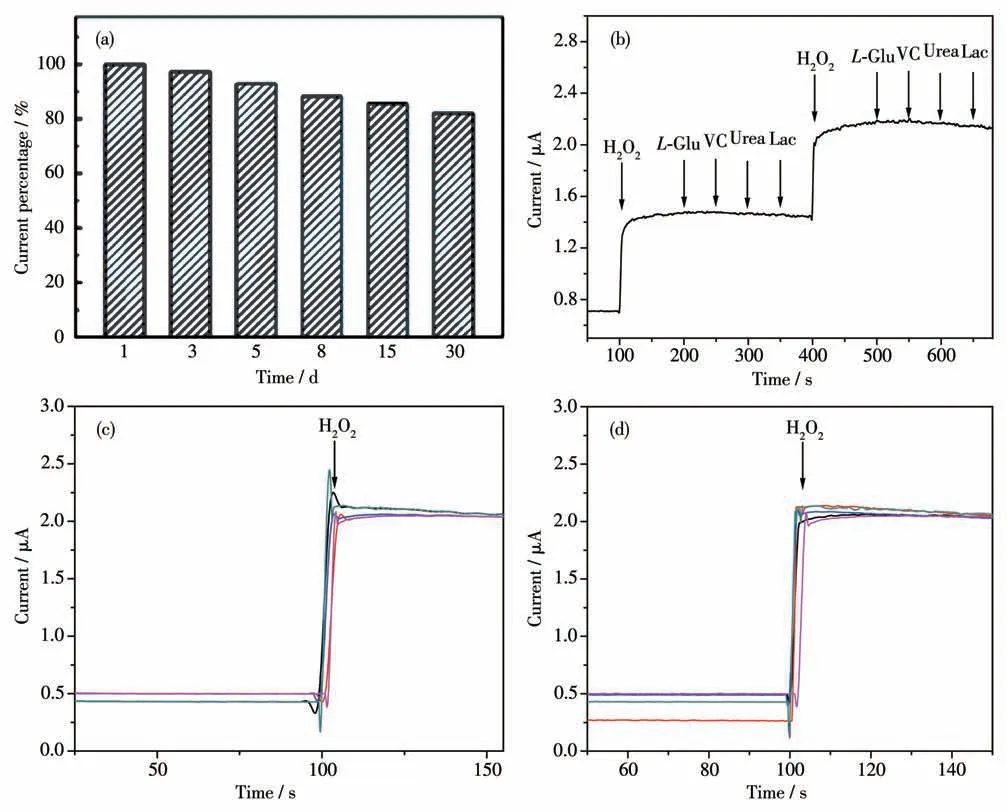
Fig.15 (a)Normalized response of Ag-TiO2 MS toward 100 μmol·L-1 H2O2 in PBS(pH 7.0)at-0.3 V in 30 days;(b)I-t curve of Ag-TiO2 MS in 0.02 mol·L-1 PBS(pH 7.0)for selective studies with adding 500 μmol·L-1 H2O2,L-Glu,VC,urea and Lac;(c)Reproducibility studies with adding 500 μmol·L-1 H2O2;(d)Repeatability studies with adding 500 μmol·L-1 H2O2
Ag-TiO2MS electrodes were prepared in parallel to evaluate the electrocatalytic activity sensor reproducibility for H2O2. After calculation, 5 electrodes were subsequently prepared under the same conditions, and the relative standard deviation of current response was only 2.0% (Fig.15c). The same electrode was repeatedly measured for 5 times,and the relative standard deviation of response was 3.7%(Fig.15d).
3 Conclusions
In summary, Ag-TiO2MS were successfully synthesized by one-pot method. Serving as a H2O2detection electrode,Ag-TiO2MS presents excellent nonenzymatic H2O2sensing performance in terms of wide linear range and reliable stability. It is believed that the Ag-TiO2MS presents broad applications in the development of nonenzymatic H2O2electrochemical sensors and the immobilization of finely dispersed silver on TiO2microsphere paves an effective way to construct H2O2detection electrode.The Ag-TiO2MS material can be further modified in subsequent research, such as high-temperature renitriding into titanium nitride to enhance its stability for better application in electrochemical sensors.
Supporting information is available at http://www.wjhxxb.cn
Acknowledgements:This work was supported by the Natural Science Foundation of Zhejiang Province, China (Grant No.LY17B050006)and the National Key Research and Development Plan(Grant No.2017YFB0307503).
