Utilizing of high-pressure high-temperature synthesis to enhance the thermoelectric properties of Zn0.98Al0.02O with excellent electrical properties*
2021-01-21 02:08:06QiChen陳啟XinjianLi李欣健YaoWang王遙LijieChang常立杰JianWang王健YuewenZhang張躍文HonganMa馬紅安andXiaopengJia賈曉鵬
Chinese Physics B 2021年1期
Qi Chen(陳啟), Xinjian Li(李欣健), Yao Wang(王遙), Lijie Chang(常立杰), Jian Wang(王健),Yuewen Zhang(張躍文), Hongan Ma(馬紅安),?, and Xiaopeng Jia(賈曉鵬)
1State Key Laboratory of Superhard Materials,College of Physics,Jilin University,Changchun 130012,China
2Key Laboratory of Material Physics of Ministry of Education,School of Physics and Microeletronics,Zhengzhou University,Zhengzhou 450052,China
Keywords: high pressure and high temperature,,icrostructure,Al-doped ZnO,thermoelectric
1. Introduction
With increasing global attention on energy and environmental issues, thermoelectric materials have attracted extensive attention because they can directly convert waste thermal energy into electrical energy without producing pollution.[1]The core of this technology lies in the choice of thermoelectric materials, which are strong lightweight materials that do not release harmful gases during utilizing. Some traditional thermoelectric materials contain intermetallic compounds such as Bi2Te3and PbTe, and have shown improved thermoelectric properties.[2–5]However, they are also toxic, expensive, and thermally unstable. In recent years, oxide-based thermoelectric materials have been investigated because most traditional thermoelectric materials are easily oxidized and fail at hightemperatures (≥800 K). Zinc oxides are abundant, inexpensive, and environmentally friendly materials that have been investigated as alternative thermoelectric materials for hightemperature applications because of their excellent thermal and chemical stability in air.[6]
The performance of thermoelectric materials is measured by the dimensionless figure of merit, zT =S2σT/κ, where S is the Seebeck coefficient, σ is the electrical conductivity, T is the absolute temperature,and κ is the thermal conductivity.High-performance thermoelectric materials have a high power factor (S2σ) and low thermal conductivity (κ).[7,8]However,these parameters are closely related to each other so that it is difficult to integrate good electrical properties and low thermal conductivity in a single material.[9,10]This universal principle has become a bottleneck preventing further improvements in thermoelectric materials.
Many studies have focused on decreasing the thermal conductivity of ZnO-based thermoelectric materials,[11,12]while increasing the power factor can also optimize zT values. The thermoelectric material ZnO exhibits a high Seebeck coefficient (~340 V·K-1), whereas its electrical conductivity(~10 S·m-1)is still too low for practical applications.[13]Synthesis at atmospheric pressure is complicated and relatively long and can produce low-density samples, and the donor dopant (such as Al) has limited solubility in ZnO matrixes.[14,15]These factors limit the electrical conductivity and power factor of ZnO-based thermoelectric materials.High-pressure high-temperature (HPHT) methods can accelerate synthesis by using pressure to improve the solubility of the donor dopant in ZnO and to increase the density of the sample.[16]
Many efforts have been devoted to studying the thermoelectric properties of ZnO.[17,18]Tanaka et al. used ZnO ceramics sintered by hot-pressing and obtained a power factor of 4.5 μW·cm-1·K-2at 900 K.[19]Guilmeau et al. sintered Al-doped ZnO in air and obtained a maximum power factor of 4.0 μW·cm-1·K-2at 1000 K.[20]Colder et al. synthesized Zn1-xNixO through a liquid route and reached a maximum power factor of 5.6 μW·cm-1·K-2at 900 K.[21]Cai et al.synthesized ZnO by sol-gel processing and reached a maximum power factor of 1.0 μW·m-1·K-2at 773 K.[22]The above literature shows that the thermoelectric properties of ZnO are greatly affected by the synthesis conditions, microstructure,and density of the sample.
ZnO has poor electrical conductivity, and increasing its power factor is key to making it an excellent thermoelectric material. The utilizing of high pressures may improve its electrical properties by forming a polycrystalline structure, changing the lattice structure, or increasing the oxygen vacancies.[23]Grain refinement can reduce the thermal conductivity at high pressures. Bulk nanomaterials scatter phonons with short mean free paths but have little effect on long-range phonons. However,multi-scale hierarchical structures can scatter full-spectrum phonons, which reduces the thermal conductivity. At the same time, doping can produce enough inherent defects to improve the electrical and thermal properties of ZnO.
Here,we employ a high-pressure technique to investigate the effect of different synthesis temperatures on the thermoelectric properties, morphologies, and structures of Al-doped ZnO.
2. Materials and methods
Commercially available ZnO(99.99%,50 nm)and Al2O3(99.99%,30 nm,α-phase)powders were weighed and mixed in a stoichiometric ratio of Zn0.98Al0.02O. The accuracy of the balance was 0.0001 g. The obtained powders were cold-pressed into 10.5×6 mm cylinders and then wrapped in molybdenum foil to prevent contamination. Before synthesis,the cylinders were assembled in chambers. The synthesis was conducted with a large-volume cubic high-pressure apparatus(CHPA,SPD-6×1200)at different synthesis temperatures(973 K, 1023 K, 1073 K, and 1123 K) at the same pressure(3 GPa)for 30 min. The samples obtained at 973 K,1023 K,1073 K, and 1123 K were denoted as Zn0.98Al0.02O-973,Zn0.98Al0.02O-1023, Zn0.98Al0.02O-1073, and Zn0.98Al0.02O-1123, respectively. Platinum-rhodium thermocouples were placed in the chamber to measure the temperature and changes of resistance in comparison with the standard materials, calibrated with temperature. The chamber was quickly quenched to room temperature at high pressure before unloading the pressure. Figure 1 presents a schematic diagram of the chamber.
The phase structure was measured by an x-ray diffractometry (XRD, Rigaku D/Max 2550V/PC, Japan Cu-Kα radiation, λ = 0.15418 nm) with 2θ range from 30?to 70?.Rietveld refinement was performed on the XRD data to obtain the lattice parameters. The cross-sectional morphologies and detailed microstructures were observed using a fieldemission scanning electron microscope(FESEM;JEOL JSM-6700F) and a high-resolution transmission electron microscope(HRTEM;JEOL JEM-2200FS),respectively. The samples in dimensions 3×3×6 mm were cut into two pieces by an STX-202A wire cutter. One piece was measured with a Namicro-III L (JouleYacht, China) thermoelectric test system to measure the electrical conductivity σ and Seebeck coefficient from 323 K to 973 K. The other sample was measured with the LFA-427 (Germany, NETZSCH) laser flash method to test the thermal diffusion coefficient κ in the same temperature range. Using the relation κ =λCpD to calculate the thermal conductivity(the heat capacity Cpof the sample was calculated by the Dulong–Petit law,and the sample density D was measured by an AE124J electronic balance via Archimedes’principle). All the samples were measured by an HMS-5500(Hall Effect Measurement System)to determine the Hall coefficient RH,carrier concentration n,and carrier mobility μ.
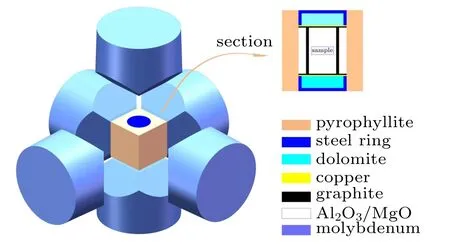
Fig.1. Schematic of HPHT reactive sintering chamber for Zn0.98Al0.02O.
3. Analysis and discussion
We compared the electrical conductivity of ZnO and Zn0.98Al0.02O obtained using the same synthesis parameters(Fig. 2) and found that Al-doped ZnO shows a much higher electrical conductivity because the Al dopant produces electrons via the following reaction:[14,24]


Fig. 2. The electrical conductivity of Zn0.98Al0.02O and ZnO sintered at 973 K.

Fig. 3. Temperature dependences of the (a) electrical conductivity and (b)Seebeck coefficient of samples obtained at different synthesis temperatures.HPHT sintering temperature effect on the (c) Hall coefficient RH, carrier concentration n,and carrier mobility μ of Zn0.98Al0.02O synthesized at different synthesis temperatures.
Figure 3 shows the changes in the electrical properties of the samples with temperature. Figure 3(a) illustrates that the electrical conductivity increases with the temperature before beginning to slowly decrease. At about 453 K, the electrical conductivity of the samples sharply increases. The sample shows metallic behavior at test temperatures higher than 500 K,which is consistent with the previously reported trends.We speculate that this change may arise from the modulation of energy bands by high pressure and high temperature.[26]The electrical conductivity of all the samples reaches a maximum between 400 K and 500 K, and the highest electrical conductivity is obtained in the sample synthesized at 1123 K.At 373 K, the electrical conductivity of Zn0.98Al0.02O-1123 increases from 552 S/m to 6×10⁴S/m as the sintering temperature increases. Figure 3(b) shows that the absolute value of the Seebeck coefficient gradually increases with the test temperature. The Seebeck coefficients of all the samples are negative, which shows that electrical transmission proceeds mainly via electron conduction. At the same test temperature,the absolute value of the Seebeck coefficient decreases at higher sintering temperatures. In addition,Hall measurement was conducted to understand the carrier transport. Figure 3(c)shows that increasing the sintering temperature will increase oxygen deficiency(the carrier concentration of Zn0.98Al0.02O-1123 reaches 6.16×1019cm-3).
Figure 4 shows that the power factor of Zn0.98Al0.02O-1123 increases significantly with the test temperature, and a maximum power factor of 6.42 μW·cm-1·K-2is obtained at 973 K.The power factor does not appear to be saturated,suggesting that it can continue to increase at temperatures higher than 1000 K.

Fig. 4. Temperature dependence of the power factor during the optimization of HPHT temperature.
Figure 5(a) presents the temperature dependences of the sample’s total thermal conductivity(κtot),which is contributed by both the electronic thermal conductivity κeand the lattice thermal conductivity κlat,where κeis proportional to the electrical conductivity, κe= σLT (the Wiedemann–Franz law).Here,L is the Lorentz number(2.45×10⁻⁸V2·K-2).[27]Subtracting κefrom κtotwe obtain κlat,as plotted in Fig.5(b). The results show that the total thermal conductivity κtotand lattice thermal conductivity κlatof the sample remain small as the HPHT sintering temperature increases.
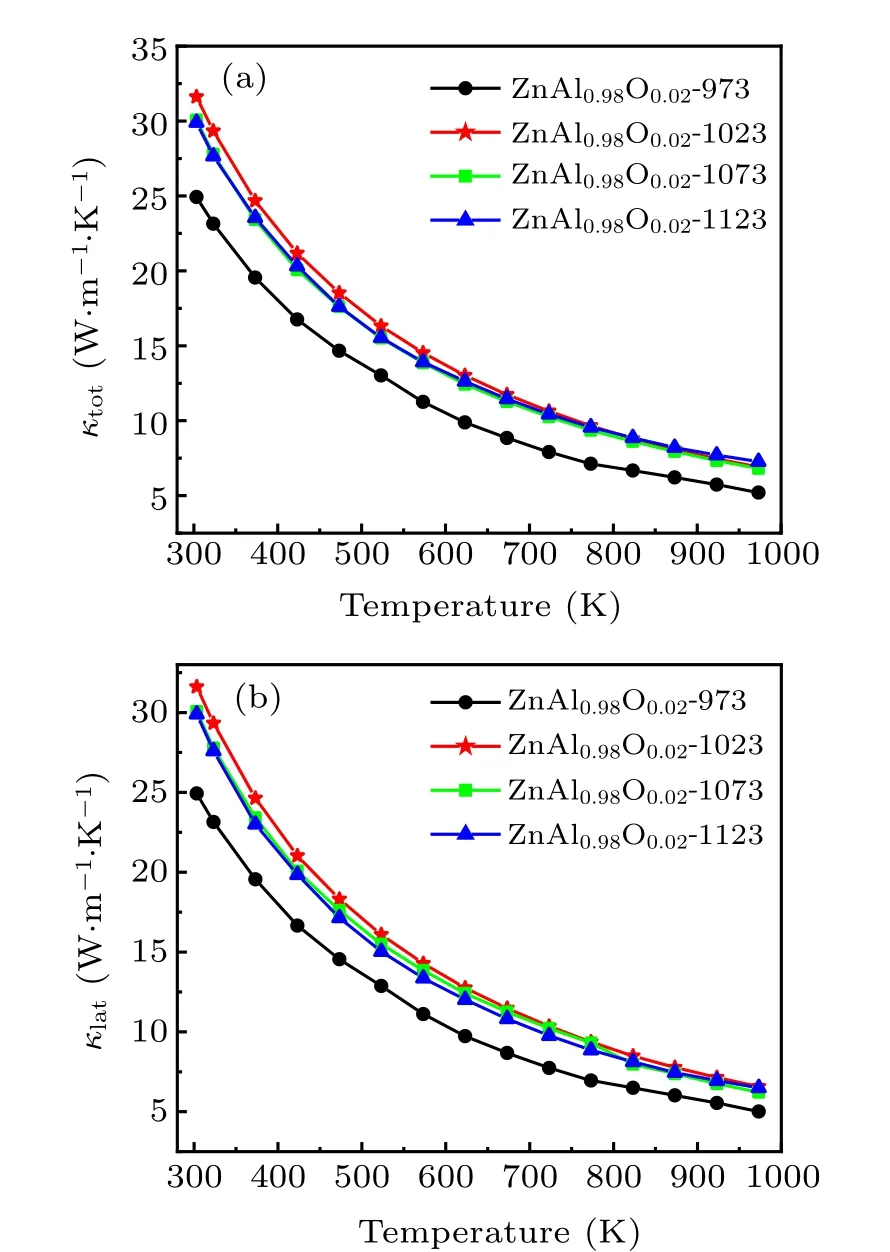
Fig.5. (a)Total thermal conductivity and(b)lattice thermal conductivity of Zn0.98Al0.02O versus temperature.
The electrical and thermal properties of zinc oxide thermoelectric materials can be optimized by adjusting the pressure and temperature during HPHT.The dimensionless figures of merit of our samples as a function of temperature, zT, are depicted in Fig.6. Here zT greatly increases as the electrical performance of zinc oxide is improved, whereas zT does not appear to become saturated as the test temperature increases,suggesting that zT will continue to increase above 1000 K.In general,the zT value increases with the sintering temperature,showing that the HPHT sintering temperature plays a dominant role in the thermoelectric performance of the sample.
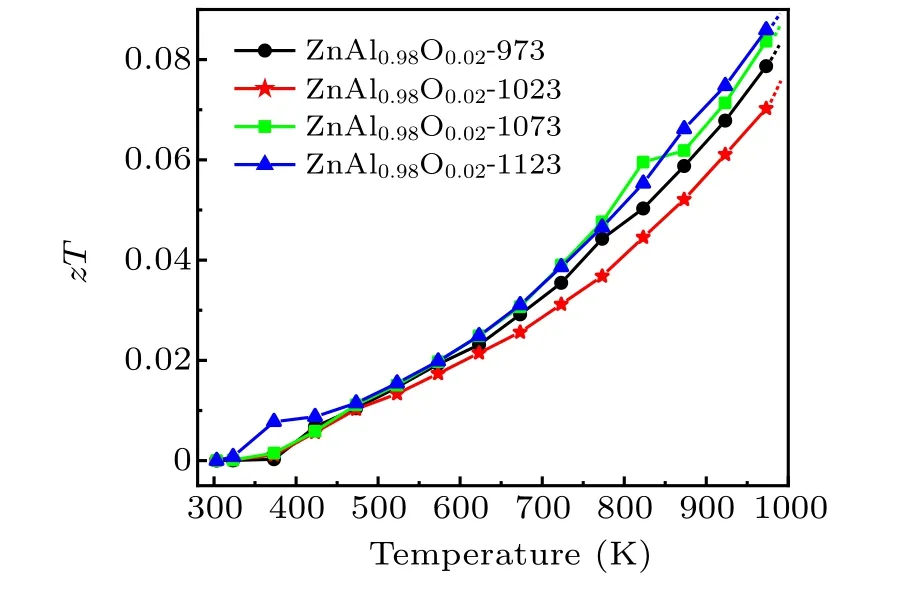
Fig.6. Temperature dependences of the zT values of Zn0.98Al0.02O.
3.1. Relative density and band structure
Figure 7 shows the XRD pattern of the sample optimized by HPHT. No impurity peaks were detected in the XRD pattern, indicating that Al was completely doped into ZnO. It is also shown that HPHT improved the solubility of Al in ZnO.[28]Within the range of 2θ (30?–70?),the peak positions of all the samples are consistent with hexagonal ZnO (space group P63mc,PDF No.80-75). This indicates that hexagonal ZnO was sintered within 30 min(the structure model of ZnO on the left side of the label in Fig.7). Conventional synthesis methods often require more than 12 hours, which means that the utilizing of a high pressure greatly improved the synthesis efficiency.The peak intensity of the XRD pattern gradually increases with the synthesis temperature. It can be inferred that high temperature can promote the synthesis of Zn0.98Al0.02O.

Fig. 7. XRD patterns of Zn0.98Al0.02O synthesized at 3 GPa and at different temperatures.
To study the effect of the synthesis temperature under high pressure on the relative density of Zn0.98Al0.02O,we obtained the Rietveld structural refinement from the XRD data using GSAS (general structure analysis system). Figure 8(a)shows the refined curves of the sample synthesized at 1123 K and 3 GPa. The lattice constants of the sample synthesized at 3 GPa were obtained from the refined results(a=b=3.245 ?A;c=5.198 ?A).The lattice structure of ZnO was changed(ambient pressure a=b=3.25 ?A;c=5.2 ?A).All other samples were refined in the same way,and the XRD refinement results were inserted into the following formula to calculate the theoretical density(TD):[29]
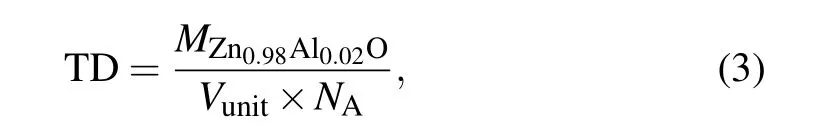
where MZn0.98Al0.02Ois the relative molecular mass of Zn0.98Al0.02O,Vunitis the unit cell volume of the sample,and NAis Avogadro’s number. Archimedes’principle was used to obtain the true density of the sample (ρ). Figure 8(b) shows that the relative density (RD) of the samples (RD=ρ/TD)increases at higher sintering temperatures.[30,31]

Fig. 8. (a) X-ray Rietveld refinement profile of Zn0.98Al0.02O synthesized at 1123 K. (b) Relative density of samples at different synthesis temperatures.
The refinement results were used to calculate the band structures using CASTEP software package. The band gap was underestimated using density functional theory(local density approximation). We found that the energy band structure at high pressure underwent tremendous changes(ambient pressure band gap=3.2 eV),possibly due to changes in its lattice structure. The band structure details at 3 GPa are shown in Fig.9,and the results at different pressures show a similar trend. Both the conduction band minimum(CBM)and the valence band maximum(VBM)are located at vector G in Fig.9,which means that ZnO synthesized at high pressures(3 GPa)is a direct band gap semiconductor.[32]

Fig.9. Band structure at 3 GPa.
3.2. Microstructure and morphological characterization
To optimize the HPHT temperature and determine its effects on the micro morphology (Fig. 10) of the samples, the fracture surfaces of the samples were characterized by scanning electron microscopy (SEM). Figures 10(a)–10(d) give the low-magnification SEM images showing the sample morphologies. Regardless of the sintering temperature, all the samples were covered with deposits of various sizes, which decrease the thermal conductivity. From Figs. 10(a)–10(d),the grain size generally coarsens, and the crystallinity of the sample is improved at higher synthesis temperatures,with increasingly fewer pores between grains. Figures 10(e)–10(h)show the high-magnification SEM images of the sample morphologies.Nanoscale grains of various sizes are randomly distributed between the sample surface and the crystal surface due to grain refinement at 3 GPa.
HPHT synthesis methods provide more freedom for adjusting the synthesis pressure, which can be used to tune the thermoelectric properties of a material.[33]The micromorphologies of samples synthesized using HPHT change at different temperatures, and the ideal ZnO morphology could be obtained by changing the pressure and temperature during HPHT synthesis.
The micromorphology of Zn0.98Al0.02O-1123 was characterized by TEM(Fig.11).Figure 11(a)shows fringes(black areas), along with particles of various shapes and sizes. Figure 11(d) presents the medium-magnification TEM image,which also shows fringes in the sample. Figure 11(f) gives the localized electron diffraction pattern of the yellow rectangular frame in Fig. 11(d) and shows that HPHT is useful for manufacturing polycrystalline structures. Figure 11(b)shows the presence of many lattice defects (white circles) and dislocations (red circles). The small image on the upper left of Fig.11(b)is the IFFT transform of the red area,which makes changes in the fringes more obvious. Figures 11(c)and 11(e)show many lattice defects(white circles)and crystal shear defects (green circles). The small graph on the upper left of Fig.11(c)is the FFT of the white circle area. The distribution of the frequency domain corresponding to defects is helpful for analyzing the defects. Figures 11(b),11(c),and 11(e)contain fringes with different pitches. These fringes belong to the(102)crystal plane detected by XRD.The slight change in the interplanar spacing is caused by the application of a pressure of 3 GPa.
The utilizing of high pressure can form many lattice defects, and high-pressure quenching promotes the growth of nanoscale grains. The defects improve the thermoelectric properties of the material,suggesting that HPHT can be used to obtain desired morphologies.[34]
The HPHT sintering temperature greatly affects the electrical properties of Zn0.98Al0.02O, showing that the electrical properties of the sample are improved due to changes in the microstructure and morphology of the material.

Fig. 10. (a)–(d) Low-magnification SEM images of the sample morphologies used to optimize the temperature during HPHT synthesis and(e)–(h) high-magnification SEM images of the same samples: (a) and (e) Zn0.98Al0.02O-973; (b) and (f) Zn0.98Al0.02O-1023; (c) and (g)Zn0.98Al0.02O-1073;(d)and(h)Zn0.98Al0.02O-1123.

Fig.11. (a)and(d)Low-magnification TEM images taken from a representative Zn0.98Al0.02O-1123 sample;(b),(c)and(e)HRTEM images of this sample showing the presence of multiple microstructures;(f)the electron diffraction pattern of the yellow selection in(d).
In conventionally sintered thermoelectric materials, the thermal conductivity increases at higher temperatures, which does not help increase the zT of thermoelectric materials because the relative density decreases at higher synthesis temperatures. Although the thermal conductivity of a sample can be effectively reduced at lower densities,the electrical properties are also greatly reduced. However,the utilizing of HPHT increases the degrees of freedom of the pressure compared with conventional methods, allowing the electrical and thermal properties of thermoelectric materials to be adjusted.
The thermal conductivity of the sample decreases monotonously as the test temperature increases, possibly due to grain refinement at a high pressure.
There is a well-known relationship between phonon relaxation time τ and lattice thermal conductivity κlat

where CV, v, and l are the constant-volume specific heat,phonon velocity,and phonon mean-free path,respectively.[35]For a particular material,CVand v are different.The relaxation time of phonon scattering can be written as
where τp, τn, τme, τmi, and τuare the relaxation times corresponding to point defect phonon scattering, nanoscale scattering agents, mesoscale scattering agents, micrometer-scale grain boundaries,and Umklapp scattering,respectively.[36]
The XRD data show that HPHT changes the ZnO lattice structure, and the SEM and TEM images show that HPHT makes a multi-scale hierarchical structure form and defects serve as phonon scattering sources. Phonon scattering mechanisms are affected by the size scale of the media,[36]but all size scales can hinder phonon propagation and increase scattering. The samples exhibit low thermal conductivity because the multi-scale hierarchical structure induces full-spectrum phonons scattering. Finally, the phonon propagation in samples obtained at high temperatures is dominated by highfrequency phonons with short and medium length scales. The shorter lattice thermal conductivity at a high temperature occurs mainly because of high-frequency phonons scattering by point defects and Umklapp scattering. Increasing the test temperature enhances all scattering effects, which explains why the lattice thermal conductivity of our samples decreases at higher test temperatures.
4. Conclusion
To improve the electrical properties of ZnO while maintaining a low thermal conductivity, the temperature in the HPHT synthesis is optimized. As the synthesis temperature increases at 3 GPa, the band gap of ZnO greatly decreases,and its microporosity gradually decreases. HPHT increases the electrical conductivity of Zn0.98Al0.02O to 6×10⁴S/m at 373 K,and its power factor increases to 6.42 μW·cm-1·K-2at 973 K.The electrical properties are greatly improved because HPHT changes the band structure and increases the relative density of the zinc oxide. Grain refinement and the production of a multi-scale hierarchical structure at high pressure are the main factors for retaining zinc oxide’s low thermal conductivity. Finally, improved zT values(0.09 at 973 K)are obtained in Zn0.98Al0.02O-1123.

- Chinese Physics B的其它文章
- Numerical simulation on ionic wind in circular channels*
- Interaction properties of solitons for a couple of nonlinear evolution equations
- Enhancement of multiatom non-classical correlations and quantum state transfer in atom–cavity–fiber system*
- Protein–protein docking with interface residue restraints*
- Effect of interaction between loop bases and ions on stability of G-quadruplex DNA*
- Retrieval of multiple scattering contrast from x-ray analyzer-based imaging*