The classification of plants by laser-induced breakdown spectroscopy based on two chemometric methods
2020-07-09 04:20:06ZhongqiFENG馮中琦DachengZHANG張大成BowenWANG王博文JieDING丁捷XuyangLIU劉旭陽andJiangfengZHU朱江峰
Plasma Science and Technology 2020年7期
Zhongqi FENG (馮中琦),Dacheng ZHANG (張大成),Bowen WANG (王博文),Jie DING (丁捷),Xuyang LIU (劉旭陽) and Jiangfeng ZHU (朱江峰)
School of Physics and Optoelectronic Engineering,Xidian University,Xi’an 710071,People’s Republic of China
Abstract
Keywords:laser-induced breakdown spectroscopy,principal component analysis Mahalanobis distance,partial least squares discriminant analysis,classification of complex organics
1.Introduction
The analysis on organics,especially the rapid identification of bacteria,explosives and plastics,is important for disease prevention,public safety and waste recycling [1–3].Various techniques such as the near-infrared spectroscopy (NIR),X-ray fluorescence spectroscopy(XRF),Raman spectroscopy or mass spectrometry can be used for organics analysis for their good detection ability of molecules [4–6].NIR has the high precision and speed but poor recognition results for these black or heavily polluted organics [4].XRF is suitable for identifying organic molecules with heavy atoms such as chlorine,but is not sensitive to light elements [5].Raman spectroscopy can determine the molecular structure by detecting scattered light on the sample surface.However,it is difficult to analyze the trace molecular via Raman spectroscopy because its signal is proportional to the number of molecules excited by laser[6,7].The mass spectrometry is a sensitive technology for elements and molecular analysis.But it needs sample preparation and runs in vacuum [8].For on-line monitoring applications,it is urgent to find a realtime,in situ and without sample preparation method for classifying organics.
Laser-induced breakdown spectroscopy (LIBS),as a powerful tool for element detection,and has acquired great interest in recent years [9–14].It allows for fast contact-less analysis of any materials and has unique versatility and capabilities for on-line composition determination [15,16].For organics,especially synthetic organics such as plastics and explosives,the major elements are C,H,O,and N.It is difficult to classify these materials by LIBS directly [17–19].If machine learning or chemometric methods are applied to analyze the data of LIBS,the organics can be classified by comparing slight difference of their spectra [20,21].Several methods such as artificial neural networks(ANN)[3,22,23],support vector machines (SVM) [24,25],principal component analysis (PCA) [22,26]and partial least squares discriminant analysis (PLS-DA) [27,28]have been used for LIBS application.
Moench et al first carried out identification of polymers by LIBS.The recognition rate of four kinds of plastics by ANN algorithm was 87%–100% [23].Unnikrishnan et al used PCA and statistical parameters to classify four kinds of common plastics.The average accuracy of these plastics is more than 90% [26].Yu et al correctly identified 9 out of 11 kinds of plastics by SVM [24].Delucia et al first used LIBS to distinguish explosives from other energetic materials [2],and a very high identification accuracy was obtained by PLSDA[27].Wang et al successfully distinguished the simulation spectrum of TNT molecules from seven kinds of plastics by chemometric methods [29].Samuels et al reported the identification of bacterial spores by LIBS [1].Rao et al classified different microorganisms by combining PCA with the algorithm of random forest[30].Wu et al identified waste oil and edible oil rapidly by PCA and ANN methods [22].Yu et al identified the powder of green tea and matcha by PCA and linear discriminant analysis (LDA) [31].
From the above work,it can be found that LIBS has been extensively studied on classifying different organics.However,there are few reports on the classification of more complex organics such as the fresh plant tissues.Rapid identification of fresh plant tissues by LIBS technology could be significant for plant traceability on-line.However,the intensity of lines is easily affected by physical and chemical properties of fresh plant tissues,which will result in large fluctuations in the spectra of samples and increase the difficulties for identification.Optimization algorithm can help to improve the accuracy of classification for fresh plant tissues.In this paper,the identification methods of complex organics by LIBS were studied.Three kinds of plant leaves were measured and two chemometric methods PCA-MD and PLSDA were used for classifying leaves.
2.Experimental setup and sample presentation
The experiments were carried out with a Nd:YAG laser(Dawa-300,Beamtech,China) which can deliver up to 300 mJ pulse energy at its fundamental wavelength.The pulse duration is 7 ns and the repetition rate is 10 Hz.Figure 1 shows the schematic drawing of the LIBS system in this work.The pulse energy of laser was monitored by an energy meter (J-MB-HE,Coherent,USA).The laser beam was focused on the sample using a quartz lens with 60 mm focal length.Plasma emission was focused to a bifurcated fiber cable by a pair of plano-convex lenses.The fiber was connected to a two-channel fiber optic spectrometer (AvaSpec-ULS2048-2-USB2,Avantes,Netherlands)with a spectral resolution of 0.08–0.11 nm in the range of 220–432 nm.The signals were recorded by CCD detectors with 2 ms minimum gate width.A versatile digital delay generator (DG645,SRS Inc.USA) was used to trigger the laser and the spectrometer so that the delay time between detector and laser pulse can be adjusted.The samples were stuck in a 3D motorized translation stage to refresh the target point and avoid the destruction of samples.All the experiments were carried out in air without any control of the surrounding atmosphere.
The samples were three kinds of leaves (Ligustrum lucidum Ait,Viburnum odoratissinum,Bamboo).To avoid the interfere of environments of different regions,all samples in this work were collected in our campus.100 pieces of each kind of leaves were collected to measure the spectra.They are all matured leaves with similar growth state.In experiments,each piece was used only one time.The leaves were cleaned by distilled water firstly and dried in air naturally to remove the dust on their surface.The pulse energy was controlled to 30 mJ.The delay time between laser ignition and spectral acquisition was optimized at 300 ns.To improve the repeatability of measurements,100 spectra were acquired for each kind of leaves and each spectrum was an averaged result of 100 laser pulses.
3.Results and discussion
The LIBS spectra from three kinds of leaves are presented in figure 2.More than 16 kinds of elements and molecules were identified according to the National Institute of Standard and Technology (NIST) atomic spectroscopy database and our previous work[32,33].The spectra from these three kinds of leaves are so similar that it is difficult to classify them directly.
Chemometrics are multivariate classification methods.They are commonly used to recognize the kinds of samples by establishing mathematical models [34].Once a classification model is established,the unknown samples can be predicted as one of the defined classes.In this work,the two methods PCA-MD and PLS-DA are used to classify the leaves.
To build a prediction model,arbitrary 70 spectra of each kind of leaves were used as the training set and the other 30 spectra were used as the test set.The lines from 16 elements and molecules listed in table 1 were used as the input data.The lines were normalized by the sum of all line’s intensity firstly.
3.1.Principal component analysis Mahalanobis distance(PCA-MD)
Principal component analysis (PCA) is a popular method for extracting information from data.It is normally used for dimensionality reduction.To reduce the dimension,PCA uses some new components to replace the variables in the original data [34].The new components should be less than the variables and be independent completely.The PCA was used to reduce the dimensionality of the data matrix by finding the underlying relationship between the variables [35].
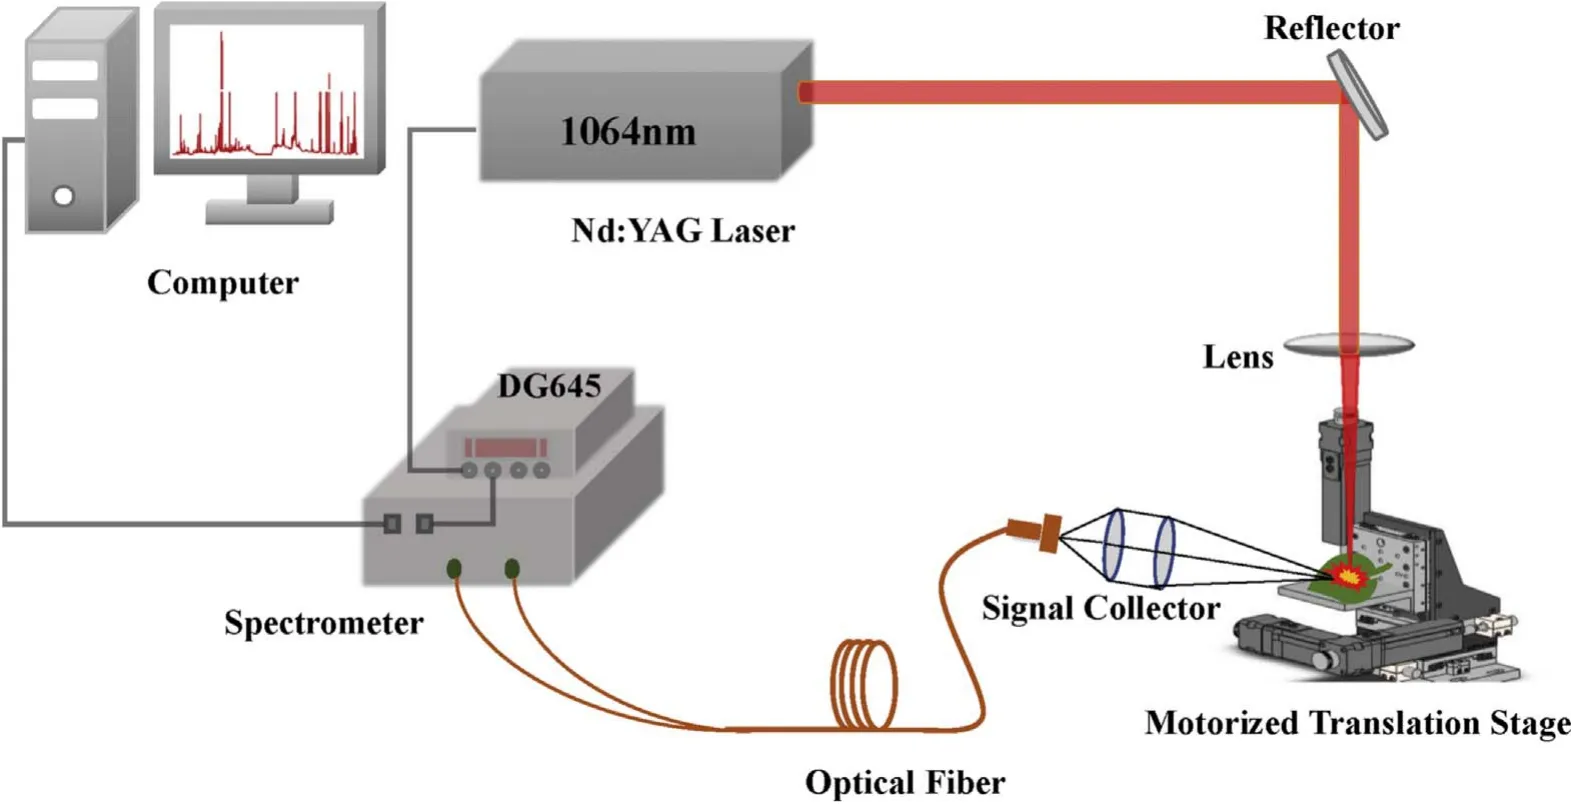
Figure 1.Schematic of the LIBS experimental setup.
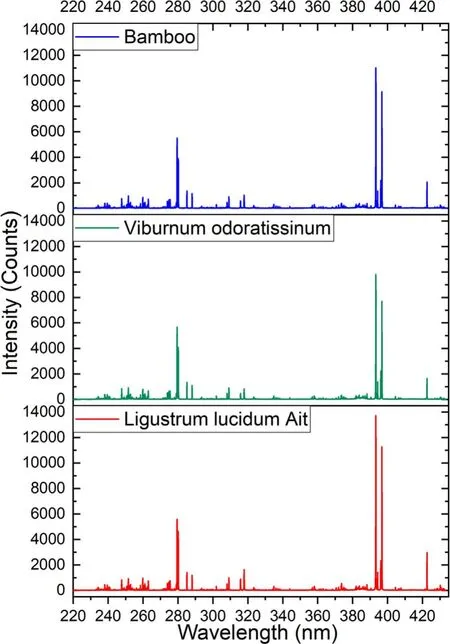
Figure 2.The LIBS spectrum of three kinds of leaves.
Mahalanobis distance (MD) is a distance measure and it can be used to identify different patterns with respect to a reference baseline [36].The equation for computing the distance is given as follows:
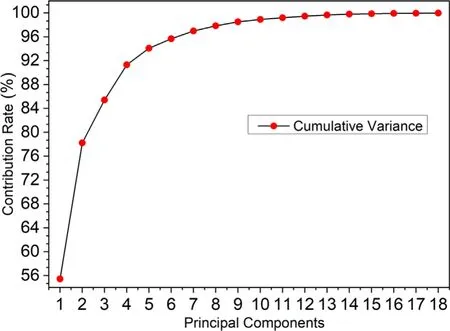
Figure 3.Principal component contribution rate.
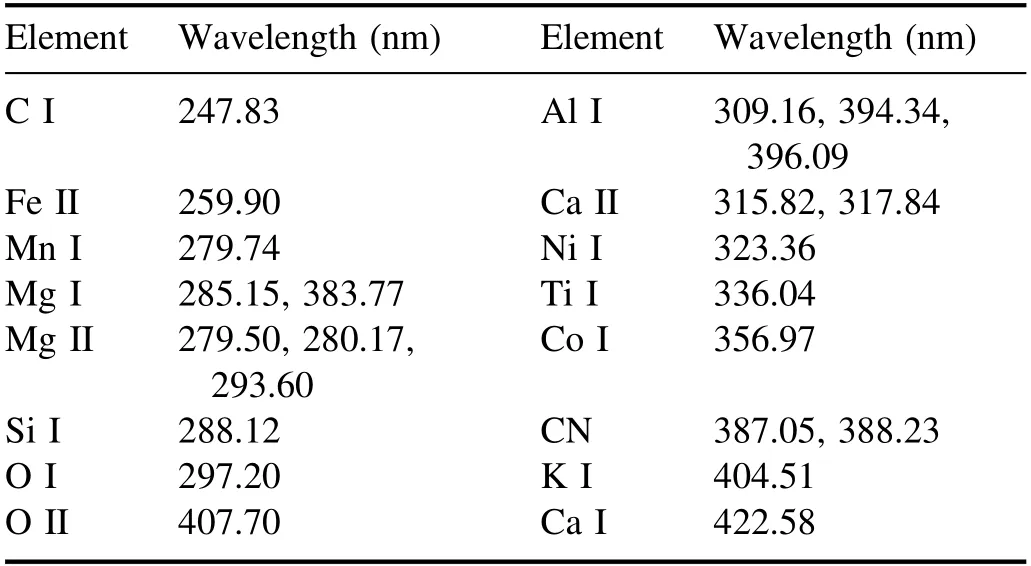
Table 1.The characteristic lines used as input data.
where X is the spectral variable matrix,μ and v are the mean and covariance of X respectively,D is the value of MD.
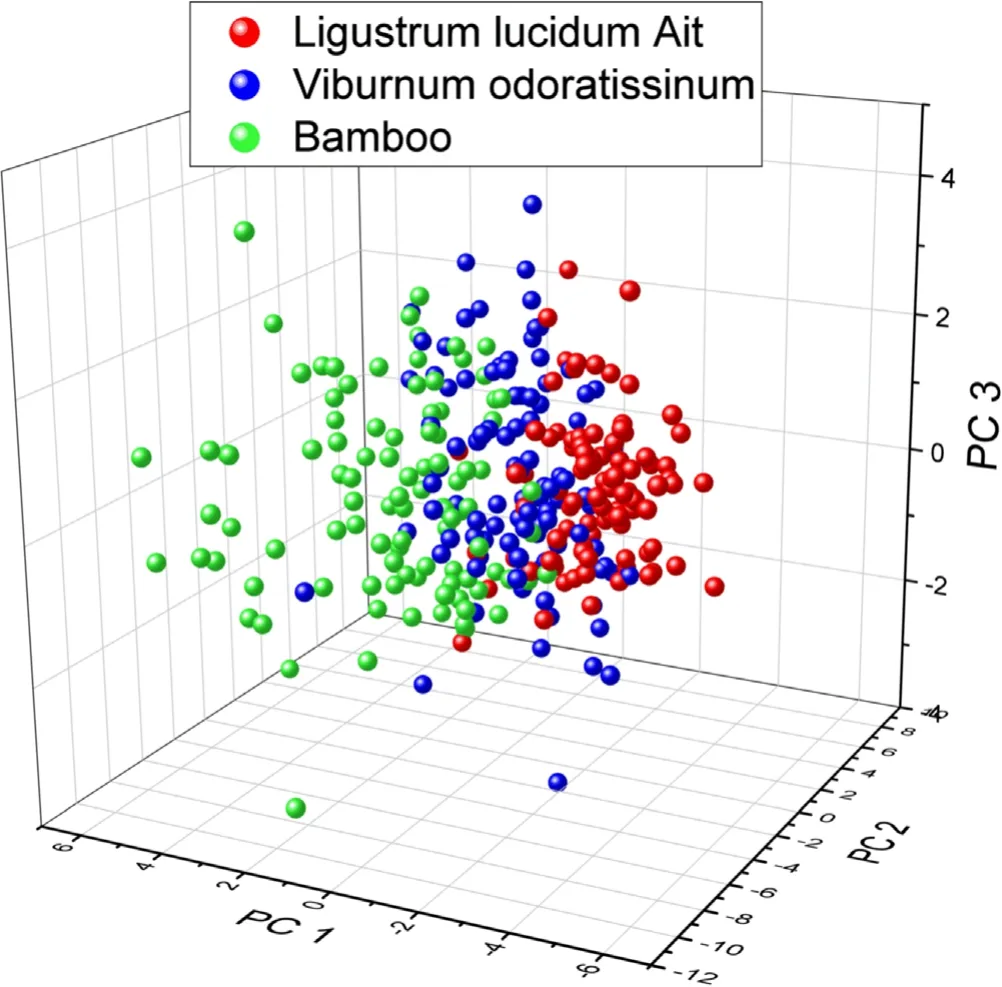
Figure 4.The 3D pattern based on the first three principal components of three kinds of leaves.
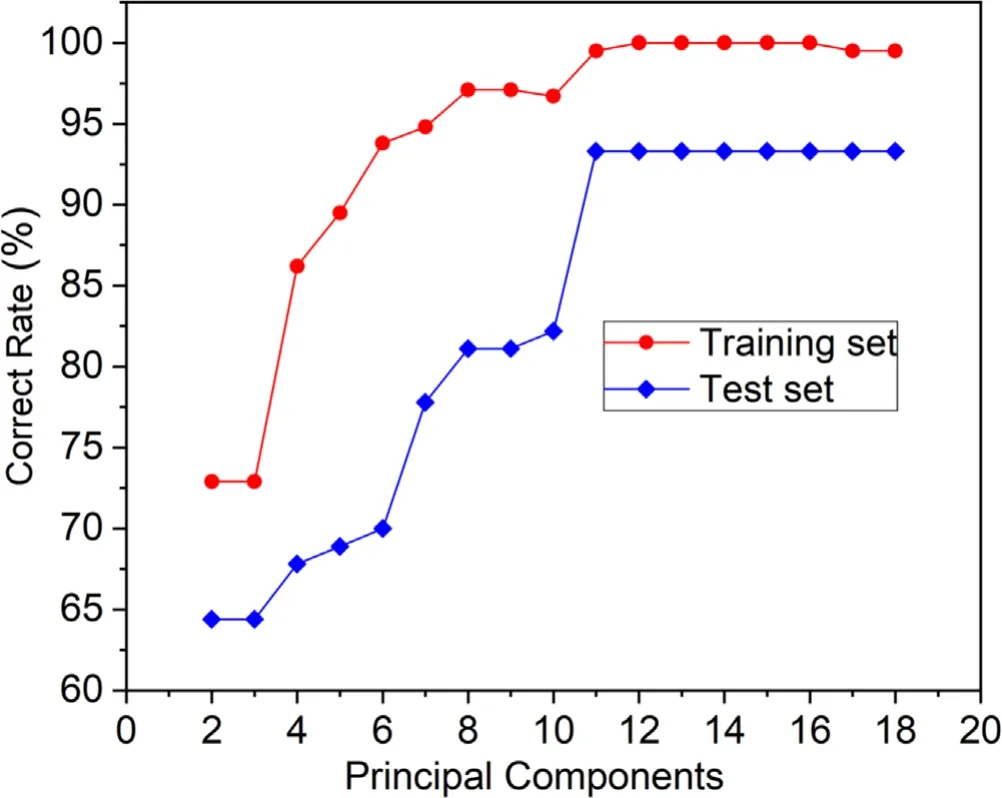
Figure 5.The correct rate of PCA-MD as a function of principal component numbers.
As shown in figure 3,the variance contribution rates of the first 18 principal components were obtained by performing PCA operation on the normalized data.A 3D pattern drawn by the first three principal components which accumulated 85.42%of variation information is shown in figure 4.It can be found that the information from first three principal components could not classify these three kinds of leaves accurately.However,if the number of principal components exceeded four,it was impossible to establish an intuitive PCA classification pattern in Cartesian coordinates.
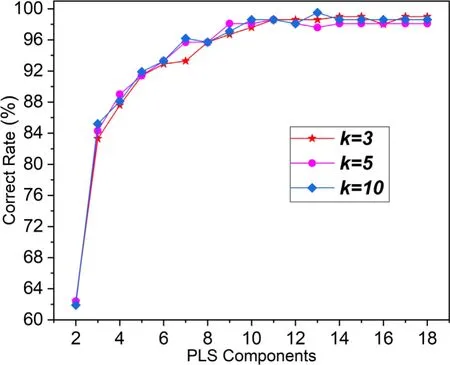
Figure 6.The correct rate of cross-validation with PLS-DA as a function of k.
When the features of the data were extracted by PCA,the MD was computed by different number of principal components.The training set was used to find the centroids of three kinds of spectra data points.In the process,the sum of MDs between the points of the same sample and their centroid is the smallest.Then the points in test set were used to obtain prediction results.The label of centroid with minimum MD will represent the kind of points in the test set.Figure 5 shows that the accuracy of the PCA-MD is maximum when the number of principal components is more than 12.The accuracies can be up to 100% and 93.3% for the training set and the test set,respectively.It means that PCA-MD can classify these plant leaves clearly.The method can also simplify the computation process for lower dimensional data.
3.2.Partial least squares discriminant analysis
Partial least squares discriminant analysis (PLS-DA) is a linear classification method.It combines the properties of partial least squares regression with the discrimination power of a classification technique[37].The method can effectively reduce the influence of noise,missing values and outliers of modeled sample data by searching for PLS components.It just requires enough data to establish a classification model,but not need to study the physical laws of the samples [28].The PLS-DA program was operated under the MATLAB environment.In PLS-DA,the intensity of lines was transformed into a matrix X,and the class labels were transformed into a matrix Y.Both X and Y in training set were used to train PLS-DA model.To build the model,the number of PLS components should be optimized.It was carried out by crossvalidation in many works [37–39].In this work,the k-fold cross-validation method was adopted for its strong calibration capabilities on model.As shown in figure 6,the value of k was set to 10,5,and 3,which means that the training set was divided into 10,5,and 3 groups.Each cross-validation group took the same interval.They were not obviously different when the value of k was reduced from 10 to 5 and then to 3.It means that the PLS-DA model established by the training set was robust.It also can be found that there was no obvious improvement for the cross-validation results if the number of PLS components exceeded 9.Thus,the number of PLS components was optimized from 9 to 18 in our PLS-DA model.
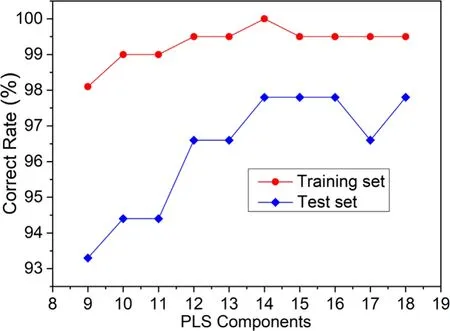
Figure 7.The correct rate of PLS-DA as a function of PLS component numbers.
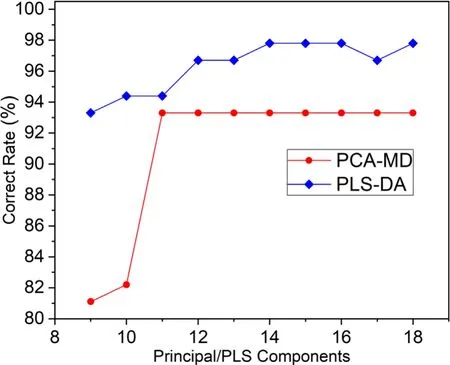
Figure 8.The classification results of two methods.
The test set was predicted by the PLS-DA model here.Figure 7 shows the classification accuracy by this method.It can be found that the correct rates for classifying three leaves are both increasing with the number of PLS components.The maximum classification accuracies are 100% and 97.8% for training set and test set,respectively.
3.3.Comparison of PCA-MD and PLS-DA
The LIBS spectra of these three kinds of leaves have been classified by PCA-MD and PLS-DA.The classification results of these two methods for the test set are shown in figure 8.
Both PCA-MD and PLS-DA can obtain relatively high accuracy.On the whole,PLS-DA has higher prediction accuracy than PCA-MD in this work.When the feature extraction is performed,a high-dimensional spectral data is reduced to a lower dimension and the computational efficiency can be improved.The PCA does not take the class information of the samples into account when it reduces the dimensionality of the spectral change matrix.Thus,the larger spectral difference in the samples,the more serious deviation between the principal components extracted by PCA for MD discrimination and real classification.However,the covariance between the matrix X (spectral change) and the matrix Y (sample label) is included in PLS-DA,so that the PLS components can be optimized and the shortcomings of PCA can be overcome[34].In short,PLS-DA is more suitable for classifying fresh leaves spectra than PCA-MD.
4.Conclusions
In this work,LIBS was used to rapidly identify the fresh plant leaves.The PCA-MD and PLS-DA were studied to classify the spectra from the leaves,and a high discrimination accuracy rate for fresh plant samples was obtained.The best prediction result was 93.3% for PCA-MD when the number of principle components exceeded 11,while the best prediction result was up to 97.8% for PLS-DA with more than 14 PLS components.By comparing these two methods as a whole,the prediction result of PLS-DA for the test set is more accurate than that of PCA-MD.For extracting feature components,PLS-DA takes the change of both spectra and leaves types into account at the same time.But the PCA-MD includes the maximum spectral change information no matter whether this information is useful for classifying plant leaves or not.Therefore,the PLS components in PLS-DA are more helpful for classifying leaves than the principle components in PCA-MD.In brief,PLS-DA has a stronger ability to recognize plant leaves species than PCA-MD for its optimal PLS components between each kind of leaves.This result can provide a reference for further rapid detection and classification of organics such as plant traceability.
Acknowledgments
This work was supported by the Fundamental Research Funds for the Central Universities of Ministry of Education of China(No.JB190501),Science and Technology Innovation Team of Shaanxi Province(No.2019TD-002)and National Natural Science Foundation of China (No.11774277).
 Plasma Science and Technology2020年7期
- Plasma Science and Technology的其它文章
- Way-out for laser-induced breakdown spectroscopy
- A feature selection method combined with ridge regression and recursive feature elimination in quantitative analysis of laser induced breakdown spectroscopy
- Uranium measurements using laser-induced breakdown spectroscopy in lithium chloridepotassium chloride salt of pyroprocessing
- Accuracy improvement of quantitative analysis of calorific value of coal by combining support vector machine and partial least square methods in laserinduced breakdown spectroscopy
- Rapid online analysis of trace elements in steel using a mobile fiber-optic laserinduced breakdown spectroscopy system
- Improvement in classification accuracy of stainless steel alloys by laser-induced breakdown spectroscopy based on elemental intensity ratio analysis