November 2019
2019-12-31 09:08:07byCottonIncorporated
China Textile 2019年12期
by Cotton Incorporated
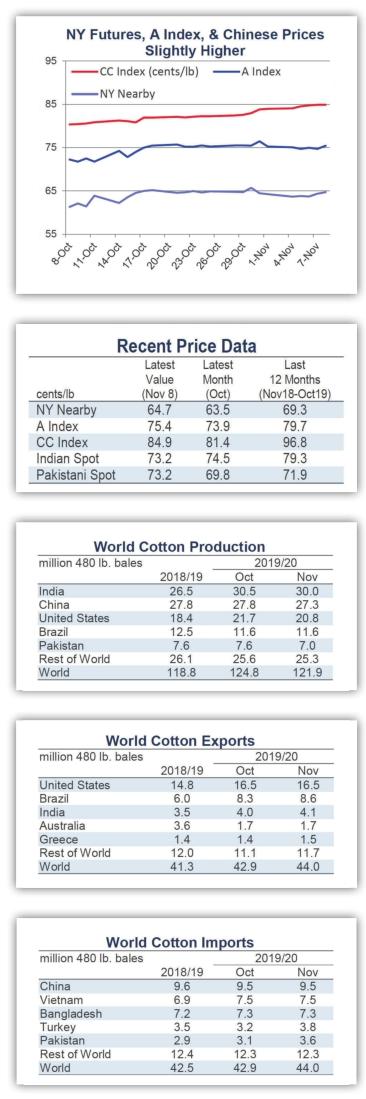
Recent price movement
Most benchmark prices increased slightly over the past month. Indian prices were stable.
The NY December futures contract rose from 62 to 64 cents/lb.
The A Index rose from 72 to 75 cents/lb.
In international terms, the China Cotton Index (CC Index 3128B) increased from 80 to 84 cents/lb. In domestic terms, the CC Index increased from 12,600 to 13,000 RMB/ton. The RMB strengthened against the dollar over the past month, from 7.10 to 6.99 RMB/USD(+1.6%).
Indian cotton prices (Shankar-6 quality) held to values near 74 cents/lb. In domestic terms, values drifted marginally lower, from 41,600 to 40,800 INR/candy. The Indian rupee was stable near 71 INR/ USD over the past month.
Pakistani prices rose from 68 to 73 cents/lb between early October and early November. In domestic terms, values increased from 8,700 to 9,400 PKR/maund. The Pakistani rupee was stable near 156 PKR/USD over the past month.
Supply, demand, & trade
The latest USDA report featured a decrease in world production (-2.8 million bales, from 124.8 to 121.9 million) and a slight downward revision to world mill-use (-116,000 bales, from 121.6 to 121.5 million). With the decrease in production greater than the decrease in consumption, the figure for world ending stocks decreased (-2.9 million bales, from 83.7 to 80.8 million). This months reduction to projected ending stocks brings the forecast to a level virtually equal to those estimated for the past three crop years (between 80.3 and 80.9 million since 2016/17).
At the country-level, the largest changes to harvest estimates included those for the U.S. (-888,000 bales, to 20.8 million), Pakistan (-600,000, to 7.0 million), China (-500,000, to 27.3 million), India (-500,000, to 30.0 million), Turkey (-300,000, to 3.8 million), Turkmenistan (-150,000, to 1.0 million), and Greece (+100,000, to 1.6 million).
The largest changes to mill-use figures included those for India (-250,000 bales, to 24.5 million), Turkey (+200,000, to 7.1 million), Indonesia (-100,000, to 3.1 million), and Uzbekistan (+100,000, to 3.0 million).
The global trade forecast increased 1.1 million bales (to 44.0 million). The largest changes for exports included those for Brazil (-300,000 bales, to 8.6 million), Malaysia (+250,000, to 0.6 million), Benin (+100,000, to 1.4 million), Greece(+100,000, to 1.5 million), and India(+100,000, to 4.1 million). The largest changes for imports included those for Turkey (+600,000 bales, to 3.8 million), Pakistan (+500,000, to 3.6 million), India(+200,000, to 1.8 million), and Indonesia(-200,000, to 3.1 million).
Price outlook
The U.S.-China trade dispute remains a central source of uncertainty for the global cotton market. Progress appears to have been made towards an initial agreement. However, details have not been confirmed, and a date for signing has not been set. A signing was anticipated at the APEC summit in mid-November, but the meeting was canceled due to unrest in the host city (Santiago, Chile). Suggestions were that the U.S. and China could meet in the U.S. in November to seal an agreement, but it now appears that the two parties will not be able to close on a deal until December.
A series of comments have been released that hint at what the agreement might include. From the U.S. side, there have been statements saying that China will agree to increase agricultural imports from the U.S. to $40 - 50 billion (the record is $25.9 billion set in 2012, that was soon after the price spike, and U.S. cotton exports to China were 6.8 million bales that 2012 calendar year). Although there have been significant purchases of soybeans, Chinese officials have not confirmed the large increase in agricultural imports. Among the few comments released by Chinese officials concerning U.S. cotton is that state-owned mills already have contracted 320,000 tons(1.5 million bales) and that private mills would only purchase according to their needs.
From the Chinese side, there have been statements indicating that all tariffs will be dropped from both countries. U.S. officials, however, are signaling a preference for a gradual pullback in tariffs.
Any reductions in tariffs would be a stark reversal in direction from the series of increases announced in August. One of those announcements led the U.S. to implement higher tariffs (15 percentage points) on imports of Chinese-made apparel in September (covering product categories where Chinas share of U.S. apparel imports is less than 75%).
Because the announcement leading to the September tariff increases was made less than one month before, U.S. retailers had little time to adjust. Nonetheless, there was a reduction in the volume of apparel imported from China in September (-13% in terms of square-meter equivalence year-over-year),. However, Chinas share remained high (45%), and the sum of the volume of Chinese apparel imported in the last three months of trade data was slightly higher year over year (+1%, July-Sept). Over the same three months, Chinas share was stable year-over-year (47%). It remains to be seen if the decrease in apparel imports from China in September was a result of retailers pushing deliveries ahead (imports from China were+12% year-over-year in July and +5% year-over-year in August) or if it represents the start of a trend away from China. Slower demand for Chinese apparel imports can translate into slower Chinese mill demand for fiber.
When considering potential parallel declines in demand across industries, it becomes obvious how the trade dispute can slow overall economic growth. If unresolved, the International Monetary Fund (IMF) estimates that the trade dispute will subtract 0.8 percentage points from global GDP growth in 2020. Coincidently, the value of 0.8 points is nearly equal to the decrease in IMF forecasts for global GDP in 2019 made before the major rounds of tariff increases (3.9% in April 2018, calling for the strongest growth since the financial crisis) and their current estimate (3.0% in October, calling for the slowest growth since the financial crisis). Global GDP growth is closely associated with growth in global mill-use, and the current sluggish economic conditions have been accompanied by sluggish demand from spinning mills.

- China Textile的其它文章
- MILANO UNICA:SS 2021 TENDENZE GEN Z_GEN FUTURE:CULTURE TRIBE 5.0
- Itema exhibiting futuristic innovations at Italian Design Icons
- When the going gets tough...
- Why brands need to reposition for the conscious consumer
- Analysis of development status of geosynthetics industry
- S&S Intelligent Science and Technology celebrated its 20th anniversary