Effects of distributed leading-edge roughness on aerodynamic performance of a low-Reynolds-number airfoil: an experimental study
2018-07-27 07:37:20YanZhang
Yan Zhang*
Department of Mechanical Engineering, North Dakota State University, Fargo, ND 58108, USA
Keywords:
ABSTRACT Distributed leading-edge (LE) roughness could have significant impact on the aerodynamic performance of a low-Reynolds-number (low-Re) airfoil, which has not yet been fully understood.In the present study, experiments were conducted to study the effects of distributed hemispherical roughness with different sizes and distribution patterns on the performance of a GA (W)-1 airfoil.Surface pressure and particle image velocimetry (PIV) measurements were performed under various incident angles and different Re numbers. Significant reduction in lift and increase in drag were found for all cases with the LE roughness applied. Compared with the distribution pattern,the roughness height was found to be a more significant factor in determining the lift reduction and altering stall behaviors. It is also found while the larger roughness advances the aerodynamic stall, the smaller roughness tends to prevent deep stall at high incident angles. PIV results also suggest that staggered distribution pattern induces higher fluctuations in the wake flow than the aligned pattern does. Results imply that distributed LE roughness with large element sizes are particularly detrimental to aerodynamic performances, while those with small element sizes could potentially serve as a passive control mechanism to alleviate deep stall conditions at high incident angles.
Low-Reynolds-number airfoil may suffer significant performance degradation due to various harsh environmental conditions, such as ice, dirt, erosion, and insect debris accumulations.Under such conditions, distributed three-dimensional roughness elements often build up near the leading edge (LE) through either direct impingement [1] or flow-driven transportation [2].These small distributed disturbances were found to directly contribute to unfavorable aerodynamic conditions, such as early stall, decreased lift-to-drag ratio, and increased torque fluctuation for rotating blades in various industrial applications [3-7].In studies of turbulence transitions, it was found that distributed 3D roughness elements may lead to unique boundary-layertransition mechanisms [8-9], which are dramatically different from the commonly known Tollmein-Schlichting (T-S) instability over a smooth surface [10-11] or an amplified T-S instability over a simple two-dimensional roughness [12]. The altered fundamental mechanisms might cause unique and complex aerodynamic phenomena over low-Reynolds-number airfoils, which have not been fully understood yet. Particularly, at moderate to high incident angles, the adverse pressure gradient on a clean low-Re airfoils often gives rise to laminar separation bubbles [13]which accelerates the turbulence transition. The existence of distributed roughness could fundamentally change such flow behavior over the LE surface of low-Re airfoils.
The present study has been focused on revealing the flow behavior and aerodynamic loading over a GA(W)-1 airfoil with different distributed LE roughness at different Reynolds numbers,via a combined surface pressure and Particle Image Velocimetry measurement. Experiments were conducted in a closed-circuit low-speed wind tunnel with a 0.3 m × 0.3 m (1.0 ft × 1.0 ft) test section, in which a uniform flow was produced with turbulence intensity around 1%. Figure 1 shows the geometry and the pressure tap locations of the GA (W)-1 airfoil used in the present study. The GA (W)-1 airfoil, namely General Aviation (Whit-comb) -number one airfoil, has a maximum thickness of 17% at 40% chord and a maximum camber of 2.4% at 65% chord. It features a relatively large leading-edge radius, which enables a higher lift and a gentler stall characteristics comparing to NACA 65 series. In the present experiment, the test model has a chord length of 0.1 m and a spanwise width about 0.3 m (1.0 ft). The blockage ratio is less than 10% for all test cases. The airfoil model was equipped with 43 pressure taps covering the entire upper and lower surfaces at its median span. Measurements were conducted under 3 different Re numbers: 78000 (11 m/s), 169000 (24 m/s), 260000 (37 m/s).
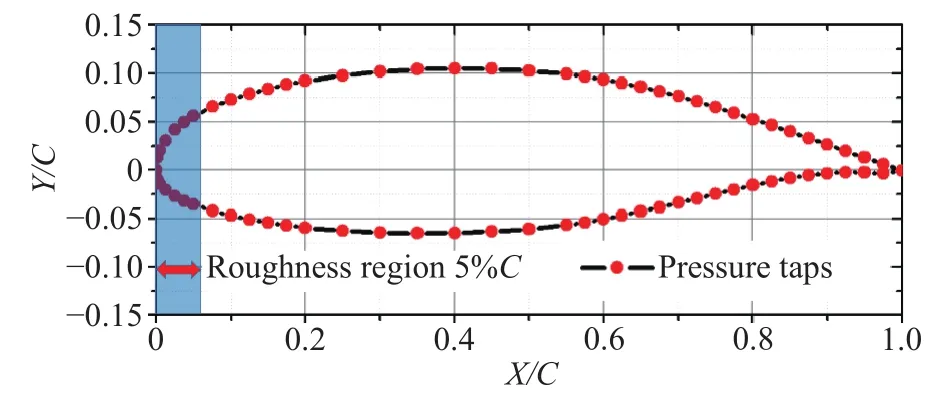
Fig. 1. Geometry of GA (W)-1 airfoil and pressure tap distributions.
The LE roughness was applied by using roughness tapes,which were precisely fabricated using a 3D prototyping machine. The detailed dimensions of the tapes are shown in Fig. 2.The tapes have a width of the span and are designed to cover 5%chord length from the leading edge on both upper and lower surfaces. The substrate of the roughness tape was made as thin as possible with maximum resolution of the 3D printer (~0.1 mm) to minimize the effect of the step on the surface. Two roughness heights (k) were considered, i.e. k=0.25 mm and k=0.5 mm, which result in a ratio of roughness height to the airfoil thickness of 0.015 and 0.03, respectively. These roughness sizes were selected based upon the consideration of relative length scale with respect to the local boundary layer thickness, which was estimated by the equation of turbulence boundary layer over a flat plate, i.ewhere x is the distance from the LE and Rexis the Reynolds number with x as its characteristic length. Under investigated Re conditions,is estimated to be 0.360 mm (for Re = 78000), 0.308 (for Re = 169000), and 0.283 (for Re = 260000) at 5% chord length location. In all cases,the two tested roughness sizes will cover two typical scenarios,i.e. elements were buried within and extruded through the boundary layer flow at X/C=0.05. Addiontally, the hemispherical or dome-shaped elements have diameters of 1 mm and are distributed in aligned and staggered patterns. The tapes were applied to the surface in such a way that the pressure taps are aligned with the centerline of a column of roughness
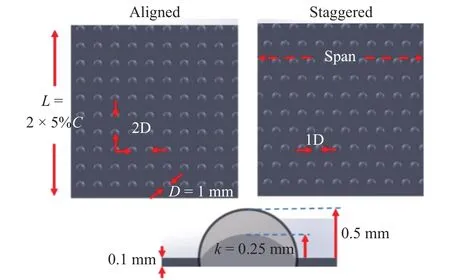
Fig. 2. Dimensions of distributed roughness patterns.
Surface pressure measurements were performed under 10 different angles of attack (AOA) from 0° to 18° for each Re number case. The pressure taps were connected to three 16-channel scanning pressure sensor array (Digital Sensor Array, module DSA3217, Scanivalve Corp) using plastic tubings. The DSA3217 module incorporate temperature compensated piezo-resistive pressure sensors with a pneumatic calibration valve, RAM, 16 bit A/D converter, and a microprocessor in a compact self-contained module. The precision of the pressure acquisition system is ± 0.2% of the full scale (± 10-in H2O). During the experiment,each pressure transducer input was scanned at 400 Hz for 20 seconds. The lift and drag coefficients, CLand CD, were determined by integrating the pressure distribution around the entire upper and lower surfaces. It should be noted that using this calculation method can lead to an underestimation of CDsince the frictional drag could not be represented by the pressure distribution. However, since pressure drag is dominant at higher AOA’s(near stall AOA’s), the uncertainty (~5% on average) is considered negligible for the purpose of the present study.
The flow fields were quantitatively studied for selected cases(Re=169000 at 12°, 14°, 15°, 16°, and 18°) using a standard planar PIV system shown in Fig. 3. The test airfoil was installed in the middle of the test section. A laser sheet was at the middle span of the airfoil formed along free stream direction. The flow was seeded with 1-5 μm oil droplets. Illumination was provided by a double-pulsed Nd:YAG laser (NewWave Gemini 200) adjusted on the second harmonic and emitting two laser pulses of 200 mJ at a wavelength of 532 nm with a repetition rate of 10 Hz. The laser beam was shaped to a laser sheet (thickness ~1 mm) by using a set of mirrors, spherical and cylindrical lenses. The laser sheet was formed on top of one row of the roughness elements in both aligned and staggered cases to get a typical results of a 2D plane. A high resolution (2048×2048 pixels, Cooke Corp.)charge-coupled device (CCD) camera was used for PIV image acquisition with its axis perpendicular to the laser sheet. The CCD camera and the double-pulsed Nd:YAG lasers were connected to a workstation via a digital delay generator, which controlled the timing of the laser illumination and the image acquisition. The CCD camera was focused to a measurement window of 138 mm (width) × 107 mm (height) in order to capture entire flow field around the airfoil. Instantaneous PIV velocity vectors were obtained by a frame to frame cross-correlation technique involving successive frames of patterns of particle images within an interrogation window with 32×32 pixels. An effective overlap of 50% was applied to satisfy the Nyquist criterion. After the instantaneous velocity vectors were determined, spanwise vorticity could be derived. The time-averaged quantities such as mean velocity and turbulent kinetic energy were obtained from 500 double-frame snapshots of instantaneous velocity fields for each case. The measurement uncertainty level for the velocity vectors is estimated to be within 2.0%, and that of the turbulent velocity fluctuations and turbulent kinetics energy are about 5.0%. The uncertainty level of the spanwise vorticity data is expected to be within 10.0%.
Pressure coefficients on both upper and lower surfaces of the airfoil are presented in Figs. 4 and 5 for clean and roughness cases, respectively. The pressure coefficient here is calculated aswhere P is the absolute pressure, P∞is the reference atmospheric pressure,is the air density, and Uinis the free-stream velocity. It is clear in Fig. 4 that a sudden collapse of suction peak occurred as the AOA increases from 16°to 18°, suggesting a deep stall occurs beyond 16° for the clean airfoil case. Meanwhile, it is well known that the laminar separation bubble could form on the GA(W)-1 airfoil under certain range of Re conditions, which is characterized by a three-stage flow development: laminar separation, transition, and turbulent flow reattachment [14]. Due to the static flow condition inside the bubble, the local pressure gradient drops to nearly zero,forming a “plateau” region on the envelope of pressure coefficients. Such phenomenon is observed for the clean airfoil case in Fig. 4. A region of laminar separation bubble is clearly shown by the plateau extended from the LE to X/C=0.1 with AOA at 12°,whose location moves upstream as AOA increases to 14°-16°.
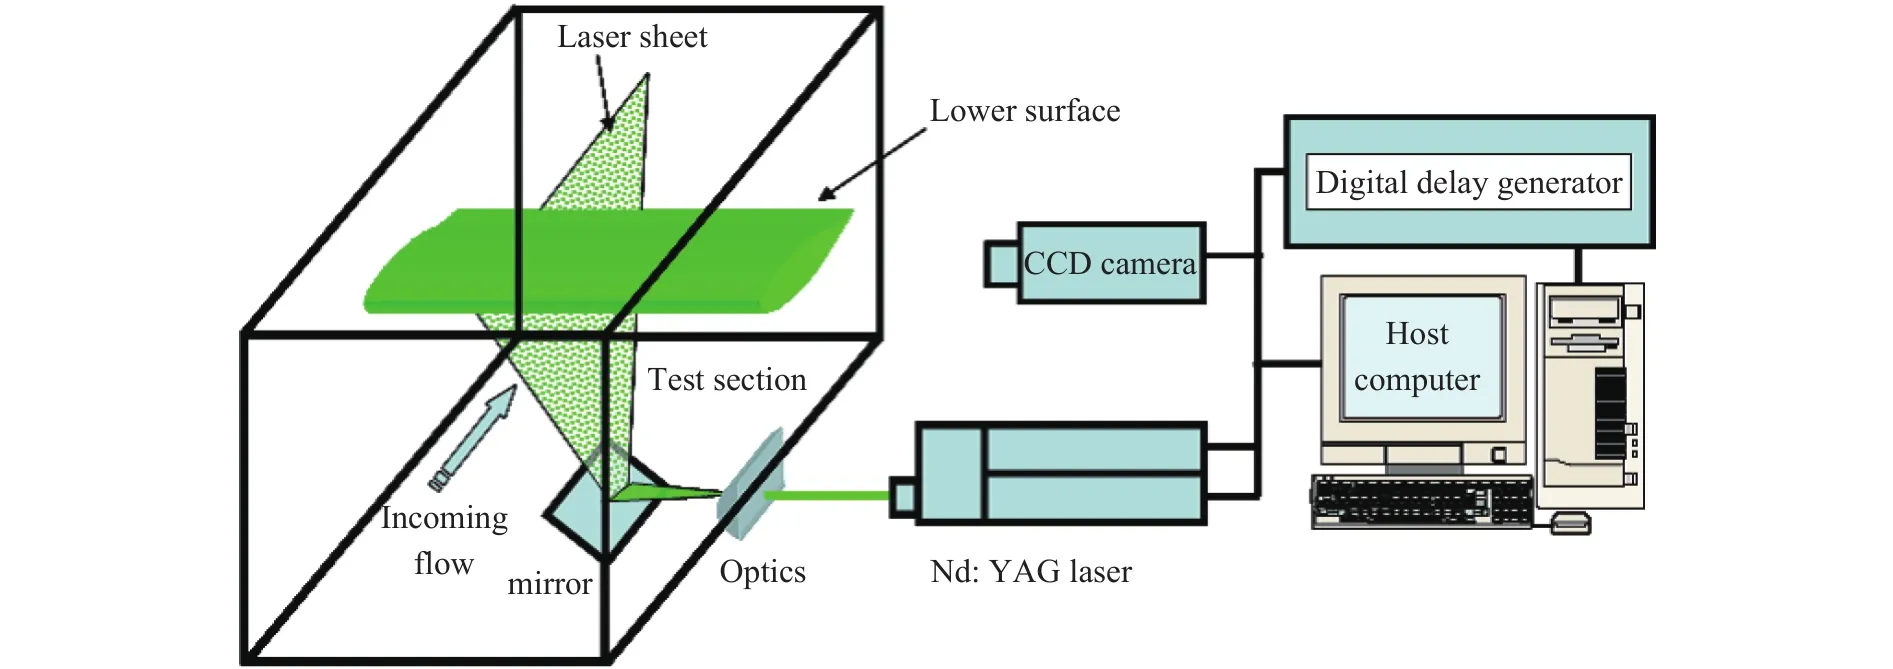
Fig. 3. Schematic of the PIV system.
Figure 5 shows the distributions of surface pressure coefficients for different LE roughness cases under the same AOA’s and Re numbers. The shaded areas in these figures represent the regions covered by the roughness tapes on the leading edge (5%chord length). Results indicate that the LE roughness brings several major modifications on the suction side (upper) surface,while it does not cause a dramatic difference on the pressure side (lower) surface. A significant reduction (~50%) in the suction pressure can be found for all roughness cases compared with the clean baseline. Different roughness sizes induced different stall behavior at high AOAs. For 0.25 mm roughness cases, it is clear that the suction pressure near the LE) still exists when the AOA increases from 12° to 18°, while for 0.5 mm roughness cases, the LE suction peak collapses earlier than the clean baseline case. The slopes of pressure coefficient curve following the roughness region are much milder for all roughness cases than that for the clean case. Evidenced by the clear differences between Figs. 4 and 5, it can be concluded that the roughness leads to an altered chordwise pressure recovery possibly induced by a different type of boundary layer transition other than the Kelvin-Helmholtz instability (through separation bubble)that are found for the clean airfoil case. It should be noted that the pressure coefficient within the roughness regions (X/C<0.05)may only imply the average pressure in one typical case due to the fixed pressure tap locations with respect to roughness elements. Although we assume the pressure variation within the roughness region is less of a concern considering the local roughness induced turbulence and the average of the data samples, further detailed studies are still needed to investigate the spatial homogeneity of the pressure distribution.
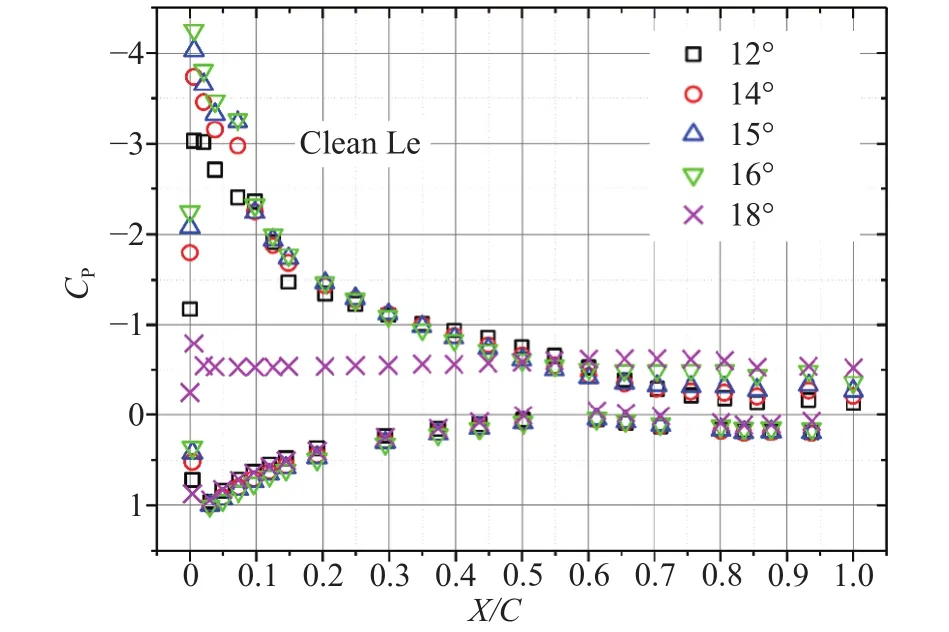
Fig. 4. Laminar separation bubble (at 12°) and the surface pressure coefficients for the clean airfoil at Re = 169000.
Lift and drag coefficients versus different AOA’s at different free-stream Re numbers are presented in Fig. 6. Lift and drag coefficients are defined asrespectively, where L and D are total lift and drag forces integrated from the pressure data,is the air density, C is the chord length, and U is the free stream velocity. It is clearly revealed that the leading edge roughness does have a great influence on the overall aerodynamic performance of the low-Reynolds-number airfoil. At Re = 78000, as shown in Fig. 6(a),a significant reduction in lift and increase in drag can be seen for all cases at pre-stall AOA’s regardless of the Reynolds number and the roughness pattern. Particularly, the maximum lift coefficient drops from 1.1 to about 0.9 (about 18%) in all four roughness cases. It is also notable that the 0.5 mm roughness causes a slightly larger lift reduction at AOA = 8° to 12° than the 0.25 mm roughness does. A substantial increase in drag was also found near the stall angles for all cases. Despite of the changes in lift and drag, the stall angle is not altered with the leading edge roughness applied. A leading-edge type stall, manifested by a sharp decrease in lift and increase in drag, occurs between AOA= 13° and 14° for all cases.
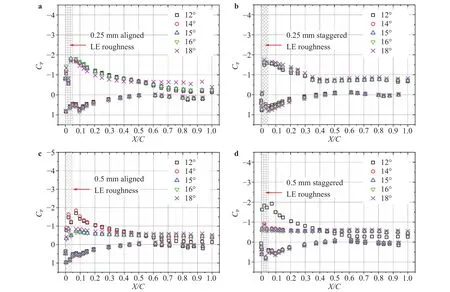
Fig. 5. Surface pressure coefficients for airfoils with distributed roughness at Re=169000.
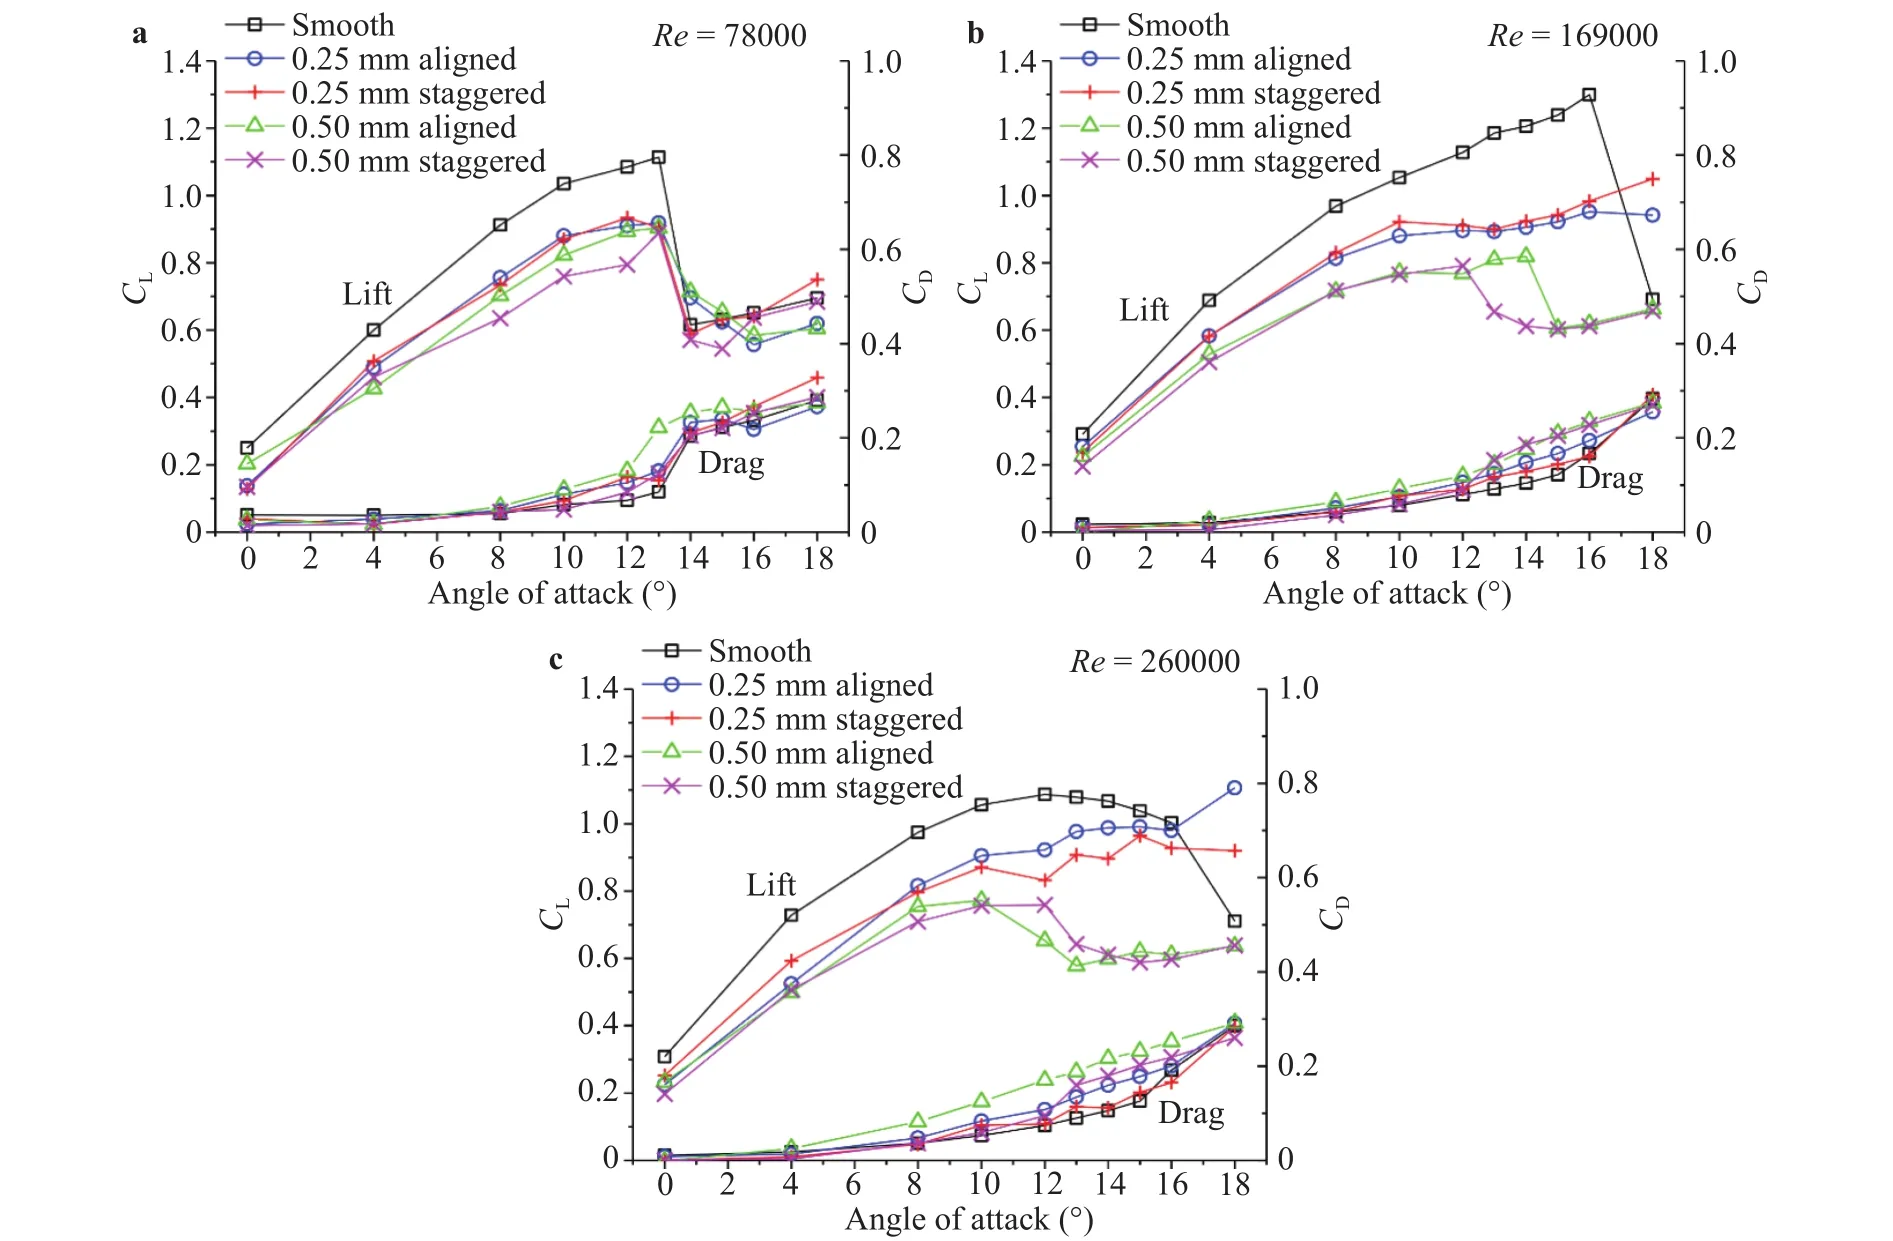
Fig. 6. Lift and drag coefficients for all tested cases.
When Re increases to 169000 (Fig. 6(b)), the maximum lift coefficient of the clean airfoil increases prominently to 1.3 and the stall was delayed to 16° compared with those at Re=78000.However, the effects of different LE roughness on the stall angle start to differentiate. First, it is clear that the 0.5 mm roughness causes more reduction in lift than the 0.25 mm roughness at prestall AOA’s. The difference between an aligned pattern and a staggered pattern in pre-stall conditions is minimal. Second,completely different stall behaviors are seen for the 0.25 mm and 0.5 mm roughness cases. The 0.5 mm roughness induces a much earlier stall than the clean airfoil. However, for the 0.25 mm roughness models, a continuously increasing lift coefficient curve can be seen. This suggests that deep stall does not occur up to 18° with the existence of 0.25 roughness. It is also seen that the stall angle or lift/drag curves for the aligned and staggered roughness patterns are slightly different, for which the underlying mechanism is still unclear. At Re = 260000 (Fig. 6(c)),changes in lift and drag coefficients become milder for the clean case, indicating a trailing edge stall, instead of abrupt leading edge stall, occurs at this Re condition. Roughness induces similar changes compared with those found in the previous Re case.Significant performance degradation could be seen for all roughness cases. While the 0.5 mm roughness triggers earlier stall, the lift coefficient for the 0.25 mm roughness case keeps increasing up to AOA as 18°.
In sum, all tested LE roughness patterns exhibit profound negative impacts on the aerodynamic performance of the GA(W)-1 airfoil at pre-stall AOA’s, and different sizes of distributed roughness lead to distinct results of stall behaviors at higher AOA’s. Evidence implies that while the larger roughness acts to trigger early leading-edge stall, the smaller roughness helps prevent deep stall at high AOA’s. The discrepancy in stall behaviors could be due to different boundary layer-roughness interactions induced by the two roughness cases. Apparently, a larger adverse pressure gradient near the LE has been generated at a prestall high AOA by the 0.5 mm distributed roughness (Fig. 5, 12°cases). However, to fully explain the underlying mechanism, a detailed research into the boundary layer flow using high temporal-resolution methods should be performed.
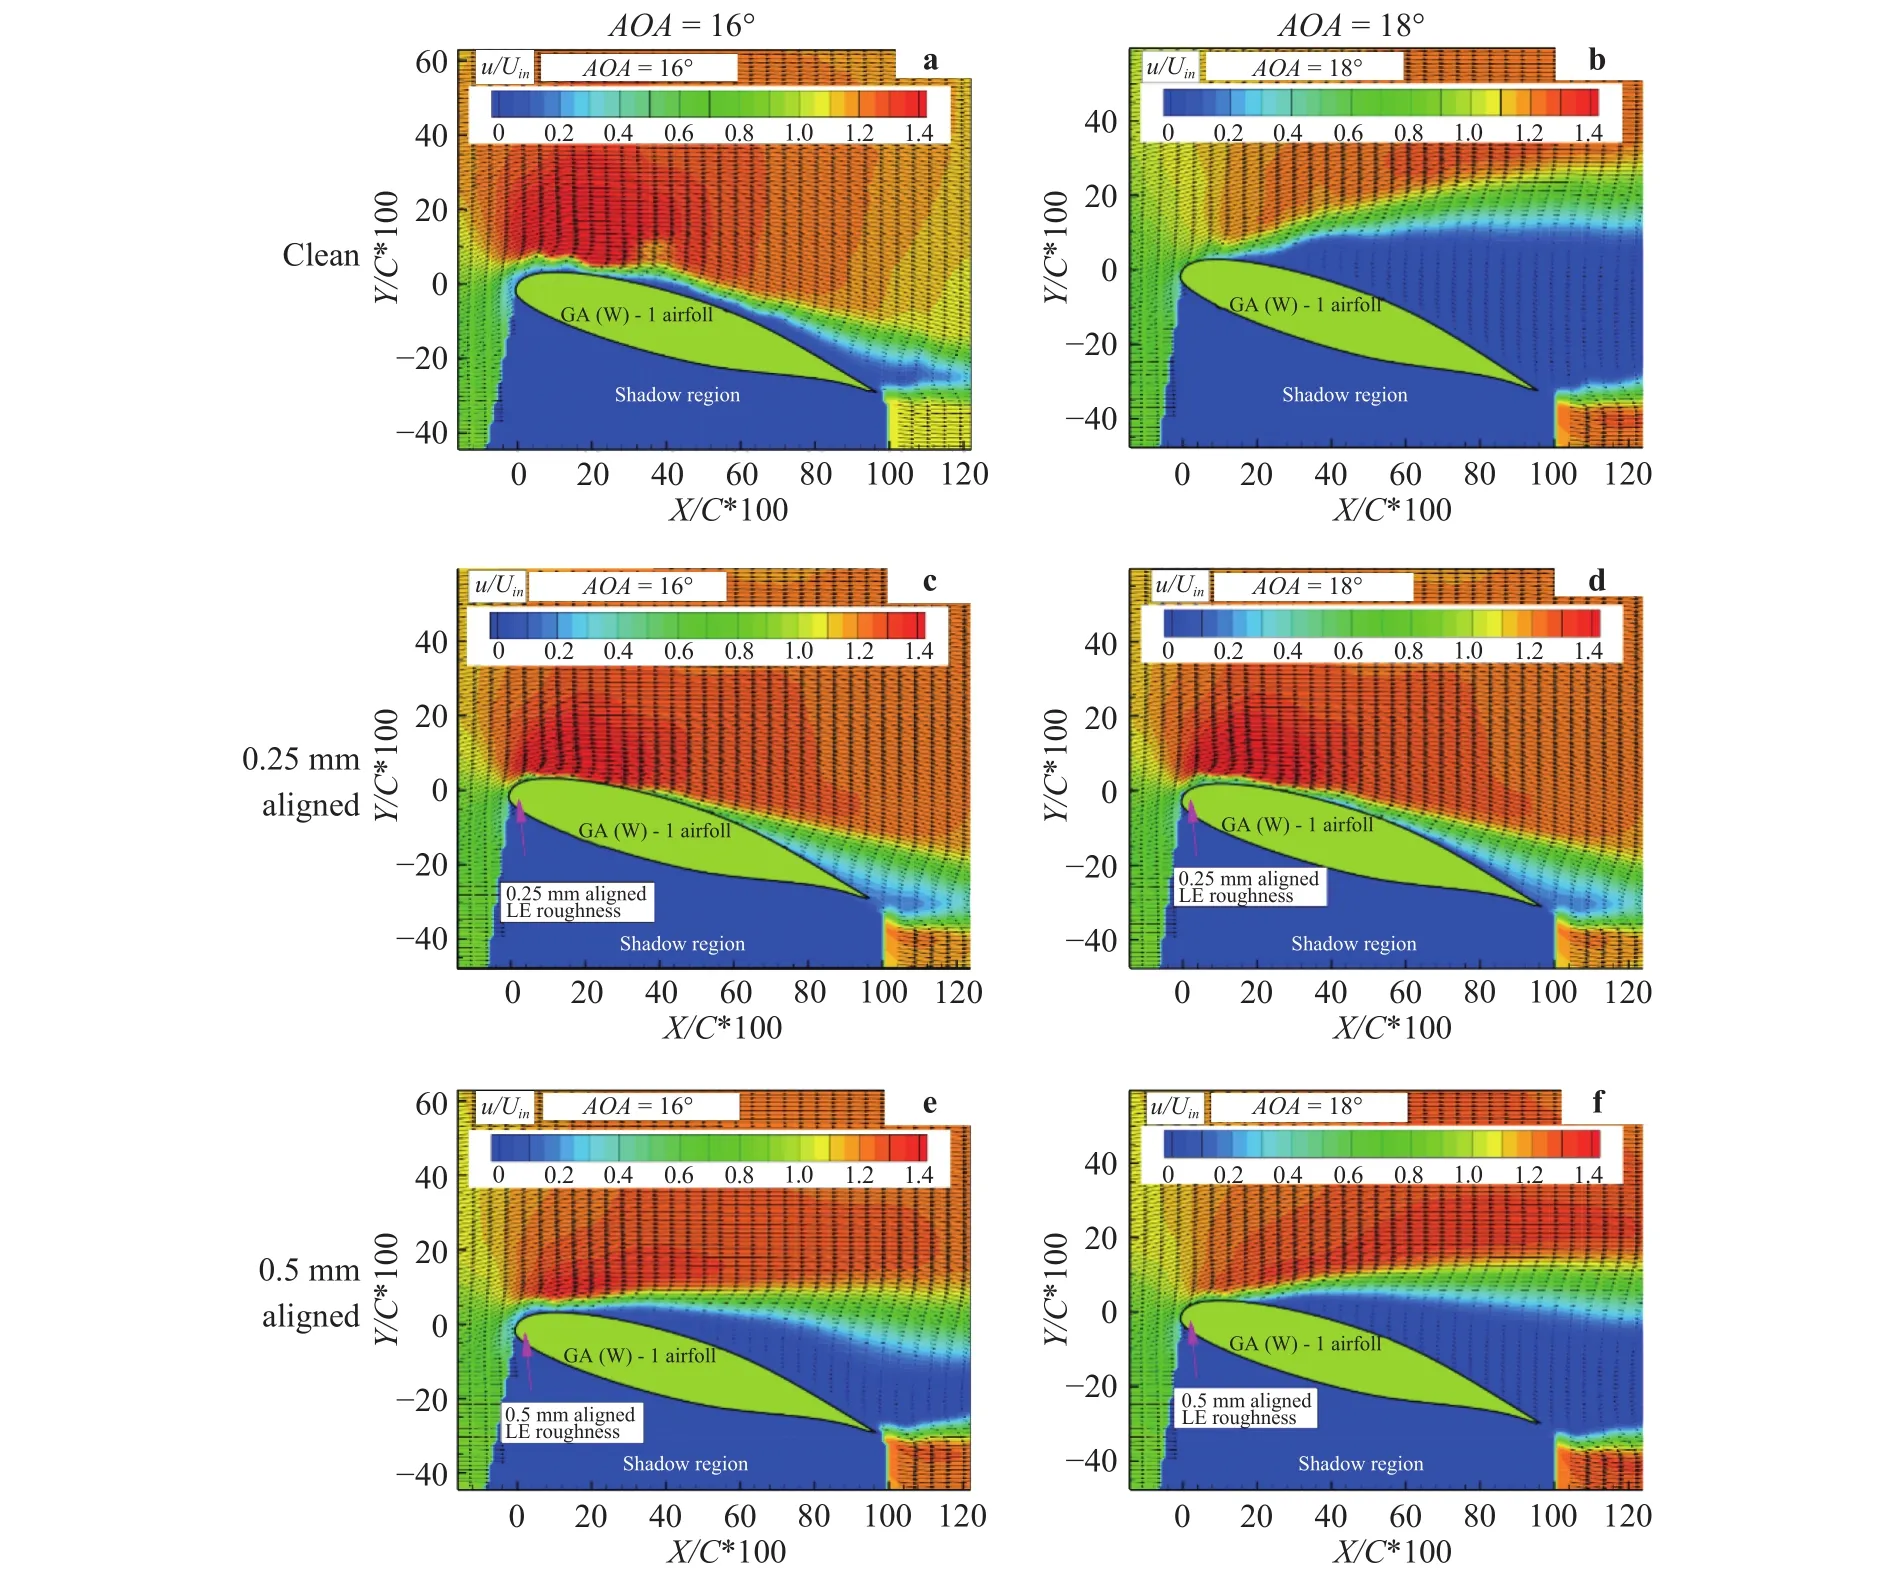
Fig. 7. Ensemble-averaged velocity for selected cases in pre- and post-stall conditions at 16° and 18°.
The different stall behaviors are also demonstrated through the quantitative flow visualizations. Figure 7 shows the contours of ensemble-averaged horizontal velocity over the suction side of the airfoil surface. Only selected cases, i.e. clean, 0.25 mm roughness, 0.5 mm roughness at 16° and 18° at Re = 169000, are given here to demonstrate the dramatically different roughnessinduced stall behaviors. It is clear from Fig. 7(a) and 7(b) that a sharp LE-type separation occurs when the AOA is increased from 16° to 18°. For the 0.25 mm roughness case (aligned pattern), as shown in Fig. 7(c) and 7(d), the averaged flow remains well attached up to 30% chord length from the LE at both 16° and 18°, which explains the elimination of deep stall suggested by the lift coefficient curve in Fig. 6(b). It could also be seen that the wake region at 18° is larger than that at 16 deg., indicating an expansion of turbulent flow separation from the trailing edge which is responsible for the increase of the drag. In stark contrast to the previous two cases, stall is already developed at AOA=16° for the 0.5 mm roughness case (aligned) and becomes more developed at AOA =18° as shown in Fig. 7(e) and 7(f). The staggered-pattern cases trigger similar average flow fields at near-stall AOA’s and are not shown here for brevity.
As above-mentioned, the distribution pattern (aligned vs.staggered) of the LE roughness is found to be a secondary factor compared with the roughness size in changing the average liftdrag curves and the stall characteristics. However, the distribution pattern does affect the unsteady characteristics of the wake flow after the LE roughness. In Fig. 8, the turbulence kinetic energy (TKE) of the flow fields around different roughness LE airfoils are compared at AOA=18°. TKE is defined here as normalized standard deviation of the two-dimensional velocity components in ensemble image collections, instead of in the continuous time domain, i.e.u’ and v’ are the fluctuating components of horizontal and vertical velocities, and Uinis the mean free-stream velocity. It is clear from the comparison that for both 0.25 mm and 0.5 mm roughness, the staggered distribution pattern introduces higher TKE in the wake region than their aligned counterparts, although they are at the same Re and AOA conditions. The higher TKE is associated with a stronger low-frequency wandering motion of the separated shear layer and the shedding vortices. One hypothesis related to the stronger instability of the separately shear layer is that the asymmetry spanwise distribution of roughness element may cause stronger fluctuations. However, further experiments are still needed to verify the hypothesis by revealing the three dimensional time-resolved near-wall flow structures.
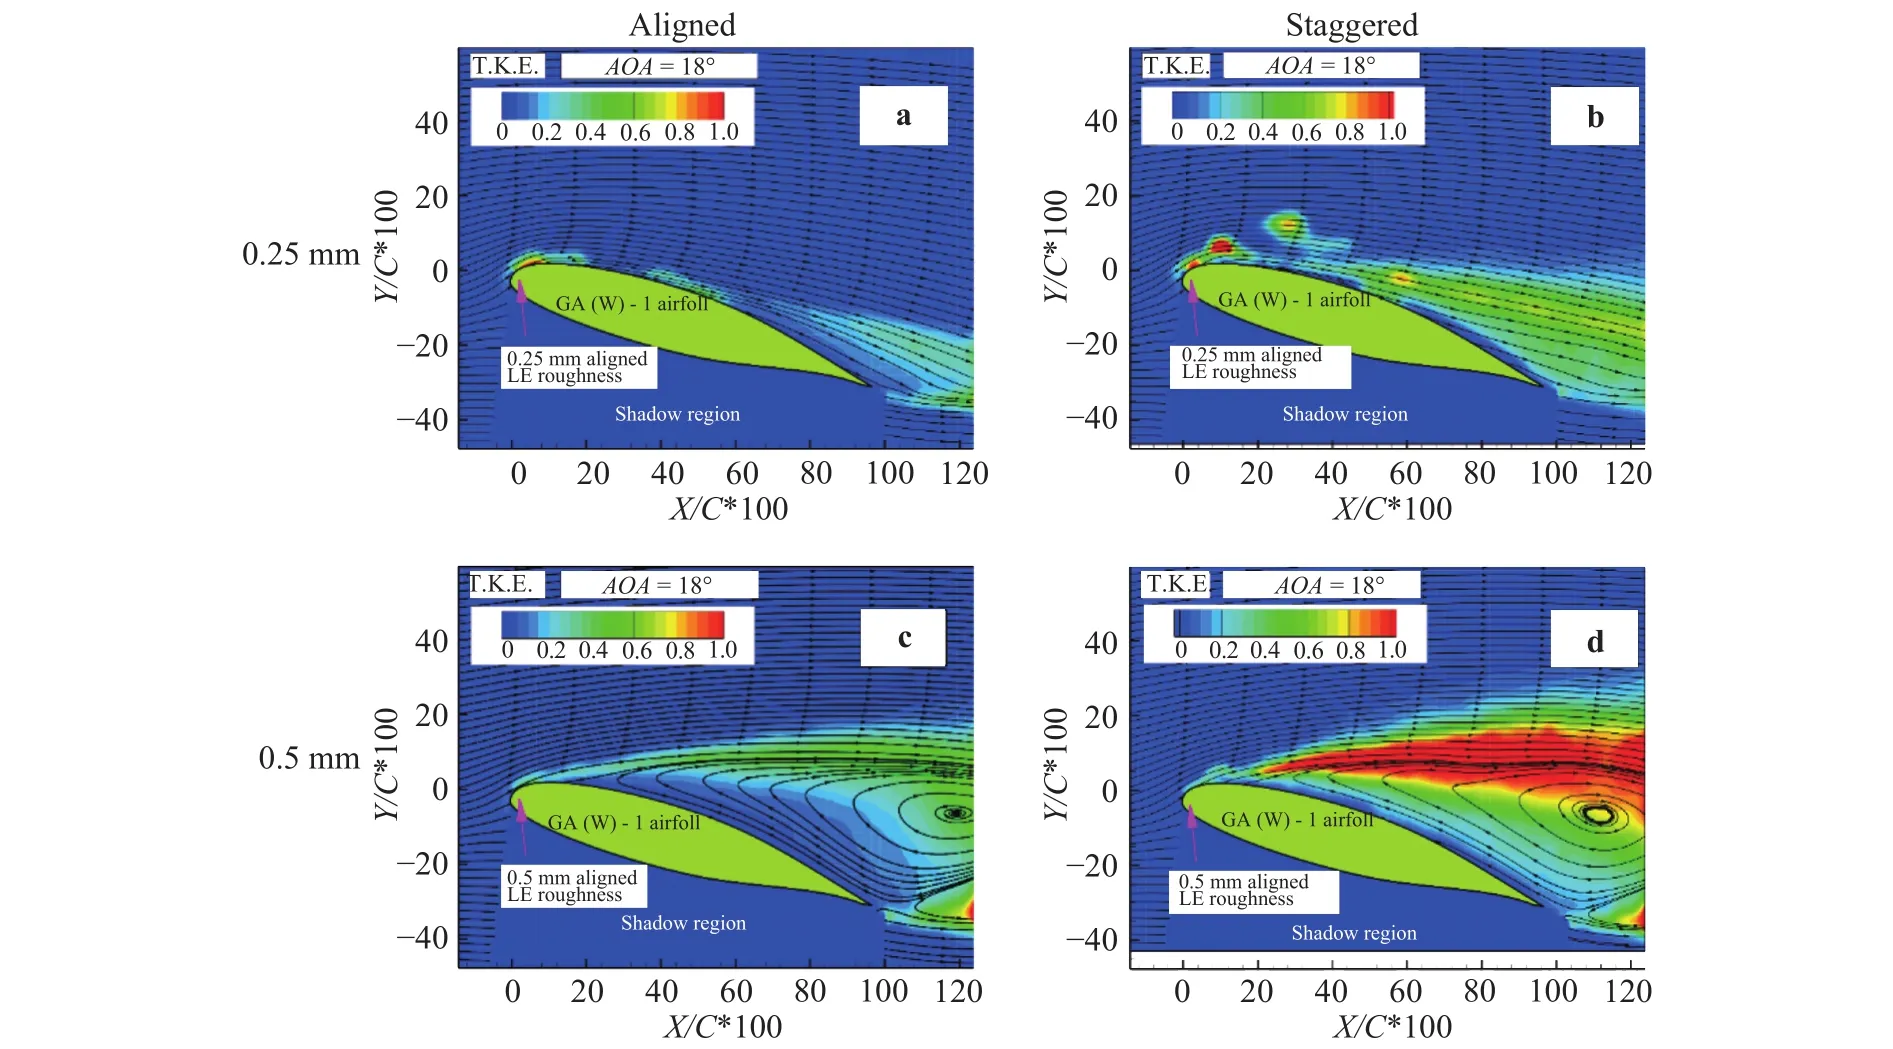
Fig. 8. Comparison of two-dimensional turbulence kinetic energy for aligned and staggered patterns at 18°.
In sum, the effect of distributed leading edge roughness on the flow field and the surface pressure distribution of a typical low-Reynolds number airfoil has been investigated. Some of the major findings are 1) The presence of LE roughness, regardless of size and distribution, results in a significant reduction (~50%)in the peak suction pressure and maximum lift coefficient; 2) larger-size roughness causes more reduction, particularly at higher Reynolds number; 3) compared with the clean airfoil case, the 0.5 mm roughness case tends to advance aerodynamic stall, but the 0.25 mm roughness prevents deep stall up to 18°; 3) a staggered LE roughness distribution pattern is found to trigger stronger turbulent kinetic energy in the wake flow. Results imply that small distributed roughness can be detrimental to the power efficiency of an aerodynamic blade working under low Reynolds number conditions. Meanwhile, it is also interesting to see that the small distributed LE roughness could also potentially alleviate deep stall conditions at high angles-of-attack, which might be useful in certain passive flow control applications.
 Theoretical & Applied Mechanics Letters2018年3期
- Theoretical & Applied Mechanics Letters的其它文章
- Triangular temporal-distribution law for disintegrating internal solitons over a step
- A three-dimensional immersed boundary method for non-Newtonian fluids
- Nonlinear thermo-structural behavior of sandwich panels with truss cores under through-thickness gradient temperature field
- Numerical investigation on convective heat transfer over two heated wall-mounted cubes in tandem and staggered arrangement
- Achieving thermal magnification by using effective thermal conductivity
- Wave reflection in semiconductor nanostructures