水電站下游魚類產(chǎn)卵場水溫的人工神經(jīng)網(wǎng)絡預報模型
2018-03-09 05:29:48柳海濤孫雙科鄭鐵剛李廣寧
農(nóng)業(yè)工程學報 2018年4期
關鍵詞:模型
柳海濤,孫雙科,鄭鐵剛,李廣寧
?
水電站下游魚類產(chǎn)卵場水溫的人工神經(jīng)網(wǎng)絡預報模型
柳海濤,孫雙科,鄭鐵剛,李廣寧
(流域水循環(huán)模擬與調(diào)控國家重點實驗室,中國水利水電科學研究院,北京 100038)
豐滿電站下游松花江水文站河段分布有一系列魚類產(chǎn)卵場,電站擬通過分層取水調(diào)控下泄水溫,改善下游魚類生存環(huán)境。該文基于大量實測數(shù)據(jù)分析,建立了松花江站水溫的人工神經(jīng)網(wǎng)絡預報模型,通過輸入上游吉林水文站的水溫與流量,以及地區(qū)氣象條件,可計算出下游松花江站2日后的水溫變化。根據(jù)中長期天氣預報數(shù)據(jù)與電站泄流計劃,采用該模型通過2日遞推的方法,可預測出下游魚類產(chǎn)卵場的水溫變化過程。運用2006-2013年實測數(shù)據(jù)對網(wǎng)絡模型進行訓練,然后對2014年松花江站水溫變化過程進行計算,計算值與實測值的變化過程甚為吻合,相關系數(shù)為0.992,水溫平均誤差為0.51 ℃。在水溫生態(tài)調(diào)度運行期間,根據(jù)產(chǎn)卵場水溫變化的預報數(shù)據(jù),可適當調(diào)控電站下泄水溫,保持適宜的魚類產(chǎn)卵條件。
模型;水文;魚;水電站;生態(tài)調(diào)度;產(chǎn)卵場;水溫;人工神經(jīng)網(wǎng)絡
0 引 言
大型水庫在確保興利目標的同時,通過合理的生態(tài)環(huán)境調(diào)度,可以補償水庫對河流生態(tài)系統(tǒng)的不利影響[1-2]。從工程實踐的角度來看,水庫生態(tài)環(huán)境調(diào)度的主要內(nèi)容包括:維持確保下游河道生態(tài)蓄水量[3-4],創(chuàng)造生態(tài)洪水脈沖[5-6];改善下游河道水體水質(zhì),提高下游河道自凈能力[7];通過選擇性取水,緩解低溫水下泄的不利影響[8];通過機械與建筑設施,改變水庫下泄水流的溶解氧濃度,改善下游生態(tài)環(huán)境等[9]。其中,在水溫生態(tài)調(diào)度方面,主要研究內(nèi)容包括:通過對下游河段進行生態(tài)調(diào)查與分析,結合興利目標確定合理的人造洪峰過程[10];然后通過數(shù)學模型與物理模型試驗的手段[11-12],確定庫區(qū)水溫分層及泄水調(diào)度方式與下泄水溫的對應關系;通過原型觀測資料分析,確定水庫下泄水溫與下游長距離河道水溫之間的關系[13]。通過上述研究,制定合理的水溫生態(tài)調(diào)度方案,減輕水庫低溫水下泄對下游河道生態(tài)系統(tǒng)的不利影響。
吉林豐滿電站水庫為水溫分層型水庫,目前正在實施全面治理(重建)工程,其中上游120 m處舊壩被部分保留,形成前置擋墻,以提取表層溫水,同時左岸原有三期電廠提取深層冷水,通過改變引水比例,實現(xiàn)調(diào)控下泄水溫的功能。工程完建后,在下游魚類繁殖季節(jié),擬通過合理的運行調(diào)度,形成一定歷時的漲水-升溫過程,促進當?shù)佤~類生長。為此,本文通過研究水庫運行調(diào)度對下游魚類產(chǎn)卵場水溫的影響,建立相關的水溫實時預報模型,用以調(diào)控下泄水溫,保持適宜的魚類生長環(huán)境。
目前對于河流水文條件的預測方法主要有3類,第1類是采用統(tǒng)計分析的方法,建立預測因子與目標因子的相關關系[14-17],該類方法計算簡便,對實測資料要求較低,可用于河流水文條件的實時預報,不足之處在于其無法考慮包含多個預測因子的復雜非線性問題。第2類是采用數(shù)學模型進行預報的方法,通過建立研究對象的數(shù)學模型[18-20],對目標因子進行預測計算。該類方法計算精度高,物理意義明確,能夠精確描述目標因子的變化規(guī)律,預測時間序列可以精確到數(shù)小時甚至分鐘。不足之處在于,對實測水文氣象數(shù)據(jù)要求較高,同時運算復雜,需要事先通過大量計算,形成相應的數(shù)據(jù)庫,然后由調(diào)度系統(tǒng)根據(jù)實際條件插值求解目標因子,如此又會產(chǎn)生新的誤差[21]。第3類是采用人工神經(jīng)網(wǎng)絡進行預測的方法[22-26],該方法通過網(wǎng)絡模型對實測數(shù)據(jù)進行學習,可以模擬多個預測因子之間的相互作用對目標因子的影響,模型運算速度較快,可以被水庫調(diào)度系統(tǒng)實時調(diào)用。不足之處在于,隨著問題復雜性增加,網(wǎng)絡學習過程難度也會加大,此時需要對網(wǎng)絡結構與學習算法進行分析與優(yōu)化[27-28]。
鑒于神經(jīng)網(wǎng)絡在快速模擬復雜非線性問題方面的優(yōu)勢,本文擬采用人工神經(jīng)網(wǎng)絡,對松花江站水溫進行預報。通過相關性分析確定影響松花江站水溫的外部水文氣象因子;分析建立反映水溫變化機理的基本表達形式,由此確定網(wǎng)絡模型的預測因子與目標因子;通過對實測數(shù)據(jù)資料進行分析與學習,確定網(wǎng)絡預報模型的基本結構與學習矩陣;最后,針對網(wǎng)絡預報模型的精度與適應性進行驗證,為進一步實際應用打下基礎。
1 研究區(qū)域概況
豐滿電站庫首、下游水文站及魚類產(chǎn)卵場的位置見見圖1。下泄水流經(jīng)過摻混先到達20 km處吉林水文站,然后流經(jīng)160 km的河段,到達下游松花江水文站,該站附近分布有龍王廟、榆樹十八盤、飲馬河口等主要魚類產(chǎn)卵場。
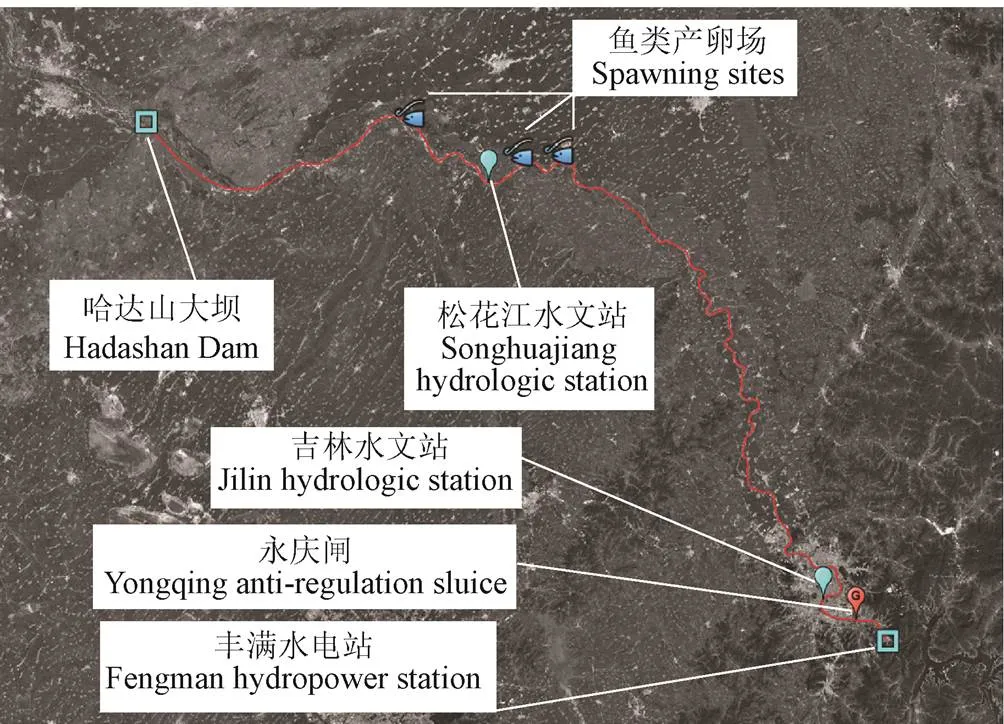
圖1 研究區(qū)域概況圖
通過分析豐滿電站、吉林水文站與松花江水文站的水溫實測資料,發(fā)現(xiàn)電站下泄水溫與吉林站水溫之間具有較強的相關性,并已建立經(jīng)驗關系來預測未來吉林站水溫變化,而對于吉林站至松花江站之間河段,兩者水溫相關性較差。究其原因在于,該段河道水流歷時較長,水體與周邊環(huán)境進行熱交換,至產(chǎn)卵場時水溫發(fā)生顯著改變。因此,需要根據(jù)流域水文氣象資料,對下游松花江站水溫進行實時預測。
2 水文與氣象資料分析
2.1 松花江站水溫的外部影響因子
根據(jù)水文部門提供的資料,針對下游魚類繁殖季節(jié),整理得到吉林站與松花江站在2006-2014年份5?8月的水溫-流量逐日數(shù)據(jù)。對于該區(qū)域氣象資料,則采用國家氣象局數(shù)據(jù)中心提供的長春國家基準氣候站的逐日氣象資料,參考變量包括平均氣壓、氣溫、相對濕度,以及平均風速、最大風速、最大風速風向、日照時數(shù)等。限于篇幅,具體數(shù)據(jù)這里不再列出。
表1為各種外部影響因子與下游松花江水文站水溫的相關性分析結果。其中,吉林站水溫、長春站平均氣溫、相對濕度、日照時數(shù)等4個變量與松花江站水溫之間呈正比關系,而吉林站流量、長春站風速與松花江站水溫呈反比關系。一般地,相關系數(shù)絕對值0.1~0.3被認為弱相關[29],從表中計算結果來看,吉林站水溫,吉林站流量,長春站平均氣溫、相對濕度、平均風速的相關系數(shù)均大于0.3。長春站日照時數(shù)的相關系數(shù)平均值為0.219,但在部分年份達到或超過了0.3,故予以保留。長春站氣壓與最大風速的相關系數(shù)明顯小于0.3,故略去不計。由此確定了6個影響松花江站水溫的外部因子,分別為吉林站水溫,吉林站流量,長春站平均氣溫、相對濕度、平均風速和日照時數(shù)。

表1 外部影響因子與松花江站水溫之間的相關系數(shù)
2.2 松花江站水溫預報的預見期分析
吉林站與松花江站相距約160 km,根據(jù)河道生態(tài)流量估算,下泄水流從吉林站到達松花江站需要1-3日。圖2為2010年5-8月兩站流量逐日變化過程線。由圖2可知,吉林站與松花江站流量過程線不重合,若將松花江站流量采用推后2日數(shù)據(jù),則兩站的變化規(guī)律基本吻合。進一步對比分析其余年份水文資料,同樣表明松花江站的水文因子相對吉林站均存在2日左右的預見期。因此在水溫預報模型中各變量均具有時間屬性。
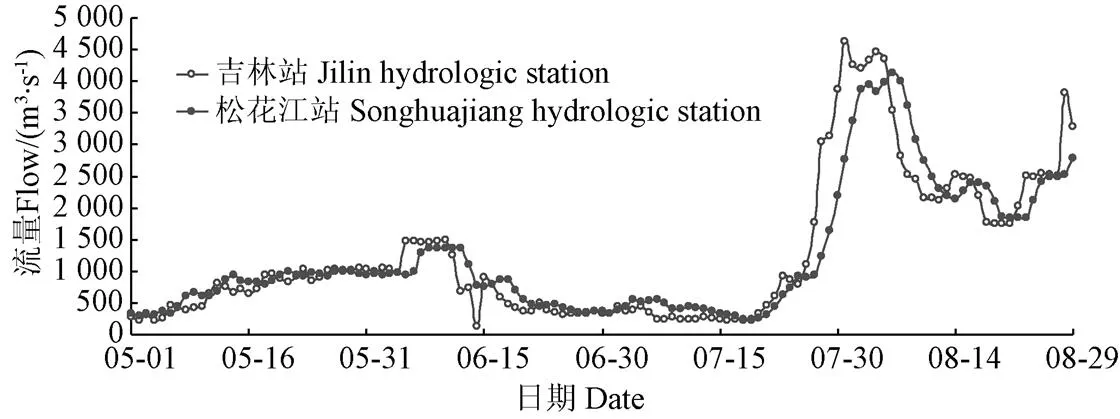
圖2 2010年5?8月吉林站與松花江站同日流量過程
2.3 水溫預報模型的基本物理關系
在松花江水文站水溫預報過程中,需要考慮上游吉林站水文條件、水流沿程與外界的熱交換,以及松花江站本地初始水溫等影響因素。由此可建立松花江站水溫變化的基本物理關系

式(1)為一個2日遞推公式,反映了計算時段內(nèi)水文與氣象條件對于松花江站水溫變化的影響。將式(1)右端7個參數(shù)作為神經(jīng)網(wǎng)絡模型的預測因子,將松花江站2日水溫差作為目標因子,構建實測數(shù)據(jù)樣本,對神經(jīng)網(wǎng)絡進行學習與驗證,從而建立起松花江站水溫預報模型。
3 水溫預報的人工神經(jīng)網(wǎng)絡
3.1 神經(jīng)網(wǎng)絡基本結構
目前用于模擬多維非線性系統(tǒng)的神經(jīng)網(wǎng)絡,主要有BP網(wǎng)絡和RBF(radial basis function)網(wǎng)絡,其中BP網(wǎng)絡在學習過程中采用全局逼近的方法,因此具有較好的泛化能力,即當預測數(shù)據(jù)超出學習范圍時,該網(wǎng)絡模型仍能得到合理的結果。然而,該網(wǎng)絡面對包含較多數(shù)據(jù)誤差的非線性問題時,學習能力不足,甚至無法收斂。相比而言,RBF網(wǎng)絡在學習過程中采用局部逼近的方法,對于各種復雜非線性問題,具有較好的學習能力,但其泛化能力有所不足,因此,需對學習后的網(wǎng)絡模型進行檢驗,或者通過改進神經(jīng)元激發(fā)函數(shù),以提高其泛化能力[30]。
本項研究中,實測水文與氣象資料均包含較多數(shù)據(jù)誤差,故采用RBF神經(jīng)網(wǎng)絡進行研究。通用RBF網(wǎng)絡的基本結構如圖3所示,其預測因子數(shù)和目標因子數(shù)可根據(jù)實際問題的因子分析進行調(diào)整,隱含層中的神經(jīng)元個數(shù)可通過樣本數(shù)據(jù)的學習加以確定。
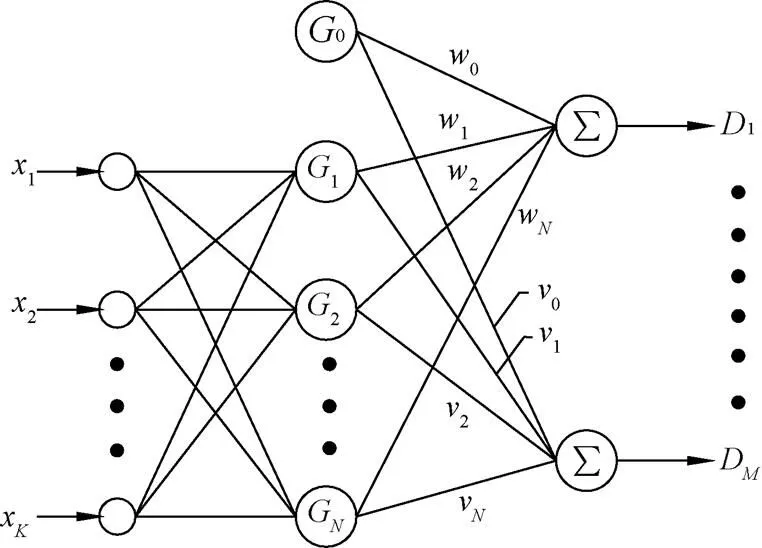
注: 為預測因子;為神經(jīng)元激發(fā)函數(shù);為目標因子;與為加權系數(shù)。
由式(1)可知,松花江站水溫預報模型的預測因子數(shù)為7個,目標因子數(shù)為1個,則輸入樣本數(shù)據(jù)的神經(jīng)元激發(fā)函數(shù)可表示為
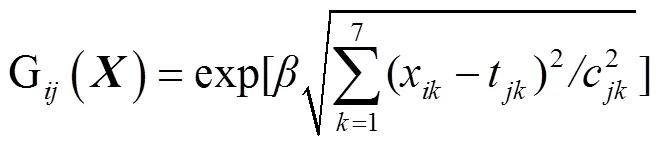

這樣,網(wǎng)絡的目標因子可以用下式表示
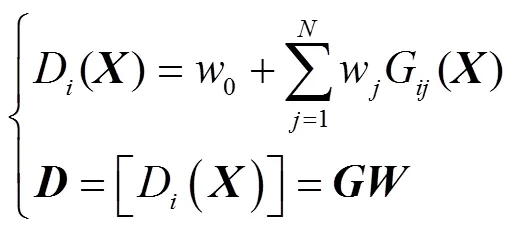
式中為樣本編號,為加權系數(shù)向量。由于樣本的目標因子已知,當隱含層的神經(jīng)元激發(fā)函數(shù)矩陣確定后,由式(3)可以得到線性輸出層的權向量
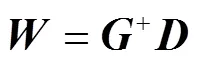
式中d和D分別是第組樣本的目標值和對應的網(wǎng)絡計算值。
3.2 神經(jīng)網(wǎng)絡的學習與模型預報方法
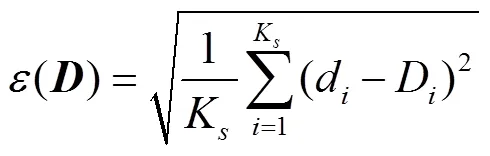
由于樣本點數(shù)據(jù)分布復雜且數(shù)值噪聲較大,采用傳統(tǒng)的聚類方法無法區(qū)分噪聲、邊界點和核心對象,同時依靠經(jīng)驗人為指定神經(jīng)元的個數(shù)也有一定困難。對此,本文采用的辦法是先從任一神經(jīng)元開始訓練,對比其網(wǎng)絡計算值D與樣本目標值d之間的絕對誤差,然后將產(chǎn)生最大誤差值的樣本輸入向量x作為新的神經(jīng)元中心t,重新學習并判斷式(5)中的誤差函數(shù)值是否小于目標誤差,如不滿足,則繼續(xù)增加新的神經(jīng)元,直到滿足誤差要求或達到最大神經(jīng)元數(shù)為止。計算過程中,神經(jīng)元的鄰閾值可取實測數(shù)據(jù)的最大分布范圍。為便于移植,采用FORTRAN語言編碼。
4 神經(jīng)網(wǎng)絡模型水溫預報結果分析
4.1 神經(jīng)網(wǎng)絡預報模型計算驗證
將2006-2013年5-8月的吉林水文站當日水溫、流量,長春站次日平均氣象條件,松花江站同日水溫差等7個預報參數(shù)作為樣本預測向量,將松花江站2日水溫差值作為樣本目標向量,對神經(jīng)網(wǎng)絡進行訓練,學習過程的水溫平均收斂誤差為0.1 ℃。然后,運用訓練后的網(wǎng)絡模型,采用2日遞推的方法,對2014年5-8月松花江站水溫變化過程進行預報。具體方法如下:從5月1日與2日開始,根據(jù)吉林站的當日水溫流量、長春站次日氣象數(shù)據(jù)、松花江站當日水溫差,分別預報得到松花江水文站5月3日與4日的水溫差,并得到相應的水溫絕對值,然后以此為初始水溫,重復上述計算,進一步計算得到松花江站5月5日與6日的水溫差及絕對值,以此遞推…,可得到5-8月整個時段內(nèi)松花江站水溫的變化過程,具體計算結果參見圖4。
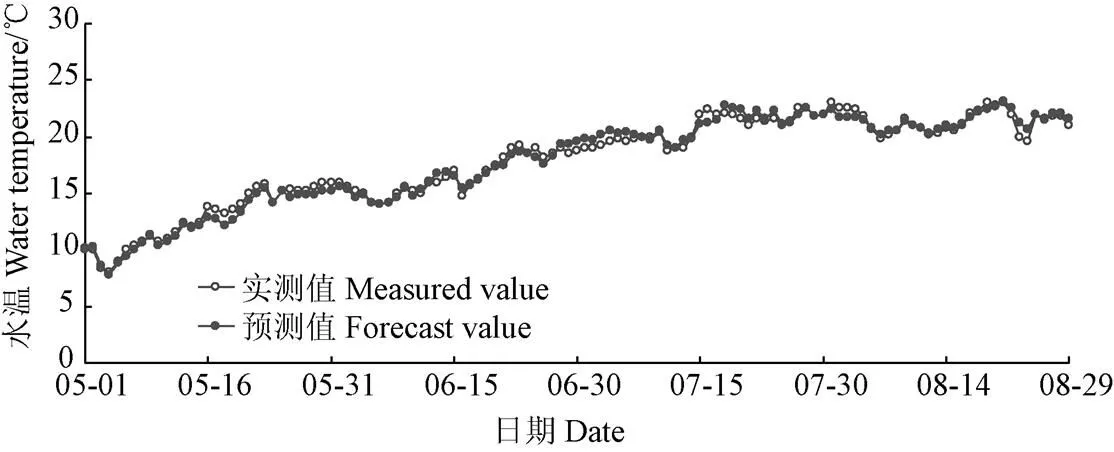
圖4 2014年5-8月松花江站水溫變化過程的實測值與預測值對比
由于神經(jīng)網(wǎng)絡模型采用2日遞推的方法,推求產(chǎn)卵場的水溫變化過程,如果神經(jīng)網(wǎng)絡模型不能正確計算水流沿程熱交換影響,則隨著時間的推移,水溫預報誤差逐漸累積,將會產(chǎn)生巨大的偏差。從圖4中計算結果可知,在推求長時間序列水溫變化過程中,本文模型顯示出了良好的收斂性。水溫實測值與預測值的相關關系繪制于圖5。計算表明,兩者相關系數(shù)達到0.992,水溫均方誤差為0.51 ℃,相對誤差小于8%,表明本文模型在計算精度上可以滿足水庫實時調(diào)度的要求。
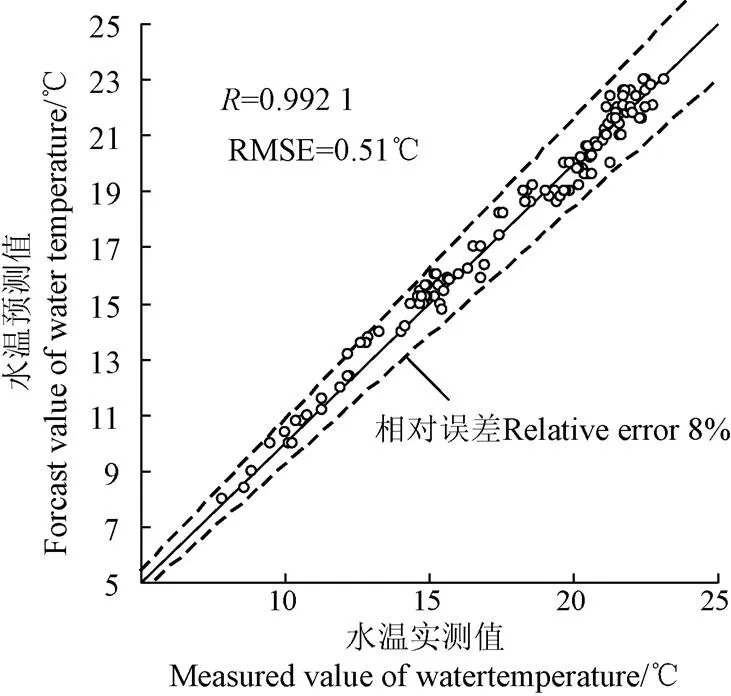
圖5 2014年5-8月松花江站水溫實測值與預測值對應關系
4.2 神經(jīng)網(wǎng)絡預報模型應用分析
以2011年5-8月的水文氣象條件為例,吉林站與松花江站的現(xiàn)狀水溫逐日平均變化過程見圖6a。分析表明,5-8月松花江站水溫較之吉林站平均升高約4.6 ℃。根據(jù)豐滿電站重建工程分層取水的水溫研究成果[31],通過分層取水調(diào)控下泄水溫,5-8月份吉林站水溫較之現(xiàn)狀可整體升高3.2 ℃。上述條件下,采用神經(jīng)網(wǎng)絡預報模型,計算得到松花江站的水溫變化過程見圖6b。
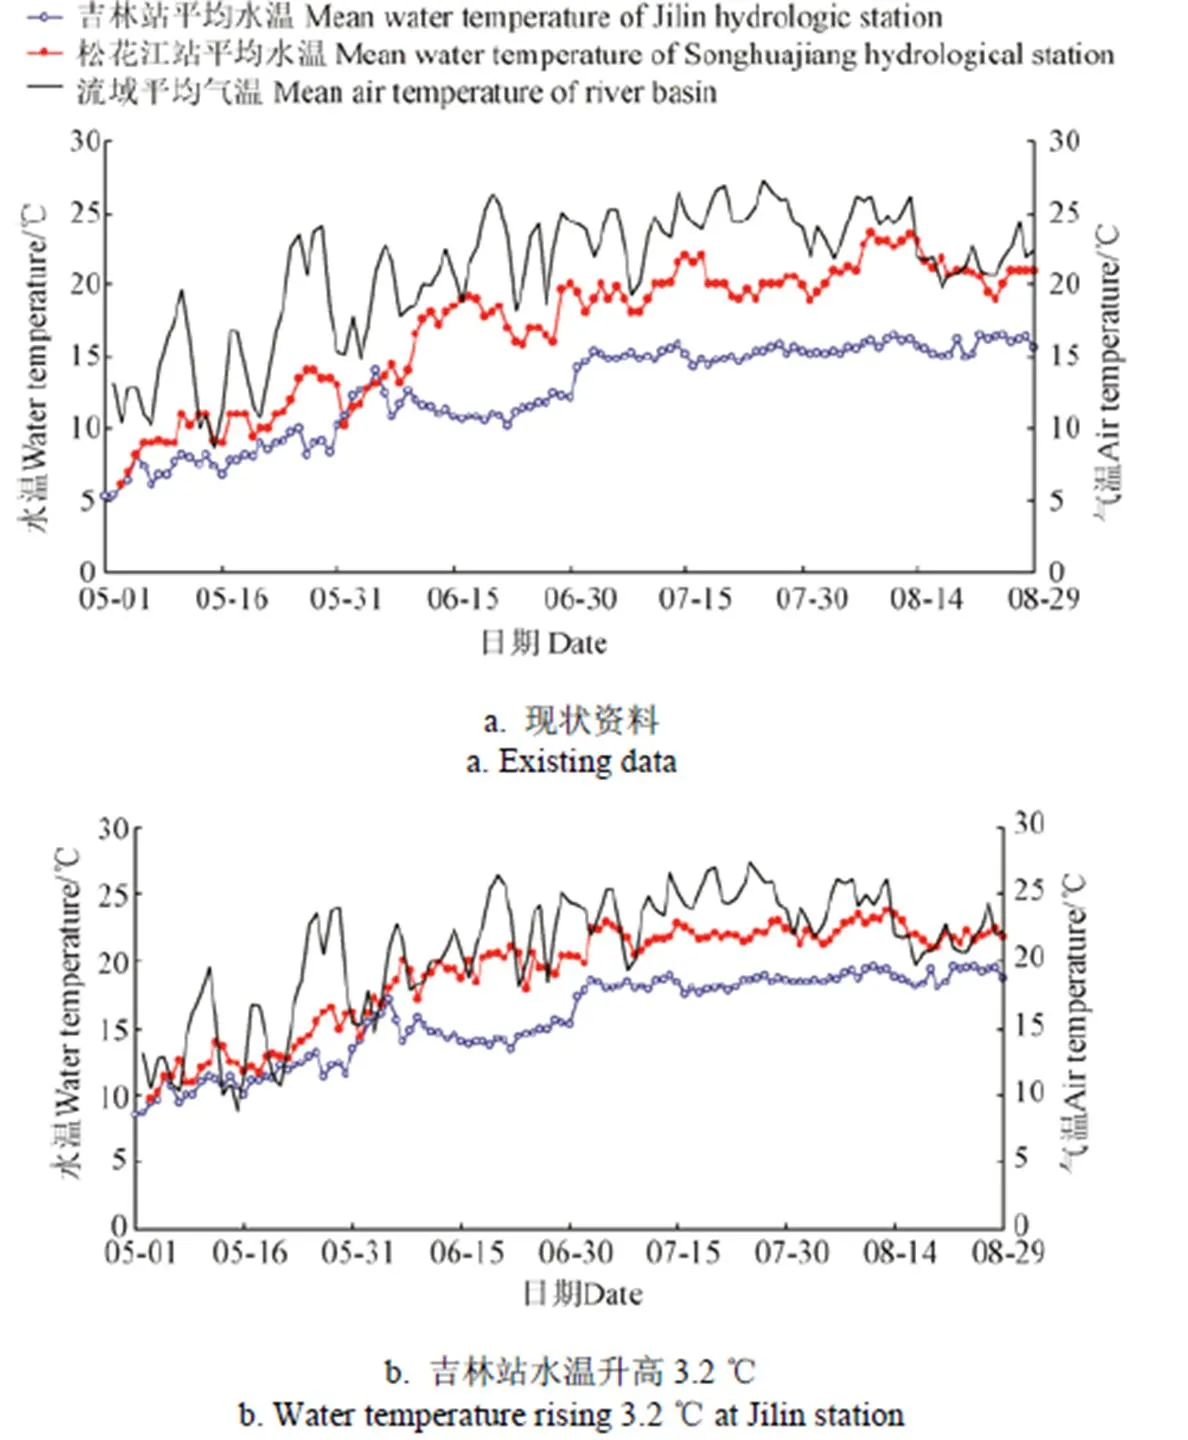
圖6 2011年5?8月松花江站水溫的時間變化過程
分析表明,5-8月松花江站水溫比吉林站水溫平均升高約3.3 ℃左右,較之現(xiàn)狀下降1.3 ℃。究其原因在于,當上游吉林站下泄水溫升高后,水體與大氣溫差減小,兩者熱交換量降低,使得溫升值有所下降。表明該模型能夠較好地反映上游電站水溫調(diào)控對于下游魚類產(chǎn)卵場水溫的影響。
5 討 論
目前對于神經(jīng)網(wǎng)絡在河流水溫實時預報中的應用,主要應當考慮以下4個方面的問題:首先是影響因子的選擇問題。一些學者在研究過程中,僅采用了部分影響因子作為預測因子,來構建神經(jīng)網(wǎng)絡預報模型,造成預報誤差較大[24]。這種情況下,針對神經(jīng)網(wǎng)絡結構與學習算法進行反復優(yōu)化與調(diào)整,對模型預報精度改善仍然有限[28]。本文研究中,首先針對水文氣象因子進行相關性分析,篩選出目標水溫的主要影響因子,然后再建立神經(jīng)網(wǎng)絡預報模型,可較完整地反應預測因子之間的相互作用對目標因子的影響,避免產(chǎn)生較大的系統(tǒng)誤差。
第二是神經(jīng)網(wǎng)絡模擬對象的表達形式問題。以往研究中,均是在確定影響因子之后,直接建立類似黑箱的預報模型[32],該類模型對于物理現(xiàn)象的內(nèi)部機理不具有解釋性,在實際應用中可能會出現(xiàn)較大偏差,甚至不合理的解答。在本文研究中,模擬對象是一個160 km河段在2日內(nèi)的熱交換過程,為此,先通過分析建立了能夠反映其物理過程的基本表達形式,然后再將其轉化為神經(jīng)網(wǎng)絡預報模型。該模型計算驗證表明,在2014年長系列水溫過程預報中,盡管下泄流量、下泄水溫、氣象條件不斷變化,模型預測水溫保持了良好的精度與收斂性。
第三是神經(jīng)網(wǎng)絡預測因子的時間屬性問題。在實際問題研究中,預測因子與目標因子通常并不符合時間對應關系,例如降雨-徑流的預報問題,從降雨到形成徑流需要一定的滯后時間,此為模型固有的預報期[26]。本文研究中,通過對吉林站與松花江站之間流量過程線進行分析,確認兩站之間存在2日預報期,同時由于實測資料均為逐日平均數(shù)據(jù),模型預測因子中的上游吉林站下泄水溫取當日值,氣象條件則為第2日內(nèi)平均值,下游松花江站水溫則取第3日值,這樣構建了2日預報模型。
第四是神經(jīng)網(wǎng)絡模型的空間擴展性問題。以往采用神經(jīng)網(wǎng)絡方法,一般僅針對某一條河流的局地水溫進行預報。當需要預測水溫的站點較多時,一般采用2種處理方法[33],一種方法是針對每個站點分別建立預報模型,然后組合在一起,該方法適用于預測站點相對獨立,目標因子關聯(lián)度較小的情況。另一種方法是在現(xiàn)有網(wǎng)絡的基礎上,通過增加目標因子的數(shù)量,實現(xiàn)多個站點的水溫預測。該方法適用于站點相互關聯(lián),且預報因子的數(shù)據(jù)條件基本相同的情況。本文研究中,采用了一種通用神經(jīng)網(wǎng)絡,其目標因子可不限于松花江站水溫,若要預測河道其他站點的水溫,只需要增加新站點目標因子及其實測水溫資料,然后進一步學習形成新的預報模型。
另外,由于實測水文氣象資料中包含一定測量誤差,同時神經(jīng)網(wǎng)絡的結構與學習方法也造成計算誤差,使得本文模型具有0.5 ℃左右的平均誤差。在實際工程應用中,應當通過連續(xù)多日預報,根據(jù)一段時間內(nèi)產(chǎn)卵場的水溫平均值,調(diào)控下泄水溫。
6 結 論
通過對吉林水文站與松花江水文站的水文資料,以及長春站的氣象資料進行分析處理,運用RBF(radial basis function)神經(jīng)網(wǎng)絡,建立了松花江站水溫的預報模型。該預報模型中除了考慮吉林水文站的水溫以外,增加了流量、氣溫、濕度等氣象條件,提高了松花江站的水溫預測精度。運用該神經(jīng)網(wǎng)絡對2006-2013年的水文、氣象實測數(shù)據(jù)進行學習,然后針對2014年實測條件下的松花江站水溫過程進行預測,計算值與實測值的規(guī)律較為吻合,相關系數(shù)達0.992,水溫預測平均誤差為0.51 ℃。由于河道水流從吉林水文站至松花江水文站,需要歷時2日左右,在神經(jīng)網(wǎng)絡的預測因子中,吉林站的水溫與流量采用了當日值,長春站氣象條件采用了第2值,而松花江站水溫則為第3日預測值,因此該模型具有2日預報期。在實際運行期間,可根據(jù)天氣預報中長期數(shù)據(jù)與電站泄水計劃,采用2日遞推的方法預測未來時段下游魚類產(chǎn)卵場的水溫變化過程,實現(xiàn)下泄水溫與流量的動態(tài)調(diào)控,可保持適宜的魚類產(chǎn)卵條件。
[1] 駱文廣,楊國錄,宋云浩,等. 再議水庫生態(tài)環(huán)境調(diào)度[J]. 水科學進展,2016,27(2):317-326.
Luo Wenguang, Yang Guolu, Song Yunhao, et al. Reconsidering ecologically-sound environmental operations at reservoirs[J]. Advances in Water Science, 2016, 27(2): 317-326. (in Chinese with English abstract)
[2] 徐楊,常福宣,陳進,等. 水庫生態(tài)調(diào)度研究綜述[J]. 長江科學院院報,2008,25(6):33-37.
Xu Yang, Chang Fuxuan, Chen Jin, et al. Review of research on ecological operation of reservoir[J]. Journal of Yangtze River Scientific Research Institute, 2008, 25(6): 33-37. (in Chinese with English abstract)
[3] Hughes D A, Hannart P A. desktop model used to provide an initial estimate of the ecological instream flow requirements of rivers in South Africa[J]. Journal of Hydrology, 2003, 270(3): 167-181.
[4] Harman C, Stewardson M. Optimizing dam release rules to meet environmental flow targets[J]. River Research and Applications, 2005, 21(2/3): 113-129.
[5] Junk W J. Amazonian Floodplains: Their Ecology, Present and Potential Use [J]. Revue Dhydrobiologie Tropicale, 1982, 15(4):285-301.
[6] Kingsford R T, Curtin A L, Porter J. Water flow on cooper creek in arid Australia determine ‘boom’ and ‘bust’ periods for waterbirds[J]. Biological Conservation, 1999, 8(8): 231-248.
[7] Naiman R J, Turner M G. A future perspective on north American’s fresh water ecosystems[J]. Ecological Applications, 2000, 10: 958-966.
[8] Lovich J, Melis T S. The state of the Colorado river ecosystem in Grand Canyon: Lessons from 10 year of adaptive ecosystem management [J]. International Journal of River Basin Management, 2007, 5(3): 207-221.
[9] Higgins J M, Brock W G. Overview of reservoir release improvements at 20 TVA dams[J]. Journal of Energy Engineering, 1999, 125(1): 1-17.
[10] 尹正杰,楊春花,許繼軍. 考慮不同生態(tài)流量約束的梯級水庫生態(tài)調(diào)度初步研究[J]. 水力發(fā)電學報,2013,32(3):66-70,81.
Yin Zhengjie, Yang Chunhua, Xu Jijun. Ecological regulation of cascade dams in the lower Jinsha river under different ecological flow constraints[J]. Journal of Hydroelectric Engineering, 2013, 32(3): 66-70, 81. (in Chinese with English abstract)
[11] 柳海濤,孫雙科,王曉松,等. 大型深水庫分層取水水溫模型試驗研究[J]. 水力發(fā)電學報,2012,31(1):129-134.
Liu Haitao, Sun Shuangke, Wang Xiaosong, et al. Water temperature model test for a multi-level power intake of large deep reservoir [J]. Journal of Hydroelectric Engineering, 2012, 31(1): 129-134. (in Chinese with English abstract)
[12] 鄭鐵剛,孫雙科,柳海濤,等. 大型分層型水庫下泄水溫對取水高程敏感性分析研究[J]. 水利學報,2015,46(6):714-722,731.
Zheng Tiegang, Sun Shuangke, Liu Haitao, et al. Sensibility analysis of intake elevation on water temperature discharged from a large thermal stratified reservoir[J]. Journal of Hydraulic Engineering, 2015, 46(6): 714-722, 731. (in Chinese with English abstract)
[13] 蒲靈,李克峰,莊春義,等. 天然河流水溫變化規(guī)律的原型觀測研究[J]. 四川大學學報:自然科學版,2006,43(3):615-617.
Pu Ling, Li Kefeng, Zhuang Chunyi, et al. Field measurement of distribution of water temperature’s change along a river[J]. Journal of Sichuan University(Natural Science Edition), 2006, 43(3): 615-617. (in Chinese with English abstract)
[14] Yang D, Peterson A. River water temperature in relation to local air temperature in the Mackenzie and Yukon basins[J]. Arctic, 2017, 70(1): 47-58.
[15] Jackson F L, Fryer R J, Hannah D M, et al. A spatio-temporal statistical model of maximum daily river temperatures to inform the management of Scotland’s Atlantic salmon rivers under climate change[J]. Science of the Total Environment, 2018, 612: 1543-1558.
[16] Garner G, Malcolm I A, Sadler J P, et al. The role of riparian vegetation density, channel orientation and water velocity in determining river temperature dynamics[J]. Journal of Hydrology, 2017, 553: 471-485.
[17] Laanaya F, St-Hilaire A, Gloaguen E. Water temperature modelling: Comparison between the generalized additive model, logistic, residuals regression and linear regression models[J]. International Association of Scientific Hydrology Bulletin, 2017, 62(7): 1078-1093.
[18] 鞠鵬飛,陳青生,陳衛(wèi). 基于支流水溫對漢江干流河道水溫影響的數(shù)值模擬[J]. 水電能源科學,2013(5):84-87.
Ju Pengfei, Chen Qingsheng, Chen Wei. Numerical simulation of influence of water temperature of tributary on Hanjiang main river[J]. Water Resources & Power, 2013(5): 84-87. (in Chinese with English abstract)
[19] 脫友才,周晨陽,梁瑞峰,等. 水電開發(fā)對大渡河瀑布溝以下河段的水溫影響[J]. 水科學進展,2016,27(2):299-306.
Tuo Youcai, Zhou Chenyang, Liang Ruifeng, et al. Influence of hydroelectric development on water temperature downstream the Pubugou hydropower station of the Dadu River[J]. Advances in Water Science, 2016, 27(2): 299-306. (in Chinese with English abstract)
[20] 陳衛(wèi),熊君. 丹江口水庫下游河道水溫恢復過程二維數(shù)值模擬[J]. 西北水電,2016(6):73-76.
Chen Wei, Xiong Jun. 2D numerical simulation of recovery process of water temperature at downstream river course of danjiangkou reservoir[J]. Northwest Hydropower, 2016(6): 73-76. (in Chinese with English abstract)
[21] 李玉榮,許銀山,閔要武,等. 三峽水庫實時調(diào)度水文氣象預報應用風險及控制[J]. 人民長江,2015,46(23):15-19.
Li Yurong, Xu Yinshan, Min Yaowu, et al. Research on risk and control of hydro-meteorological forecasting application in real-time operation of Three Gorges Reservoir[J]. Yangtze River, 2015, 46(23): 15-19. (in Chinese with English abstract)
[22] Wambua R M. Prediction of Missing Hydro-Meteorological Data Series Using Artificial Neural Networks (ANN) for Upper Tana River Basin, Kenya[J]. International Journal of Climatology, 2016, 31(2):159-161.
[23] Hadzima-Nyarko M, Rabi A, ?perac M. Implementation of artificial neural networks in modeling the water-air temperature relationship of the river drava[J]. Water Resources Management, 2014, 28(5): 1379-1394.
[24] Deweber J T, Wagner T. A regional neural network ensemble for predicting mean daily river water temperature[J]. Journal of Hydrology, 2015, 517(2): 187-200.
[25] Chithra N R, Thampi S G, Surapaneni S, et al. Prediction of the likely impact of climate change on monthly mean maximum and minimum temperature in the Chaliyar river basin, India, using ANN-based models[J]. Theoretical & Applied Climatology, 2015, 121(3/4): 581-590.
[26] Astray G, Soto B, Lopez D, et al. Application of transit data analysis and artificial neural network in the prediction of discharge of Lor River, NW Spain[J]. Water Science & Technology, 2016, 73(7): 1756-1767.
[27] Piccolroaz S, Calamita E, Majone B, et al. Prediction of river water temperature: A comparison between a new family of hybrid models and statistical approaches[J]. Hydrological Processes, 2016, 30(21): 3901-3917.
[28] Piotrowski A P, Napiorkowski M J, Napiorkowski J J, et al. Comparing various artificial neural network types for water temperature prediction in rivers[J]. Journal of Hydrology, 2015, 529(1): 302-315.
[29] 黃鸞玉,黎小正,謝宗升,等. 來賓紅水河珍稀魚類保護區(qū)水質(zhì)指標相關性研究[J]. 環(huán)境保護科學, 2017, 43(2):108-111.
Huang Luanyu, Li Xiaozheng, Xie Zongsheng, et al. Study of the correlations between water quality indicators of rare fish protected area in Laibin Section of Hong River [J] Environmental Protection Science, 2017, 43(2):108-111.
[30] 柳海濤,孫雙科,劉之平,等. 泄洪霧化預測的人工神經(jīng)網(wǎng)絡方法探討[J]. 水利學報,2005,36(10):1241-1245. Liu Haitao, Sun Shuangke, Liu Zhiping, et al. Atomization prediction based on artificial neural networks for flood releasing of high dams[J]. Journal of Hydraulic Engineering, 2005, 36(10): 1241-1245. (in Chinese with English abstract)
[31] 鄭鐵剛,孫雙科,柳海濤,等. 大型分層型水庫下泄水溫對取水高程敏感性分析研究[J]. 水利學報,2015,46(6):714-722.
Zheng Tiegang, Sun Shuangke, Liu Haitao, et al. Sensibility analysis of intake elevation on water temperature discharged from a large thermal stratified reservoir [J]. Journal of Hydraulic Engineering, 2015, 46(6): 714-722. (in Chinese with English abstract)
[32] Liu W C, Chen W B. Prediction of water temperature in a subtropical subalpine lake using an artificial neural network and three-dimensional circulation models[J]. Computers & Geosciences, 2012, 45: 13-25.
[33] Risley J C, Roehl E A, Conrads P A. Estimating Water Temperatures in Small Streams in Western Oregon Using Neural Network Models[R]. Center for Integrated Data Analytics Wisconsin Science Center, 2003.
Prediction of water temperature regulation for spawning sites at downstream of hydropower station by artificial neural network method
Liu Haitao, Sun Shuangke, Zheng Tiegang, Li Guangning
(100038)
In this study, the water temperature regulation were carried out through the selective intake facilities in Fengman Hydropower station to improve the downstream living environment. The power plant released flow first reaches Jilin hydrologic station at 20 km downstream, and then through the 160 km long reach, arrive at the Songhuajiang hydrologic station, where there are a series of spawning sites of black carp, grass carp, silver carp, etc. The field data analysis showed that, there was a strong correlation between the water temperature of the power plant and Jilin Station, so the empirical relationship has been established based on the statistical analysis of the measured data in earlier research. However, there was obvious difference and poor correlation between the water temperature of Jilin Station and Songhuajiang station. The main reason was that the heat exchange between the channel water and the surrounding environment led to a significant change in water temperature. Firstly, by analyzing the correlation coefficients between all the hydrological and meteorological factors with the water temperature of Songhuajiang station, the six external influence factors were identified, including the flow and water temperature of Jilin Station, and the air temperature, relative humidity, wind speed and sunshine duration of Changchun meteorological station. Then, based on the field data, the water temperature prediction model of Songhuajiang station was established by using a RBF (radial basis function) neural network, which can automatically select the sample vectors with maximum error as a new neuron until to finally reach the required precision. It took about 2 days to flow from Jilin to Songhuajiang station, so the model predictors had temporal and spatial attributes. The flow and water temperature of Jilin station should be the values of the first day, the climate conditions of Changchun station were of the next day, and the water temperature of Songhuajiang station was of the third day. Therefore the neural network model actually reflected a heat exchange process within two days. According to the medium or long term weather forecast data and power station discharge plan, the neural network model can be used to predict the time course of the water temperature at the spawning sites by using the above two day recursive method. The model was trained by the field data in 2006 - 2013, and to predict the temperature time course in 2014, the time variation of the calculated and measured water temperatures were in good agreement, the average deviation was 0.51 ℃, and the correlation coefficient was 0.992. In May 2010 to August, for example, the average temperature increased from Jilin to Songhuajiang station was 4.6 ℃. When the released water temperature upstream rose 3.2 ℃ by regulation, because of the decrease of the heat exchange between the channel water and the surrounding environment, the temperature increased between the two stations dropped 3.3 ℃. It was proved that this model can better reflect the influence of heat exchange along the river on the water temperature of downstream spawning field. During the water temperature regulation, the water temperature at spawning sites will be predicted, and the releasing discharge of power plant is adjusted properly, to provide suitable spawning conditions.
models; hydrology; fish; hydropower station; ecological operation; spawning sites; water temperature; artificial neural network
2017-09-02
2018-01-15
國家重點研發(fā)規(guī)劃(2016YFC0401708);國家自然基金項目(51679262)
柳海濤,博士,教授級高級工程師,主要研究方向為生態(tài)水力學與水工水力學。Email:htliou@163.com.
10.11975/j.issn.1002-6819.2018.04.022
S931.1
A
1002-6819(2018)-04-0185-07
柳海濤,孫雙科,鄭鐵剛,李廣寧. 水電站下游魚類產(chǎn)卵場水溫的人工神經(jīng)網(wǎng)絡預報模型[J]. 農(nóng)業(yè)工程學報,2018,34(4):185-191.doi:10.11975/j.issn.1002-6819.2018.04.022 http://www.tcsae.org
Liu Haitao, Sun Shuangke, Zheng Tiegang, Li Guangning. Prediction of water temperature regulation for spawning sites at downstream of hydropower station by artificial neural network method[J]. Transactions of the Chinese Society of Agricultural Engineering (Transactions of the CSAE), 2018, 34(4): 185-191. (in Chinese with English abstract) doi:10.11975/j.issn.1002-6819.2018.04.022 http://www.tcsae.org
猜你喜歡
童話王國·奇妙邏輯推理(2024年5期)2024-06-19 16:03:38
網(wǎng)絡安全與數(shù)據(jù)管理(2022年1期)2022-08-29 03:15:20
導航定位學報(2022年4期)2022-08-15 08:27:00
中學生數(shù)理化·中考版(2022年8期)2022-06-14 06:55:24
新世紀智能(數(shù)學備考)(2021年9期)2021-11-24 01:14:36
成都醫(yī)學院學報(2021年2期)2021-07-19 08:35:14
新世紀智能(數(shù)學備考)(2020年9期)2021-01-04 00:25:14
中學生數(shù)理化·七年級數(shù)學人教版(2020年10期)2020-11-26 08:24:50
數(shù)學物理學報(2020年2期)2020-06-02 11:29:24
光學精密工程(2016年6期)2016-11-07 09:07:19
