引入地形因子的黑土區大豆干生物量遙感反演模型及驗證
2017-09-15 07:43:46張新樂徐夢園劉煥軍孟令華邱政超謝雅慧東北農業大學資源與環境學院哈爾濱50030中國科學院東北地理與農業生態研究所長春3002
農業工程學報 2017年16期
張新樂,徐夢園,劉煥軍,2※,孟令華,邱政超,潘 越,謝雅慧(. 東北農業大學資源與環境學院,哈爾濱 50030:2. 中國科學院東北地理與農業生態研究所,長春 3002)
引入地形因子的黑土區大豆干生物量遙感反演模型及驗證
張新樂1,徐夢園1,劉煥軍1,2※,孟令華1,邱政超1,潘 越1,謝雅慧1
(1. 東北農業大學資源與環境學院,哈爾濱 150030:2. 中國科學院東北地理與農業生態研究所,長春 130012)
為了對田塊尺度農作物地上干生物量進行估測,提高大豆地上干生物量反演模型的精度和穩定性,該文獲取了研究區地塊2016年7、8月份的SPOT-6多光譜數據,并測定不同地形坡位的大豆地上干生物量,以歸一化植被指數(normalized difference vegetation index,NDVI)和增強型植被指數(enhanced vegetation index,EVI)為輸入量,建立田塊尺度大豆地上干生物量一元線性回歸模型;加入與地上干生物量相關的地形因子,建立逐步多元回歸和神經網絡多層感知反演模型。結果表明:1)使用傳統的單一植被指數模型預測大豆地上干生物量有可行性,但模型精度和穩定性不高。2)加入地形因子(海拔、坡度、坡向)的神經網絡多層感知器模型,有較高的精度和可靠性,模型準確度達到90.4%,驗證結果顯示預估精度為96.2%。反演結果與地塊的地形、地貌、氣溫和降水特征基本吻合,反映了作物長勢的空間分布特征,可以為田塊尺度大豆地上干生物量動態監測和精準管理,提供借科學依據。
遙感;作物;模型;大豆;地上干生物量;地形因子
0 引 言
作物地上生物量是反映作物生長狀況的重要指標,作物生物量估算是服務現代農業的一項重要內容,及時準確的生物量模擬對國家農業決策、農田生產管理、糧食倉儲安全等都有重要意義[1]。傳統地面調查監測的統計模型與物理模型難以實用化,無論是從時間還是從空間角度來獲取生物量,都有一定難度和局限[2-6]。遙感技術可以打破這一局限,準確、無破壞的對多源信息快速提取,對生物量進行估算與制圖,實現對整個生態系統的宏觀監測。
目前有很多學者,用植被指數估算生物量。李素英等反演錫林浩特草原的生物量,選用基于TM影像數據建立的5種植被指數,和地上生物量建立線性及非線性模型[7]。崔霞等基于MOD09GA產品,建立17種植被指數,研究與生物量的相關性并建立草地地上生物量遙感反演模型[8]。但單一用植被指數反演生物量時還存在一些問題,比如模型因素單一,模型精度不高,普遍適用性不強。
同時,地形因子影響生物量分布。因為自然環境是植物生長更新的重要條件[9],地形左右著區域內部太陽輻射和降水的空間布局,營造出局部小氣候,造成土壤質地和土壤養分、水分在不同地形條件下的差異分布,從而間接影響植被生長[10-11]。地形因子對植物分布的影響,當前已經受到了廣泛關注[13-16]。Olivero 和 Hix等在研究中發現,俄亥俄州東南部不同坡向的森林,地表植物多樣性不同[13];Tokuchi 等研究了西班牙東南部森林的土壤厚度和水分的空間異質性,結果表明地形因子( 坡度和海拔)是差異產生的主導因素,并對植物分布起重要作用[15]。
為解決植被指數估測生物量,因素單一和模型精度不高問題,同時考慮到地形因子對生物量分布的影響,本文擬用多光譜遙感影像,加入實測坡向、坡度、海拔等地形數據,建立大豆地上干生物量反演模型,實現田塊尺度大豆長勢定量監測,為農田精準管理提供依據。
1 研究區及數據源
1.1 研究區域概況
研究區位于黑龍江省綏化市海倫東興,屬寒溫帶大陸性氣候,四季分明,全年平均降水量500~600 mm,年活動積溫為2 200~2 400 ℃,平均海拔239 m,地處典型黑土區,漫川漫崗;坡面、坡頂、坡底等不同地貌類型上土壤侵蝕程度不同,加之土壤養分、水分空間差異性顯著,田塊內部土壤、作物長勢差異大,相同的施肥方式、田間不同空間位置地上干生物量卻差異明顯。選取歷年作物長勢、產量空間差異顯著的地塊作為研究區(圖1),面積約為13.16 hm2,地塊中心經緯度為47°25′N、126°55′E,生長季節內采用一致的田間管理措施,種植作物選擇大豆供試。
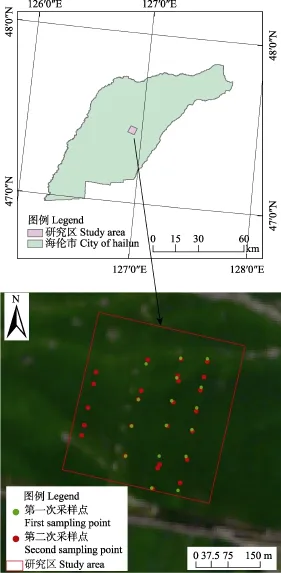
圖1 研究區及樣點布置(2016年7月7日SPOT-6真彩色影像)Fig.1 Location of study fields and sample distribution map (SPOT-6 true color image on July 7, 2016)
1.2 數據源
1.2.1 遙感數據獲取與預處理
編程訂購2016-07-18、2016-08-08兩期SPOT-6影像,全色波段空間分辨率為1.5 m,多光譜波段空間分辨率6 m。利用ENVI5.1對影像進行輻射定標、大氣校正、正射校正的處理,在ArcGIS 10.1中對影像進行裁剪。然后對裁剪后的影像進行C模型地形校正,并計算影像的歸一化植被指數(normalized difference vegetation index,NDVI)和增強型植被指數(enhanced vegetation index,EVI)。
1.2.2 地形數據
2016年5月27日,使用定位精度為厘米級的海星達iRTK2對研究區地塊進行實地測量。將得到的780個精確坐標和高程點,在ArcGIS中生成TIN圖層,并轉成分辨率為4 m的高精度DEM柵格數據,在ArcGIS中提取海拔、坡向、坡度因子(圖2)。
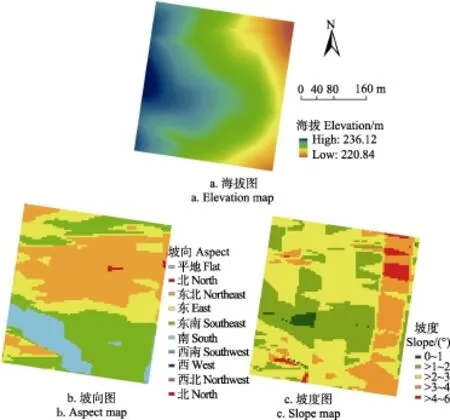
圖2 研究區地形特征Fig.2 Terrain features of study field
1.2.3 地上干生物量測定
在大豆生長期(從7月15日開始到8月14日期間)分2批次均勻采樣,覆蓋整個區域的41個樣方,每個樣方面積為2.2 m×2 m,統計每個樣方內大豆株數,并在其中隨機選取若干株長勢均勻的樣本植物,齊根剪取。在實驗室中,將植物樣品于80 ℃恒溫烘干,獲得植物地上部分干生物量。用公式(1),將其換算成采樣點1 m×1 m區域內大豆的地上干生物量。單位面積內大豆的地上干生物量平均值:

式中Bj表示第j個樣區單位面積內大豆地上干生物量;Bjk表示第j個樣區單位面積內隨機割取的m株大豆干質量;n為樣區單位面積內大豆總株數;m為樣區內被割取稱質量的大豆株數。樣本采集統計結果見表1。
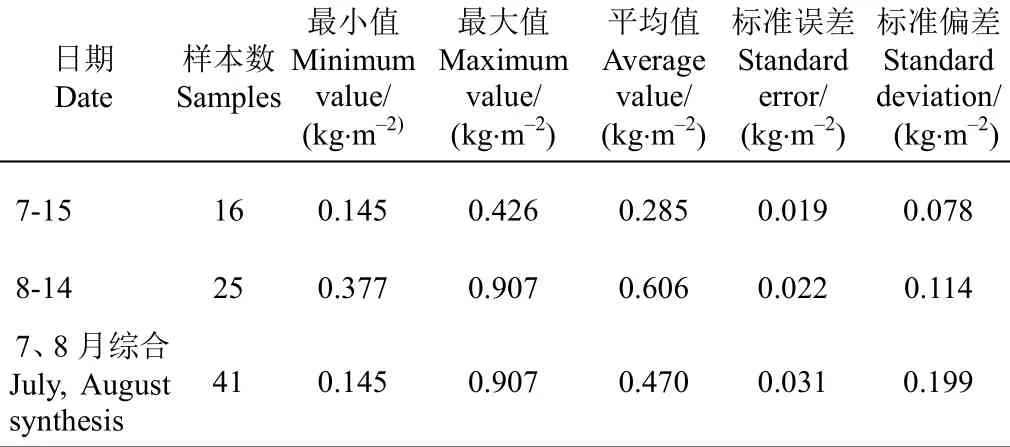
表1 樣區大豆干生物量描述統計量Table 1 Descriptive statistics of sampled soybean biomass
1.3 模型構建
隨機選取41個樣點中的28個用來建模,13個樣本校驗。選取3種方法建立模型,分別為一元線性、多元回歸、神經網絡多層感知器模型。
1.3.1 一元線性模型
植被指數法是光學遙感估算植被生物量常用的經驗方法。而在地形復雜區域,SR(simple ratio,SR)和 NDVI是最常用的基于近紅外與紅光波段比值形式的植被指數,可以消除大量的地形影響[17]。選取目前應用最為廣泛的歸一化差值植被指數NDVI,考慮到,NDVI可能會達到飽和并處于穩定階段,而EVI不容易飽和[18]。因此,選取增強型植被指數EVI,2種植被指數進行對比分析。
選擇應用以上2種植被指數與大豆地上干生物量進行相關性分析,并建立一元線性模型估算大豆地上干生物量。
1.3.2 多元回歸模型
作物生物量不光與植被反射光譜信息有關,和地學因子也有密切關系[19-22]。選擇植被指數、海拔、坡度、坡向等地形因子,作為變量,構建大豆地上干生物量估測模型。模型構建前,為避免輸入變量之間的相關性的影響,減少變維系數,先對上述變量進行主成分提取。建立基于主成分的大豆地上干生物量反演模型。多元線性回歸方程一般表達式是

式中ε是隨機項,服從正態分布N(0,σ2)。本文中,因變量y是干生物量,β0為常數項,βk(k=1,2,…,k)為回歸系數,Xk(k =1,2,…,k)為篩選出的高相關性的變量因子。
1.3.3 神經網絡多層感知器MLP模型
在人工神經網絡中,多層感知器(multi-layer perceptron,MLP)是運用最廣泛的一種模型[23]。一個典型的神經網絡由3部分組成:輸入層(input layer)、隱含層(hidden layer)和輸出層(output layer)。神經網絡的輸出值yσ如式(3)
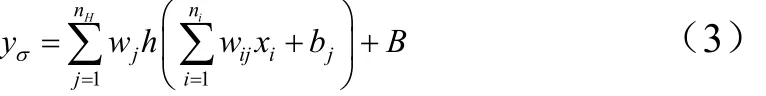
式中h是激活函數,bj和B分別是“輸入層到隱藏層”和“隱藏層到輸出層”這兩步函數的偏差,wij是第j個輸入層單元到第i個隱含層的權重,wj是第j個隱含層單元到輸出層的權重.xi表示輸入參數,ni表示xi個數,nH表示隱藏層節點數。利用一系列數據對神經網絡進行訓練,尋找最佳權重w使得目標函數E最小。
1.3.4 模型精度評價
采用均方根誤差(root-mean-square error,RMSE)和決定系數(determination coefficient,R2)分析模型的精度,確定最優反演模型。RMSE的數值越低,表明模型越精確;R2越接近于1,表示模型的參考價值越高[24-25]。
2 結果與分析
2.1 地形對大豆地上干生物量的影響
根據研究區不同地形特征(圖2),選取具有陽坡、坡頂、陰坡和坡底連續地形變化的采樣點,統計4個地形坡位的樣點生物量,得出生物量干生物量變化特征(圖3)。根據與不同坡位之間的關系,能直觀反映出大豆在不同地形條件下的生長狀況,7、8月份不同時期地上干生物量在4個坡位上的海拔和地上干生物量均值變化。
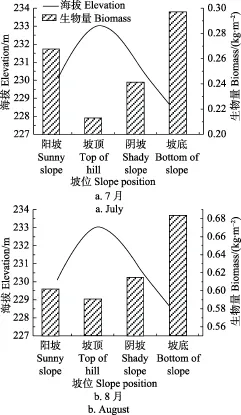
圖3 不同坡位海拔及大豆地上干生物量分布特點Fig.3 Elevation and distribution of soybean dry biomass of different slope positions
7月中旬陽坡的地上干生物量均值為0.27 kg/m2,坡頂干生物量均值最小為0.23 kg/m2,(圖3)最大均值出現在坡底,地上干生物量指標均值坡底大于陽坡,大于陰坡和坡頂。陽坡和坡底干生物量均值最大,可能是研究區大豆在生長前期(5月中旬至6月末,大豆出苗和拔節期),對光照、溫度和水分要求較高,而陽坡光照時間較長、坡底有機質和水分充足,對大豆生長具有正面影響,因此生物量在陽坡和坡底積累較多。8月上旬陽坡的地上干生物量均值0.60 kg/m2,坡頂均值最小,陰坡為0.62 kg/m2(圖3),地上干生物量均值坡底和坡頂相差0.093 kg/m2。進入8月份,樣本區整體生物量較7月份有較大提高,但是不同坡位生物量積累在圖中表現較大差異,說明地形是造成該地區生物量分布差異的重要因素。
2.2 地上干生物量反演模型及精度驗證
根據多光譜影像、實地測量地形數據和試驗區實測地上干生物量建立的回歸模型(表2)可知,2種遙感植被指數EVI和NDVI與地上干生物量建立的一元線性模型中,NDVI擬合度較高,R2達到0.712。選用NDVI與相關地形因子建立的多元線性回歸和神經網絡多層感知器模型,R2分別為0.716、0.904,RMSE分別為0.116、0.047 kg/m2。神經網絡多層感知模型R2 明顯高于其他遙感模型,RMSE較其他模型低。
對13個樣區驗證結果顯示,神經網絡模型反演的整個驗證區總地上干生物量的平均絕對誤差和平均相對誤差均最小,為0.113 kg/m2和0.212;神經網絡多層感知器模型的平均相對誤差比一元線性模型降低18.2%(表2)。因此,在3類反演模型中,神經網絡模型的反演結果最接近實際情況。

表2 地上干生物量預測模型及精度評價Table 2 Model accuracy evaluation for aboveground biomass
2.3 地上干生物量空間分布制圖與分析
使用NDVI、海拔、坡度、坡向因子做為模型輸入量的神經網絡模型,反演整個研究區大豆生長期7月中旬到8月上旬地上干生物量分布。結果顯示,7月中旬該地區大豆地上干生物量略高的區域主要分布在東部(圖4);8月上旬開始,地區干生物量總體升高,西南部和西北坡度大的地區,大豆地上干生物量明顯低于周邊地區。
對應研究區大豆生長周期,7、8月是大豆生殖發育的關鍵時期。7月中旬之前,大豆處于生長發育初期,經歷了拔苗和開花拔節時期,地上干生物量積累較少,整體差異并不十分明顯。7月下旬開始,大豆生長逐漸進入到結莢抽雄、吐絲抽穗期,東部地區,地形整體平坦,海拔坡度較低,水肥保持能力較西部地區強,不具有針對性的統一施肥管理,使得地上干生物量積累的差異隨之越來越明顯,至8月上旬,東部地區干生物量整體偏高,溝谷地區因為坡度大,地形復雜,水肥保持能力差,地上干生物量積累一直偏低。該空間分布模式與研究區實際情況較為一致。
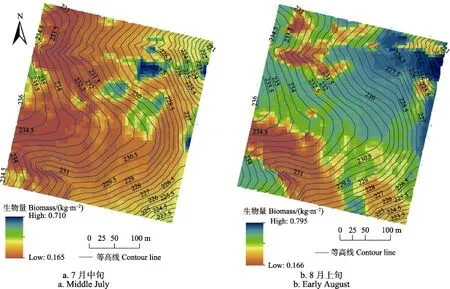
圖4 大豆生物量空間分布Fig.4 Spatial distribution of soybean biomass
3 討 論
當今,遙感技術普遍應用到農業上,通過遙感衛星、激光雷達、無人機等進行森林、濕地、草原等生物量數據獲取,前人已研究過并獲得了大量成果。然而利用多光譜數據獲取,進行小尺度高精度的農作物地上生物量反演還較少。植被指數NDVI能夠反演作物生長前期生物量,但到了后期呈現飽和狀態,此時作物生長積累的生物量難以準確反映[28-30]。因此,引入EVI與之對比,結果顯示以NDVI為自變量的模型精度較高。研究利用遙感指示因子,同時選取生物量相關的多種地形因子進行模型的構建,盡可能減少了單一使用NDVI估測生物量所存在的間接性和飽和性問題。
本文為減少樣點布局數量、定位精度、生物量測定誤差對生物量估算的影響[26-28],按照作物不同長勢的實際狀況均勻布設樣點,樣方數據中包括區域中較小生物量和較大生物量的群落,樣點中心定位和地形因子測量都嚴格按照調查規范執行,生物量測量取多次結果平均值[26]。在此基礎上結合遙感影像,建立大豆地上生物量估測模型,為監測田間大豆群體生長狀況,田間精準管理提供簡單實用的方法,最終達到針對性提高大豆地上生物量的目的。
盡管如此,準確估算不同作物生物量是個相當復雜的問題,首先,模型因子提取歸一化植被指數,在地形復雜地區,歸一化植被指數的準確性和普遍性難以保證;其次,通過高精準實測地形數據獲取地形因子來反演生物量,只適用于中小范圍,想要大面積區域反演植物生物量并保證精度是很難做到的;最后,由于影像原始數據信息量大,地形不平坦地區實測地形數據信息冗余度高等因素,帶來了數據處理和分析的復雜和難度。
4 結 論
本文建立了大豆地上干生物量多種估測模型,在精度驗證后選擇最佳模型進行反演填圖,并和作物實際生長分析對比,研究結果表明:1)神經網絡模型反演地塊尺度大豆地上干生物量能夠取得較高的精度;2)7月份生物量整體較8月份小,地塊植被呈現“東部略高于西部,整體差異尚不明顯”的分布格局,8月份上旬開始,田塊地上干生物量整體增高,南部陰坡坡底地區地上干生物量明顯大于陽坡3)坡度大,地形陡峭地區,水肥流失較嚴重,地上干生物量明顯低于其他地區;4)地形是造成該區域地上干生物量空間分布差異的重要因素。在大豆生長前期的管理中,若能充分考慮地形對太陽輻射和降水的空間再分配,有針對性的進行田間精準施肥和管理,優化經營方式,將有助于生物量的整體增長和產量的顯著提高。
[1] 譚正,劉湘南,張曉倩,等.作物生長模型同化SAR數據模擬作物生物量時域變化特征[J].中國農學通報,2011,27(27):161-167. Tan Zheng, Liu Xiangnan, Zhang Xiaoqian, et al. Simulation of dynamics of crop biomass by assimulation SAR data into crop growth model[J]. Chinese Agricultural Science Bulletin, 2011, 27(27): 161-167. (in Chinese with English abstract)
[2] 王建步,張杰,馬毅,等. 基于高分一號WFV衛星影像的黃河濕地草本植被生物量估算模型研究[J]. 激光生物學報,2014(6):604-608. Wang Jianbu, Zhang Jie, Ma Yi, et al. Study on the above ground vegetation biomass estimation model based on GF-1WFV satellite image in the yellow river estuary wetland[J]. Journal of Laser Biological, 2014(6): 604-608. (in Chinese with English abstract)
[3] 曾晶,張曉麗. 高分一號遙感影像下嶗山林場林分生物量反演估算研究[J]. 中南林業科技大學學報,2016,36(1):46-51 Zeng Jing, Zhang Xiaoli. Laoshan forest biomass estimation based on GF-1 images with inversion algorithm[J]. Journal of Central South University of Forestry & Technology, 2016, 36(1): 46-51. (in Chinese with English abstract)
[4] 趙天舸,于瑞宏,張志磊,等. 濕地植被地上生物量遙感估算方法研究進展[J]. 生態學雜志,2016,35(7):1936-1946. Zhao Tiange, Yu Ruihong, Zhang Zhilei, et al. Estimation of wetland vegetation aboveground biomass based on remote sensing data: A review[J]. Chinese Journal of Ecology 2016, 35(7): 1936-1946. (in Chinese with English abstract)
[5] 高明亮,趙文吉,宮兆寧,等. 基于環境衛星數據的黃河濕地植被生物量反演研究[J]. 生態學報,2013,33(2):542-553. Gao Minglian, Zhao Wenji, Gong Zhaoning, et al. The study of vegetation biomass inversion based on the HJ satellite data in Yellow River wetland[J]. Acta Ecologica Sinica, 2013, 33(2): 542-553. (in Chinese with English abstract)
[6] 劉芳,馮仲科,趙方,等. 資源三號遙感衛星影像的生物量反演研究[J]. 西北林學院學報,2015,30(3):175-181. Liu Fang, Feng Zhongke, Zhao Fang, et al. Biomass inversion study of ZY-3 remotesensing satellite imagery[J]. Journal of Northwest Forestry Univerisity, 2015, 30(3): 175-181. (in Chinese with English abstract)
[7] 李素英,李曉兵,鶯歌,等. 基于植被指數的典型草原區生物量模型: 以內蒙古錫林浩特市為例[J]. 植物生態學報,2007,31(1):23-31. Li Suying, Li Xiaobing, Ying Ge, et al. Vegetation indexesbiomass models for typical semi-arid steppe: A case study for xilinhot in northern china[J]. Chinese Journal of Plant Ecology, 2007, 31(1): 23-31. (in Chinese with English abstract)
[8] 崔霞,梁天剛,劉勇. 基于MOD09GA產品的草地生物量遙感估算模型[J]. 蘭州大學學報:自然科學版,2009,45(5):79-87. Cui Xia, Liang Tiangang, Liu Yong. Modeling of aboveground biomass of grassland using remotely sensed MOD09GA data[J]. Journal of Lanzhou university: Natural Science Edition[J], 2009, 45(5): 79-87. (in Chinese with English abstract)
[9] Aasen H, Bending J, Bolten A, et al. Intruduction and preliminary results of calibration for full-frame hyperspectral cameras to monitor agricultural crops with UAVs[J]. ISPRSInternatioanl Archives of the Photogrammetry, Remote Sening and Spatial Information Sciences, 2014, 7(7): 1-8.
[10] Cantón Y, Del Barrio G, Solé-Benet A, et al. Topo-graphic controls on the spatial distribution of ground cover in the Tabernas badlands of SE Spain[J]. Catena, 2004, 55: 341-365. [11] Parker A J, Branner J C. The topographic relative mois-ture index: An approach to soil-moisture assessment inmountain terrain[J]. Physical Geography, 1982, 3: 160-168.
[12] Valtera M, ?amonil P, Svoboda M, et al. Effects of topography and forest stand dynamics on soil morphology in three natural Picea abies, mountain forests[J]. Plant & Soil, 2015, 392(1/2): 57-69.
[13] Olivero A M, Hix D M. Influence of aspect and stand ageon ground flora of southeastern Ohio forest ecosystems[J]. Plant Ecology, 1998, 139: 177-187.
[14] Brosofske K D, Chen J, Crow T R. Understory vegetationand site factors: Implications for a managed Wisconsin landscape[J]. Forest Ecology and Management, 2001, 146: 75-87.
[15] Tokuchi N, Takeda H, Yoshida K, et al. Tpographical variations in a plant-soil system along a slope on MtRyuoh, Japan[J]. Ecological Research, 1999, 14: 361-369.
[16] Lewis K J, Trummer L M, Thompson R D. Incidence oftomentosus root disease relative to spruce density andslope position in south-central Alaska[J]. Forest Ecologyand Management, 2004, 194: 159-167.
[17] 朱高龍,柳藝博, 居為民,等. 4種常用植被指數的地形效應評估[J]. 遙感學報,2013,17(1):210-234. Zhu Gaolong, Liu Yibo, Ju Weimin, et al. Evaluation of topographic effects on four commonly used vegetationindices[J]. Journal of Remote Sensing, 2013, 17(1): 210-234. (in Chinese with English abstract)
[18] 劉煥軍,孟令華,張新樂,等. 基于時間序列Landsat影像的棉花估產模型[J]. 農業工程學報,2015,31(17):215-220. Liu Huanjun, Meng Linghua, Zhang Xinle, et al. Estimation model of cotton yield with time series Landsat images[J]. Transactions of the Chinese Society of Agricultural Engineering (Transactions of the CSAE), 2015, 31(17): 215-220. (in Chinese with English abstract)
[19] 鄭光,田慶久,陳鏡明,等. 結合樹齡信息的遙感森林生態系統生物量制圖[J]. 遙感學報,2006,10(6):932-940. Zheng Guang, Tian Qingjiu, Chen Jingming, et al. Combining remote sening imagery and forest age inventory for biomass mapping[J]. Journal of Remote Sensing, 2006, 10(6): 932-940. (in Chinese with English abstract)
[20] Vauhkonen J, N?sset E, Gobakken T. Deriving airborne laser scanning based computational canopy volume for forest biomass and allometry studies[J]. Isprs Journal of Photogrammetry & Remote Sensing, 2014, 96(11): 57-66.
[21] 劉海豐,薛達元, 桑衛國. 地形因子對暖溫帶森林群落物種豐富度-地上生物量關系的影響[J]. 生態環境學報,2012,21(8):1403-1407.Liu Haifeng, Xue Dayuan, Sang Weiguo. Effect of topographic factors on the relationship between species richness and aboveground biomass in a warm temperate forest[J]. Ecology & Environmental Sciences, 2012, 21(8): 1403-1407. (in Chinese with English abstract)
[22] 侯兆疆,趙成章,李鈺,等. 高寒退化草地狼毒種群地上生物量空間格局對地形的響應[J]. 生態學雜志,2013,32(2):253-258. Hou Zhaojiang, Zhao Chengzhang, Li Yu, et al. Responses of the spatial pattern of Stellera chamaejasme's aboveground biomass to topography in degraded alpine grassland[J]. Chinese Journal of Ecology, 2013, 32(2): 253-258. (in Chinese with English abstract)
[23] Jain A K, Mao J C, Mohiuddin K M. Artificial neuralnetworks-a tutorial[J]. Computer, 1996, 29(3): 31-44.
[24] 馮琦勝,高興華,黃曉東,等. 2001-2010 年青藏高原草地生長狀況遙感動態監測[J]. 蘭州大學學報:自然科學版,2011,47(4):75-90. Feng Qisheng, Gao Xinghua, Huang Xiaodong, et al. Remote sensing dynamic monitoring of grass growth in Qinghai-Tibet plateau from 2001 to 2010[J]. Journal of Lanzhou University Natural Sciences, 2011, 47(4): 75-90. (in Chinese with English abstract)
[25] 南鋒,朱洪芬,畢如田. 黃土高原煤礦區復墾農田土壤有機質含量的高光譜預測[J]. 中國農業科學,2016,49(11):2126-2135. Nan Feng, Zhu Hongfen, Bi Rutian. Hyperspectral prediction of soil organic matter content in the Reclamation cropland of Coal Mining Areas in the Loess Platesu [J]. Scientia Agricultura Sinica, 2016, 49(11): 2126-2135. (in Chinese with English abstract)
[26] Song C. Optical remote sening of forest leaf area index and biomass[J]. Progress in Physical Geography, 2013, 37(1): 98-113.
[27] 吳繼忠,吳瑋. 基于GPS-IR的美國中西部地區NDVI時間序列反演[J]. 農業工程學報,2016,32(24):183-188. Wu Jizhong, Wu Wei. Retrieving NDVI in Midwestern America using GPS-interferometric reflectometry[J]. Transactions of the Chinese Society of Agricultural Engineering (Transactions of the CSAE), 2016, 32(24): 183-188. (in Chinese with English abstract)
[28] 郭志華,彭少麟,王伯蓀. 利用TM數據提取粵西地區的森林生物量[J]. 生態學報,2002,22(11):1832-1839. Guo Zhihua, Peng Shaolin, Wang Bosun. Estimating forest biomass in western Guangdong using landsat TM data[J]. Acta Ecologica Sinica, 2002, 22(11): 1832-1839. (in Chinese with English abstract)
[29] 馮仲科,劉永霞. 森林生物量測定精度分析[J]. 北京林業大學學報,2005,27(增刊2):108-111. Feng Zhongke, Liu Yongxia. Precision analysis of forest biomass measuring[J]. Journal of Beijing Forestry University, 2005, 27(S2): 108-111. (in Chinese with English abstract)
[30] 徐小軍,杜華強,周國模,等. 基于遙感植被生物量估算模型自變量相關性分析綜述[J]. 遙感技術與應用,2008,23(2):239-247. Xu Xiaojun, Du Huaqiang, Zhou Guomo, et al. Review on correlation analysis of independent variables in estimation models of vegetation biomass based on remote sensing[J]. Remote Sensing Technology and Application, 2008, 23(2): 239-247. (in Chinese with English abstract)
Remote sensing inversion models and validation of aboveground biomass in soybean with introduction of terrain factors in black soil area
Zhang Xinle1, Xu Mengyuan1, Liu Huanjun1,2※, Meng Linghua1, Qiu Zhengchao1, Pan Yue1, Xie Yahui1
(1. College of Resources and Environmental Sciences, Northeast Agricultural University, Harbin 150030, China; 2. Northeast Institute of Geography and Agroecology, Chinese Academy of Sciences, Changchun 130012, China)
Crop biomass plays an important role in food security and global carbon cycle. Achieving the timely and accurate monitoring of biomass is vital for precise and reasonable agricultural management. Undoubtedly, remote sensing technique has been proven to be an effective tool for biomass estimation. Along with traditional means, it reduces the actual operation and investigation of ground surveys. In ordered to accurately estimate the crop aboveground biomass at the field scale and improve the precision and stability of soybean aboveground biomass inversion model, this paper obtained SPOT-6 6-meter multi-spectral data on July and August 2016 of the study area, as well as the soybean aboveground biomass of different terrain slopes. At the same time, the terrain data of the study area were measured and the topographic factors such as elevation, slope and aspect were extracted. We intended to use above measured data to build three models, which were the traditional linear regression model, the multiple regression model and the neural network model. Firstly, the correlation of the relationships between enhances vegetation index (EVI), normalized difference vegetation index (NDVI) and observed date of soybean aboveground biomass were analyzed by linear regression model. Then we added the terrain factors which were related to the aboveground biomass for establishing multilayer perception stepwise multiple regression and neural network inversion model. Through the model accuracy comparison and estimation accuracy analysis, the results were following: 1) In the linear regression model established by the two vegetation indexes, NDVI Model fitting degree was higher then EVI, and the coefficient of determination (R2) reached 0.712, plus root mean square error (RMSE) was 0.116 kg/m2. The results could be explained that the use of traditional single vegetation index model to predict soybean aboveground biomass was feasible. 2) The neural network multilayer sensor model had the highest precision and reliability among all above (R2= 0.904, RMSE = 0.047 kg/m2). The results of model validation showed that the average absolute and relative error of using neural network model were the smallest, and the values were 0.113 kg/m2 and 0.212, respectively. In the three types of inversion models, the inversion results of the neural network model were closest to the actual data of crop aboveground biomass distribution. The inversion results of this study were in good agreement with the terrain, topography, temperature and precipitation characteristics of the plot and accurately reflected the space distribution features of crop condition and growth. Our research provided a reliable and scientific basis for dynamic monitoring and precise management of soybean aboveground biomass. The method was meaningful in precision agriculture, especially in yield and production prediction.
remote sensing; crops; models; soybean; aboveground biomass; terrain factors
10.11975/j.issn.1002-6819.2017.16.022
TP79;S127
A
1002-6819(2017)-16-0168-06
張新樂,徐夢園,劉煥軍,孟令華,邱政超,潘 越,謝雅慧. 引入地形因子的黑土區大豆干生物量遙感反演模型及驗證[J]. 農業工程學報,2017,33(16):168-173.
10.11975/j.issn.1002-6819.2017.16.022 http://www.tcsae.org
Zhang Xinle, Xu Mengyuan, Liu Huanjun, Meng Linghua, Qiu Zhengchao, Pan Yue, Xie Yahui. Remote sensing inversion models and validation of aboveground biomass in soybean with introduction of terrain factors in black soil area[J]. Transactions of the Chinese Society of Agricultural Engineering (Transactions of the CSAE), 2017, 33(16): 168-173. (in Chinese with English abstract) doi:10.11975/j.issn.1002-6819.2017.16.022 http://www.tcsae.org
2017-04-23
2017-06-13
國家自然科學基金項目(41671438;41501357);“中國科學院東北地理與農業生態研究所 ”引進優秀人才項目
張新樂,女,黑龍江雞西人,副教授,博士。主要研究方向:生態遙感。哈爾濱 東北農業大學資源與環境學院,150030。
Email:xinlezhang@yeah.net
※通信作者:劉煥軍,男,黑龍江穆棱人,副教授,博士,博士生導師。主要研究方向:地物高光譜遙感。哈爾濱 東北農業大學資源與環境學院,150030。Email:huanjunliu@yeah.net
猜你喜歡
童話王國·奇妙邏輯推理(2024年5期)2024-06-19 16:03:38
今日農業(2022年16期)2022-11-09 23:18:44
中國化肥信息(2022年5期)2022-08-30 01:58:26
今日農業(2021年20期)2021-11-26 01:23:56
今日農業(2021年14期)2021-10-14 08:35:34
中學生數理化·七年級數學人教版(2020年10期)2020-11-26 08:24:50
數學物理學報(2020年2期)2020-06-02 11:29:24
下一代英才(酷炫少年)(2018年6期)2018-07-09 03:17:44
光學精密工程(2016年6期)2016-11-07 09:07:19
核科學與工程(2015年4期)2015-09-26 11:59:03