Optimization of Depolymerization Process of Polymeric Proanthocyanidins from the Barks of Pinuskesiya var. langbianensis
2017-03-27 02:58:51LiNaJiangYongxinLiMeijuanLuoXuluLiuYunKanHuanZhangJiayanZhaoPing
林業科學 2017年2期
Li Na Jiang Yongxin Li Meijuan Luo Xulu Liu Yun Kan Huan Zhang Jiayan Zhao Ping
(1.Southwest Forestry University Yunnan Key Laboratory of Wood Adhesives and Glue Products Kunming 650224; 2.Southwest Forestry University Key Laboratory for Forest Resources Conservation and Use in the Southwest Mountains of China,Ministry of Education Kunming 650224; 3.College of Materials Engineering,Southwest Forestry University Kunming 650224)
?
Optimization of Depolymerization Process of Polymeric Proanthocyanidins from the Barks ofPinuskesiyavar.langbianensis
Li Na1,2Jiang Yongxin1,2Li Meijuan1,3Luo Xulu1,2Liu Yun2Kan Huan2Zhang Jiayan3Zhao Ping1,2
(1.SouthwestForestryUniversityYunnanKeyLaboratoryofWoodAdhesivesandGlueProductsKunming650224; 2.SouthwestForestryUniversityKeyLaboratoryforForestResourcesConservationandUseintheSouthwestMountainsofChina,MinistryofEducationKunming650224; 3.CollegeofMaterialsEngineering,SouthwestForestryUniversityKunming650224)
【Objective】 (-)-epicatechin-(4β-8)-(-)-epigallocatechin 3-O-gallate (1) was found to be the main depolymerized product of polymeric proanthocyanidins (PPC) from the pine barks with tea polyphenols (TP), and showed higher DPPH and ABTS+radical scavenging activities than both PPC and TP. In order to provide the basis for further development and utilization of depolymerized product of PPC, the objective of this study was to optimize the depolymerization process of PPC from the barks ofPinuskesiyavar.langbianensiswith TP, by using the content of 1 as an evaluation indicator. 【Method】The content of compound 1 in reacted solution was analyzed by HPLC, and the effects of reaction temperature (50-90 ℃), reaction time (30-180 min), HCl concentration (0.1%-5%) and TP/PPC ratio (1∶3-3∶1,w/w) on the content of 1 were investigated by single factor experiments. The depolymerization process was optimized using response surface methodology, at a five-level, four-variable experiment central composite rotatable design. Using the content of 1 as response, and above four factors as variables, the twenty-eight experiments were conducted to analyze the response pattern and to establish model for reaction process. The responses obtained from the experimental design set were subjected to multiple nonlinear regression using Design-Expert V8.0.6 software to obtain the coefficients of the second-polynomial model, and its statistical significance was evaluated by variance analysis. 【Result】 The reaction temperature, HCl concentration and TP/PPC ratio strongly affects the content of 1 in the depolymerization reaction. The regression model was very significant (P<0.000 1) with a good coefficient (R2=0.952 6), suggesting that the proposed experimental design was suitable to analysis and to predict the simulation of 1. The optimum depolymerization conditions were as follows: reaction temperature 70 ℃, reaction time 60 min, HCl concentration 1%, and TP/PPC ratio 3∶2. Under the above-mentioned conditions, the experimental content of 1 was 718.57 nmol·mL-1, which was well matched with the predicted content (721.39 nmol·mL-1). 【Conclusion】 It was feasible to use response surface method to optimize the depolymerization process of PPC from the barks of P.kesiyavar.langbianensiswith TP for the production of 1.Key words:Pinuskesiyavar.langbianensisbark; (-)-epicatechin-(4β-8)-(-)-epigallocatechin 3-O-gallate; polymeric proanthocyanidins; depolymerization; response surface methodology
Proanthocyanidins consisting of elementary flavan-3-ol units could be divided into oligomeric proanthocyanidins (OPC) and polymeric proanthocyanidins (PPC). Its physicochemical and biological features depend largely on their structures, particularly on the degree of polymerization (Ursinietal., 2001; Kolodziejetal., 2005). Naturally occurring proanthocyanidins are complicated mixtures of PPC with large molecular sizes, regarded as not being readily absorbed through the intestines. On the other hand, flavan-3-ol monomers, dimers and trimers can be readily transported through a layer of colonic carcinoma cells (Deprezetal., 2001; Holtetal., 2002). Moreover, lower molecular weight OPC showed much stronger bioactivities than both flavan-3-ol monomers and PPC (Maoetal., 2002; Erlejmanetal., 2004). Therefore, it would be beneficial to develop an available source of OPC from PPC by depolymerization process.
In the past few years, the depolymerization of PPC with the user-friendly nucleophiles, such as phloroglucinol, and L-cysteine have been developed in an attempt to obtain new flavan-3-ol conjugates with more potent antioxidant activity (Kennedyetal., 2001; Mitjansetal., 2004; Liuetal., 2013).However, it is questionable as to whether the products resulting from the depolymerization process that used aqueous methanol as reaction solution are suitable to be utilized as food supplement. Tanakaetal. (2007) reported (-)-epicatechin-(4β-8)-(-)-epigallocatechin 3-O-gallate (1) from the depolymerized products ofArecaPPC with (-)-epigallocatechin 3-O-gallate, without using special chemical reagent. Our group also used the tea polyphenols (TP) to react with several PPCs from different plant origins, only in an acidic water solution. As the result, the depolymerized products showed higherinvivoanti-ROS activities than their corresponding PPC (Lietal., 2014). Compound 1 was found to be the main depolymerized product of PPC from pine barks (Jiangetal., 2013), and showed higher DPPH and ABTS+radical scavenging activities than both PPC and TP (Lietal., 2015).However, there is still a lack of information regarding to optimal conditions for the production of 1. This study is to assess the optimal conditions in terms of reaction temperature and time, HCl concentration, and appropriate TP/PPC ratio for the production of 1 in depolymerization process of the PPC from the barks ofP.kesiyavar.langbianensisby using response surface methodology (RSM) (Bashietal., 2012; Albertietal., 2014).
1 Materials and methods
1.1 Materials
PPC with a purity of 98% for proanthocyanidins was prepared from the barks ofP.kesiyavar.langbianensisin our laboratory previously (Lietal., 2015), and TP was purchased from Tangren Biological Technology Development Co. LTD (Honghe, Yunnan, China). All materials were stored in 4 ℃ until use.1.2 Chemicals and solvents
Compound 1 with a purity of 99% was isolated from the depolymerized products of PPC from the barks ofP.kesiyavar.langbianensiswith TP, and its structure was identified on the basis of spectroscopic analysis, including MS,1H and13C NMR, and comparison with literature data (Lietal., 2015). Water was purified in a Milli-Q (Millipore, America), and acetonitrile (CH3CN) with HPLC grade was purchased from Merck (Darmstadt, FR, Germany). The other chemicals and solvents used were of analytical grade.
1.3 HPLC analysis of 1
Analytical HPLC was operated on a Agilent 1200 series separation module combined with the accessory of the Agilent G1315D diode array detector (Agilent, America), using an Agilent Analytical Eclipse XDB-C18column (4.6 mm × 150 mm, i.d., 5 m). The mobile phase was composed of solvent A (H2O, 0.34% H3PO4) and solvent B (CH3CN, 0.34% H3PO4). All solutions were degassed in an ultrasonic bath and filtered through a hydrophilic polypropylene membrane before use. The following gradient was applied: 4%-25% B (0-15 min), 25%-90% B (15-18 min), 90%-95% B (18-20 min), followed by an isocratic run at 95% B (4 min) and reconditioning of the column (4% of B, 5 min). The flow rate of the mobile phase was 1.0 mL·min-1, the detection wavelength was set to 280 nm, and analysis was carried out at 30 ℃.
Standard stock solution of 1 (4.5 mg·mL-1) in methanol were prepared immediately, and standard working solutions used for the calibration were prepared by diluting the standard stock solution with methanol to the desired concentrations. Good linearity of the calibration curve for the 1 was achieved with correlation coefficient of 0.999 8, and the results were expressed as nmol·mL-1of 1. An aliquot (1 mL) of the reaction solution was filtered through a 0.45 μm syringe filter, and 10 μL of the sample were injected to HPLC analysis.
1.4 Effect of reaction temperature on the content of 1
Five centrifuge tubes (1.5 mL), each containing 100 μL of PPC (10 mg·mL-1), 100 μL of TP (10 mg·mL-1) and 800 μL of 1% HCl were kept in water bath for 30 min at 50, 60, 70, 80 and 90 ℃, respectively. Then, the reaction mixture was applied to HPLC analysis. The resulted reaction temperature with the highest content of 1 was fixed for the next experimental step.
1.5 Effect of reaction time on the content of 1
The same mixture of PPC (10 mg·mL-1), TP (10 mg·mL-1) and 1% HCl as mentioned above, in five centrifuge tubes (1.5 mL) were kept in water bath at 60 ℃ for 30, 60, 90, 120 and 180 min, respectively. After the HPLC analysis, the reaction time with the highest content of 1 was fixed for the next step.
1.6 Effect of HCl concentration on the content of 1
To five centrifuge tubes (1.5 mL), each containing 100 μL of PPC (10 mg·mL-1) and 100 μL of TP (10 mg·mL-1), 800 μL of HCl with different concentration of 0.1%, 0.2%, 0.5%, 1%, 2% and 5% were added, respectively. The reaction mixtures were kept in water bath at 60 ℃ for 90 min. After the HPLC analysis, the HCl concentration with the highest content of 1 was fixed for the next experiment.
1.7 Effect of TP/PPC ratio on the content of 1
Five different TP (10 mg · mL-1) and PPC (10 mg · mL-1) ratios of 1∶3, 1∶2, 1∶1, 2∶1 and 3∶1 (each 200 μL) were added respectively to five centrifuge tubes (1.5 mL), containing 800 μL of 2% HCl. Then, the reaction mixtures were kept in water bath at 60 ℃ for 90 min. After the HPLC analysis, the TP/PPC ratio with the highest content of 1 was fixed for the next experiment.
1.8 Experimental design
A five-level, four-variable central composite rotatable design (CCRD) was employed for optimization with respect to four important variables, the reaction temperature (A), reaction time (B), HCl concentration (C) and TP/PPC ratio (D). The variables and their levels investigated in this study are represented in
Tab. 1.

Tab. 1 Variables and their levels employed in a CCRD
The independent variables and their ranges were chosen, based on preliminary experiment results. A second-order quadratic equation was then fitted to the data by multiple regression procedure. For a four-factor system, the model equation is:
(1)
WhereYis the content of 1 response (nmol·mL-1), predicted response;β0,is the intercept;β1,β2,β3,β4, are linear coefficients;β12,β13,β14,β23,β24,β34,interactions coefficients;β11,β22,β33,β44,are squared coefficients.
Tab.2 lists the actual experimental parameters corresponding to the designed levels. The twenty-eight experiments were conducted to analyze the response pattern and to establish model for reaction process. All experiments were carried out randomly. Six replicates (treatments 23-28) of the design were used to allow for estimation of a pure error sum of squares. Regression analysis was performed on the data of the content of 1.
The responses obtained from the experimental design set (
Tab.2) were subjected to multiple nonlinear regression using Design-Expert V8.0.6 software, to obtain the coefficients of the second- polynomial model. The quality of the fit of the polynomial model equation was expressed by the coefficient of determinationR2, and its statistical significance was checked by anF-test. The significance of the regression coefficient was tested by at-test.
1.9 Statistical analysis
All determinations were carried out in triplicate, and the experimental results obtained were expressed as means ± SD. Statistical analysis was performed by using Design-Expert V8.0.6 software. Data were analyzed by analysis of variance, and the mean values were considered significantly different whenP<0.05. The optimal extraction conditions were estimated through three-dimensional response surface analyses of the four independent variables and each dependent variable.
2 Results and discussion
2.1 Effects of reaction temperature, reaction time, HCl concentration and TP/PPC ratio on the content of 1
The effect of reaction temperature on content of 1 is presented in
Fig.1a. When temperature increased from 50 to 60 ℃, the content of 1 increased from 300.98 to 552.37 nmol·mL-1. However, when reaction temperature exceeded 60 ℃, the content of 1 decreased sharply, to only 130.99 nmol·mL-1at 90 ℃. The content of 1 was investigated with fixed reaction temperature (60 ℃) at different reaction time (
Fig.1b). A significant increase of 1 content was observed before 90 min, and the maximum content of 1 (582.40 nmol·mL-1) was observed at 60 ℃ in 90 min.
The effects of different HCl concentrations on content of 1 with fixed reaction temperature (60 ℃) and time (90 min) are shown in
Fig.1c. Concentration of HCl that resulted in improved content of 1 included 0.1%, 0.2%, 0.5% and 1%. No further content enhancement was gained at 5% of HCl concentration. The highest yield of 1 is obtained at 2% HCl, with a content of 727.73 nmol·mL-1at 60 ℃ in 90 min.
Fig.1d shows the effect of TP/PPC ratio on the content of 1. A significant increase of 1 was observed over the TP/PPC ratio range of 1∶3-1∶1, and the content of 1 reached a maximum of 545.00 nmol·mL-1at 1∶1.

Fig.1 Effects of reaction temperature (a), reaction time (b), HCl concentration (c), and TP/PPC ratio (d) on the content of 1The line graph represents the standard deviation (n=3). Values marked by the same letters are not significantly different (P<0.05).
2.2 Optimization of reaction conditions
Based on the investigation of the effects of reaction temperature (A), reaction time (B), HCl concentration (C) and TP/PPC ratio (D) on content of 1, these variables were considered in the experimental design. To optimize the depolymerization process of PPC with TP, a reaction temperature of 60 ℃, reaction time of 90 min, HCl concentration of 2%, and TP/PPC ratio of 1∶1 were chosen as the central condition of the CCRD.
Tab.2 shows the experimental conditions and the results of reactions, according to the factorial design. The second-order regression model relating to the content of 1, with the independent variables of A, B, C and D, is as follows:
(2)
The content of 1 obtained was considered as the dependent variables or responseY. For testing the fit of the model, the regression equation and coefficient (R2) were evaluated. The model presented a high determination coefficient (R2=0.952 6), explaining 95.26% of the variables, and the reaction temperature (A), reaction time (B), HCl concentration (C) and TP/PPC ratio (D) were supported by the response. The closer the value ofR2to unity, the better was the empirical model fits for the actual data. A value greater than 0.75 indicates aptness of the model, suggesting that the proposed experimental design was suitable for the simulation of 1. The ANOVA of quadratic regression model demonstrated that the model was highly significant. Values of “Prob>F” less than 0.050 0 indicate that model terms are significant. In this case, A, C, D, AB, AC, BC and A2are significant terms.

Tab. 2 Experimental design of five-level, four-variable CCRD①
①Data are expressed as the mean (n=3) ± SD.
The studentt-distribution and the correspondingP-values, along with the second-order polynomial coefficient, were evaluated. The significance of each coefficient was determined byt-values andP-values. The pattern of interactions between the variables was indicated by these coefficients, whereas the others can be neglected and eliminated from the model. Larger magnitude oft-value and smallerP-value indicate the high significance of the corresponding coefficient. Thet-test andP-values for the linear, quadratic, and interactive terms are shown in
Tab.3.

Tab. 3 Variance analysis for the second-order content of 1①
①A: Reaction temperature (℃); B: Reaction time (min); C: HCl concentration (%); D: TP/PPC ratio. df: Degree of freedom.
To determine optimal levels of the variables for the depolymerization process, three-dimensional surface plots were constructed, according to Eq. (2).
Fig.2 shows the effect of reaction temperature and reaction time on the content of 1. The content of 1 increased rapidly with the increase of temperature at a fixed reaction time, and nearly reached a peak at the highest temperature tested. Similarly, the increase in reaction time at a fixed reaction temperature led to a gradual increase in content of 1, and reached to a maximum at the longest reaction time tested. The effect of reaction temperature and HCl concentration shown in
Fig.3 demonstrated that 1 increased slowly with the increase of temperature at a fixed HCl concentration, while an increase in HCl concentration at a fixed temperature also led to a marked increase in content of 1.
Fig.4 reflects the effect of reaction time and HCl concentration on the depolymerization process. The content of 1 increased slowly with the increase of reaction time at a fixed HCl concentration, and an obvious increase of 1 with the increase of HCl concentration at a fixed time was observed.
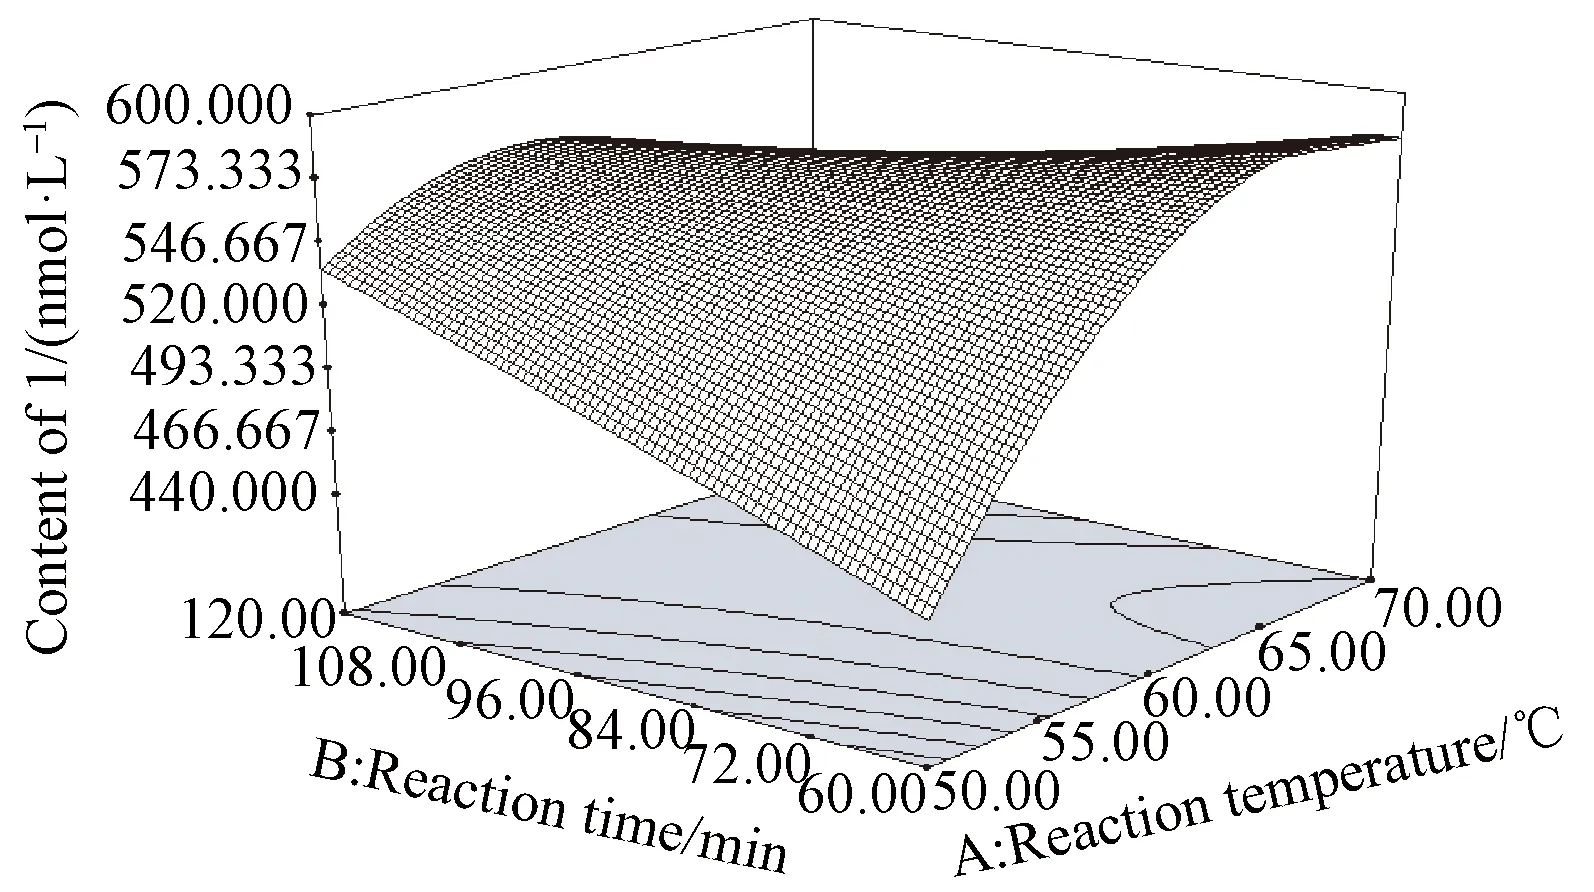
Fig.2 3D response surface plot showing the effect of reaction temperature (℃) and reaction time (min) on the content of 1
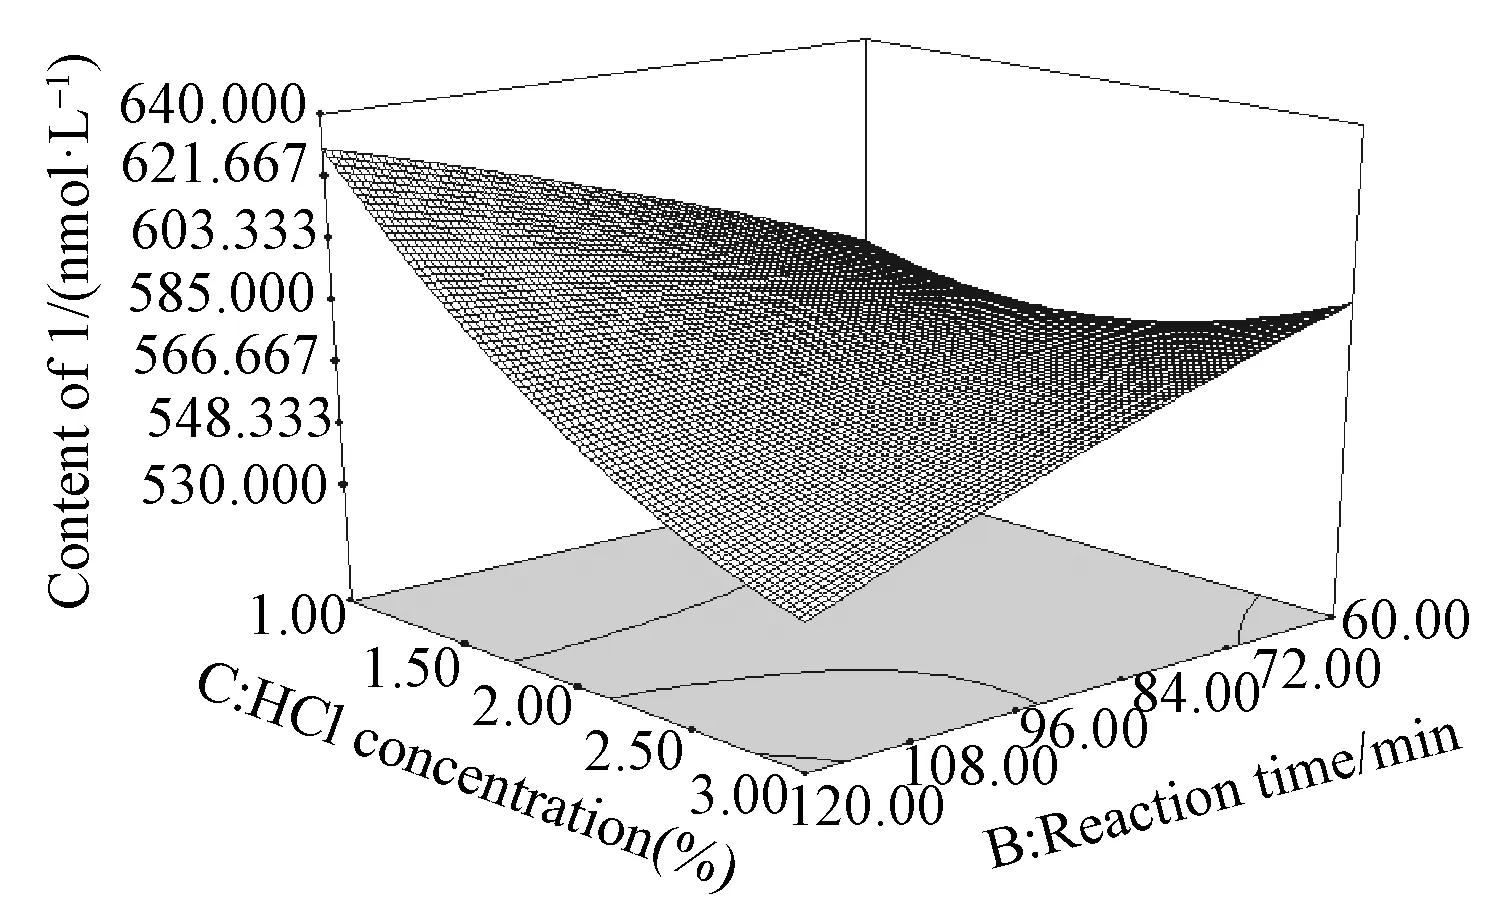
Fig.4 3D response surface plot showing the effect of reaction time (min) and HCl concentration (%) on the content of 1
The optimal conditions obtained using the model were as the follows: 70 ℃ of reaction temperature, 60 min of reaction time, 1% of HCl concentration, and 3∶2 of TP/PPC ratio. Under optimal conditions, the model predicted a maximum response of 721.39 nmol·mL-1of 1. To compare the predicted result with the practical value, experimental rechecking was performed using this deduced optimal condition. A mean value of 718.57 nmol·mL-1of 1 obtained from real experiments validated the RSM model. The good correlation between these results confirmed that the response model was adequate to reflect the expected optimization.
3 Conclusion
This present study indicates that depolymerization process can be a good method of depolymerizing PPC from the barks ofP.kesiyavar.langbianensisinto 1. The reaction temperature, HCl concentration and TP/PPC ratio strongly affects the content of 1, a principal product in the depolymerization reaction. The optimal conditions obtained by RSM under depolymerization process include the following parameters: reaction temperature, 70 ℃; reaction time, 60 min; HCl concentration, 1%; and TP/PPC ratio, 3∶2.
Reference
Alberti A, Zielinski A A F, Zardo D M,etal. 2014. Optimatisation of the extraction of phenolic compounds from apples using response surface methodology. Food Chem, 149: 151-158.
Bashi D S, Mortazavi S A, Rezaei K,etal. 2012. Optimization of ultrasound-assisted extraction of phenolic compounds from Yarrow (Achilleabeibrestinii) by response surface methodology. Food Sci Biotechnol, 21(4): 1005-1011.
Deprez S, Mila I, Huneau J F,etal. 2001. Transport of proanthocyanidin dimmer, trimer, and polymer across monolayer of human intestinal epitherial Caco-2 cells. Antioxid Redox Signal, 3(6): 957-967.
Erlejman A G, Verstraeten S V, Fraga C G,etal. 2004. The interaction of flavonoids with menbranes: potential determinant of flavonoid antioxidant effects. Free Radic Res, 38(12): 1311-1320.
Holt R R, Lazarus S A, Sullards M C,etal. 2002. Procyanidin dimer B2[epicatechin-(4β-8)-epicatechin] in human plasma after the consumption of flavanol-rich cocoa. Am J Clin Nutr, 76(4): 798-804.
Jiang Y X, Zhu H T, Wang J M,etal. 2013. LC-ESI-MS Analysis of fragmentive products of pine bark proanthocyanidins. Chem Indus Forest Prod, 33(4): 117-120. [in Chinese]
Kennedy J A, Jones G P. 2001. Analysis of proanthocyanidin cleavage products following acid-catalysis in the presence of excess phloroglucinol. J Agric Food Chem, 49(4): 1740-1746.
Kolodziej H, Kiderlen A F. 2005. Antileishmanial activity and immune modulatory effects of tannins and related compounds onLeishmaniaparasitized. Phytochemistry, 66(17): 2056-2071.
Li M J, Lao Q C, Jiang Y X,etal. 2014.Invivoanti-ROS activities of the fragmentive products of several proanthocyanidins. J West China Forestry Sci, 43(1): 99-103. [in Chinese]
Li N, Dan H L, Jiang Y X,etal. 2015. Identification and activities of the fragmented product of polymeric proanthocyanidins from pine barks. J West China Forestry Sci, 44(5): 76-80. [in Chinese]
Liu H W, Zou T, Gao J M, et al. 2013. Depolymerization of cranberry procyanidins using (+)-catechin, (-)-epicatechin, and (-)-epigallocatechin gallate as chain breakers. Food Chem, 141(1): 488-494.
Mao T K, Van De Water J, Keen C L,etal. 2002. Effect of cocoa flavanols and their related oligomers on the secretion of interleukin-5 in peripheral blood mononuclear cells. J Med Food, 5(1): 17-22.
Mitjans M, Del Campo J, Abajo C,etal. 2004. Immunomodulatory activity of a new family of antioxidants obtained from grape polyphenols. J Agric Food Chem, 52(24): 7297-7299.
Tanaka T, Yoshitake N, Zhao P,etal. 2007. Production of oligomeric proanthocyanidins by fragmentation of polymers. Jpn J Food Chem, 14(3): 134-139.
Ursini F, Rapuzzi I, Toniolo R,etal. 2001. Characterization of antioxidant effect of procyanidins. Method Enzymol, 335: 338-350.
(責任編輯 石紅青)
思茅松樹皮多聚原花青素降解優化*
李 娜1,2姜永新1,2李美娟1,3羅旭璐1,2劉 云2闞 歡2張加研3趙 平1,2
(1.西南林業大學 云南省木材膠黏劑及膠合制品重點實驗室 昆明 650224; 2. 西南林業大學 西南山地森林資源保育與利用省部共建教育部重點實驗室 昆明 650224; 3. 西南林業大學材料工程學院 昆明 650224)
【目的】 以基于茶多酚的思茅松樹皮多聚原花青素降解反應中(-)-表兒茶素-(4β-8)-(-)-表沒食子兒茶素 3-O-沒食子酸酯(化合物1)的含量作為評價指標,確定思茅松樹皮多聚原花青素的最佳降解條件,為思茅松樹皮多聚原花青素降解產物的進一步開發利用提供基礎。【方法】 采用HPLC定量分析方法測定各反應溶液中化合物1的含量,通過單因素試驗考察反應溫度(50~90 ℃)、反應時間(30~180 min)、鹽酸濃度(0.1%~5%)和茶多酚/多聚原花青素比率(1∶3~3∶1,w/w)對化合物1生成的影響。采用4因素5水平中心組合旋轉設計的響應面法優化其降解條件,以化合物1的含量為響應值,以上述4個因素為自變量,利用Design-Expert V8.0.6軟件對28個試驗點測定所得數據進行多元非線性分析,建立回歸模型,并通過方差分析對模型進行顯著性檢測。【結果】 反應溫度、鹽酸濃度和茶多酚/多聚原花青素比率明顯影響降解反應中化合物1的生成,建立的回歸模型極顯著(P<0.000 1),且線性系數良好(R2=0.952 6),說明建立的數學模型能較好地描述試驗結果,可用于分析和預測化合物1的生成。思茅松樹皮多聚原花青素的最佳降解條件為反應溫度70 ℃、反應時間60 min、鹽酸濃度1%和茶多酚/多聚原花青素比率3∶2。經驗證此條件下反應液中化合物1的濃度可達718.57 nmol·mL-1,與理論值(721.39 nmol·mL-1)較為接近。【結論】 采用中心組合旋轉設計的響應面法分析優化思茅松樹皮多聚原花青素降解以獲取主產物(-)-表兒茶素-(4β-8)-(-)-表沒食子兒茶素 3-O-沒食子酸酯的方法可行。
思茅松樹皮; (-)-表兒茶素-(4β-8)-(-)-表沒食子兒茶素3-O-沒食子酸酯; 多聚原花青素; 降解; 響應面法
TQ351.5
A
1001-7488(2017)02-0110-07
10.11707/j.1001-7488.20170213
Received date: 2015-11-11; Revised date: 2016-03-03.
Funding Project: National Natural Science Foundation of China(31260163); Yunnan Provinical Department of Education Research Fund(ZD2010006).
*Zhao Ping is corresponding author.
