Influence of Excitation Location on Sound Radiation of a Simple Duct Excited by Sound Source
2015-12-12 08:52:20ZHENGHanZHOUQidouDUANJiaxi
船舶力學 2015年6期
ZHENG Han,ZHOU Qi-dou,DUAN Jia-xi
(Dept.of Naval Architecture Engineering,Naval Univ.of Engineering,Wuhan 430033,China)
0 Introduction
It is very meaningful to analyze the acoustic radiation characteristics for ducts excited by sound source,especially for the acoustic optimization design of duct structures[1-3]such as aircraft engines,pump jet propulsors and ducted propellers.Previous researchers mainly concerned such factors as duct cross-section geometry,terminal boundary condition and flow rate of medium[4-7],rather than acoustic excitation location.
However,the excitation location may have great influence on structural vibration and sound radiation.Hu and Tang[8]discussed the impact of excitation location on radiated sound power of bulkheaded finite cylindrical shell,revealing that the effects of location must be taken into account at low frequencies when the acoustic wavelength in water is longer than half the cylindrical shell length.Gao and Chen[9]studied the effects of excitation location on vibration and sound radiation characteristics of a finite truncated conical shell.They found that when dipole source is at the center of shell’s section,the vibration and sound radiation of the shell are smaller than those at asymmetrical place.
In this paper,the radiated sound power and sound field contours of a simple rigid duct are studied,using a method based on NASTRAN infinite element technology.The influence of source’s radial and axial location on sound radiation is discussed for monopole and dipole source respectively.
1 Calculation model
As is shown in Fig.1,a simple rigid duct of radius a and length L is immersed in water.The duct encloses a sound source with its radial location r and axial location x.The source strength is 1 kg/s2and excitation frequency band 0-4 000 Hz.

Fig.1 Geometry and FE model of duct
In Ref.[10],Zheng presented a method for duct acoustics based on NASTRAN infinite element technology,pointing out its advantages are that it can be used for all multi-domain problems,dealing with arbitrary complex duct sections and shapes,and considering the vibration of duct walls.It also described the FE modeling and parameters setting for calculation in detail.Using this method,the influence of excitation location on sound radiation of duct will be studied.What worth mentioning is that the vibration of duct wall should be considered for ducts under water.However,the duct is assumed rigid in this paper,in order that only the location factor considered.
For studies of the influence of radial location,the duct length L=1 m and the radius a=0.5 m.The source is located at the cross-section x=0,and r=0,0.1a,0.3a,0.5a,0.8a.For the influence of axial location,L=4 m,a=0.5 m.The source is located on the axis of duct r=0,and x=0,-0.125L,-0.25L,-0.375L.
The radiated sound power W and power level LWof duct can be acquired by integrating on an artificial surface of a closed sphere:

where N is the number of elements of the sphere surface,piand viare the average sound pressure and velocity of the ith element.The notation‘-’represents the conjugate.Wrefis the power reference at 10-12W.By processing the displacements and velocities of sound field nodes acquired by NASTRAN,and programming using FORTRAN language,the radiated power can be obtained.
2 Monopole source excitation
2.1 Effects of radial position
As is shown in Fig.2,the radiated power curves of duct excited by monopole of different radial locations is drawn,with non-dimensional wave number k*=ka on the horizontal axis and radiated power level LWon the vertical.The incident field power of monopole is also given for comparison.Through observation some results could be obtained:
(1)Compared with curves of r=0,r≠0(r=0.1a,0.3a,0.5a,0.8a)has more peaks.When k*is between 0 and 5,curve of r=0 has two peaks located at k*=1.05,4.06,while r≠0 has another three peaks at k*=2.18,3.31,4.44.Since one peak corresponds to one wave mode inside the duct,we can obtain more information of power curves by drawing the interior sound field contour.Fig.3 shows the contours of different radial locations of monopole,it can be found that when k*=1.05 and 4.06,the shape of contours r≠0 are the same as r=0,only radial wave modes appear at the duct termination.When k*=2.18,3.31 and 4.44,contours of r≠0 are different from those of r=0,where circumferential modes appear and the mode number is 2,4 and 6 respectively.That is to say,when the radial location is not at the center,the circumferential wave modes of duct will appear,with the radial ones unchanged.In addition,as the monopole moves towards duct wall,the circumferential modes appear easier(r=0.8a),while some circumferential modes may not appear when the monopole gets close to the center.It is because of this in Fig.2,curve of r=0.8a has the maximum number of peak,while r=0.1a has the minimum.
(2)Power curves with different r have the same peak location,which is especially obvious for low and medium frequencies.This is because that the location of peak’s wave number only depends on the intrinsic properties of duct,and has nothing to do with the source location.The change of source locations only results in a new circumferential mode,or to increase its likelihood to appear,but it will never change the peak location of power curves.

Fig.2 Radiated sound power curves of duct with different radial positions of monopole

Fig.3 Interior sound field contours of duct with different radial location of monopole
(3)The bigger r is,the bigger peak value of sound power is.Curve of r=0.8a has the biggest peak value in all the curves.This is because as the monopole gets closer to the duct wall,the interior sound field is less symmetric,and the proportion of cancelling out of sound wave due to opposite phase becomes smaller,thus the radiated sound power becomes bigger.
Take r=0.8a as an example to illustrate the influence of radial location of monopole on the symmetrical characteristic of exterior sound field.Fig.4 shows the exterior sound field contours of r=0.8a when wave number k*takes different values.The maximum radius of sound field is 10 m.
It can be seen that when k*takes the values corresponding to the peaks of the power curves(k*=1.05,2.18,3.31,4.44),the interior sound field contours of duct appear to be circumferentially symmetric,thus the exterior sound field contours will also be symmetric.However,when k*takes the values corresponding to the valley of the power curves(k*=1.77,2.90,3.75,5.35),the wave mode inside the duct is random,resulting in an asymmetric exterior sound field.What is more,as the frequency increases,the shape of exterior sound field becomes more complex,hence the asymmetry becomes more obvious.

Fig.4 Exterior sound field contours of duct with different wave number of monopole(r=0.8a)
2.2 Effects of axial position
As is shown in Fig.5,the radiated power curves of duct excited by monopole of different axial location are drawn.Compared with Fig.2,it can be seen that the axial location of source has little effect on the radiated sound power.There is not much difference in the peak’s number,location and value among different curves.This is especially prominent for three main peaks(k*=0.6,3.9,7.2),of which the location and value are almost the same.

Fig.5 Radiated sound power curves of duct with different axial position of monopole
Fig.6 shows the exterior sound field contours of x=-0.375L when wave number k*takes different values.It can be seen that the contours do not have symmetry with respect to x=0 plane,which indicates the change of axial location may not change the overall radiated acoustic energy,but affects the distribution of energy.Energy radiated from two duct terminations is different.

Fig.6 Exterior sound field contours of duct with different wave number of monopole(x=-0.375L)
3 Dipole source excitation
Unlike monopole source,the dipole source is directional,depending on the direction vector that connects the two monopoles.Therefore,the discussion below will be split into three parts-axial dipole,azimuthal dipole and radial dipole(Fig.7).On account that the axial location of monopole has little effect on radiated power,and dipole is composed of two monopoles,this section will only discuss the effects of radial location.

Fig.7 Three kinds of dipole source
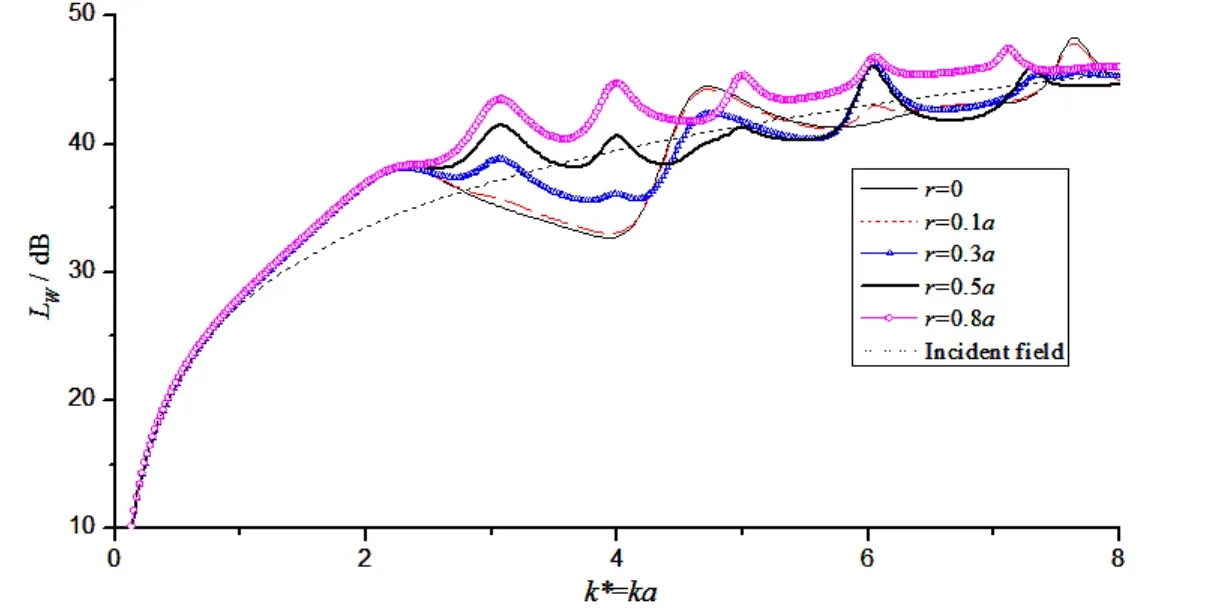
Fig.8 Radiated sound power curves of duct with different radial position of axial dipole
3.1 Axial dipole
Fig.8 shows the radiated power plots when axial dipole locates at different radial positions.The incident field power of dipole is also given for comparison.Same conclusions as section 2.1 could be obtained:(1)Compared with curves of r=0,r≠0 has more peaks because the circumferential modes appear when dipole source moves towards the duct wall.(2)Power curves with different r have the same peak location,indicating changes in the dipole source locations will not affect the peak locations of power curves.(3)The bigger r is,the bigger peak value of sound power is.
Figs.9 and 10 give the interior and exterior sound field contours of duct respectively when k*=3.07(the first peak of the curves).It can be seen that the wave modes inside the duct are regular when r=0.5a and 0.8a,but the exterior sound field contours are not symmetric.This is different from the results in section 2.1,because the dipole source is directional intrinsically,while the monopole source is not.

Fig.9 Interior sound field contour of duct with different radial location of axial dipole(k*=3.07)

Fig.10 Exterior sound field contours of duct with different radial location of axial dipole(k*=3.07)
3.2 Azimuthal dipole
Fig.11 shows the radiated power plots when azimuthal dipole locates at different radial position.The conclusions are the same as above.The interior sound field contours when k*=3.07(the second peak of the curves)are given.Apparently,the power curves and sound fields contours of azimuthal dipole are totally different from axial dipole,which indicates the orientation of dipole has a significant impact on the sound radiation of duct.

Fig.11 Radiated sound power curves of duct with different radial position of circumferential dipole

Fig.12 Interior sound field contour of duct with different radial location of circumferential dipole(k*=3.32)
3.3 Radial dipole
Fig.13 shows the radiated power plots when radial dipole locates at different radial position.The conclusions(1)and(2)are the same as section 3.1,but the relation between the peak values of radiated power and radial locations of the source is complex.At low frequencies when k*<2,curve of r=0 has the biggest peak value;at middle frequencies when 3<k*<5,r=0.5a has the biggest peak value;at high frequencies when k*>6,r=0.8a has the biggest peak value.
Compare Fig.13 with Fig.11,it can be seen that the shape of curves for azimuthal and radial dipoles are very similar.When k*is between 0 and 6,the peaks appear at the same location(k*=2.19,3.32,4.43,5.54)for these two kinds of dipole.

Fig.13 Radiated sound power curves of duct with different radial position of radial dipole

Fig.14 Interior sound field contours of duct with different radial location of radial dipole
Fig.14(a)gives the interior sound field contours of duct for radial dipole when k*=3.32,it is also similar to the contour of azimuthal dipole(Fig.12),with its circumferential mode number 4.This is because that the direction vector of azimuthal dipole and radial dipole are all on the x=0 plane,which is a circular cross section.When excited at the same frequency,the same wave mode can easily be acquired for azimuthal and radial dipoles,thus the radiated power curves are also the same.
What is different is that one more peak appears at k*=4.07 for radial dipole than for azimuthal dipole.Fig.14(b)gives the interior sound field contours of duct when k*=4.07.The radial wave mode appears with its mode number 2,which is not present for azimuthal dipole.
4 Conclusions
The main conclusions in this paper are as follows:
(1)The radial location of source has an important effect on the radiate sound power of duct for both monopole and dipole sources.As the source moves reversely from the duct’s radial center,some new wave modes may appear,resulting in more peaks on the power curves;the peak location of curves is independent of the source’s location,and it only depends on the intrinsic properties of duct;as the source moves towards the duct wall,the peak of curves becomes bigger.Therefore,it is very critical for researchers to choose proper source location to simulate the blade force for duct structures’acoustic design.
(2)The symmetrical characteristic of sound field contour depends on the source’s frequency when a monopole moves reversely from the duct’s radial center.If the frequency corresponds to the peak of the power curves,the contour will be symmetric;if corresponds to the valley,it will be asymmetric.The asymmetry will be more eminent when frequency increases.
(3)Changes in axial locations may not modify the overall radiated acoustic energy,but affects the distribution of energy.Energy radiated from two duct terminations is different.
(4)The orientation of dipole has a significant impact on the sound radiation of duct,which must be considered.
[1]Zhang Jianhua,Wang Guoqiang.Prediction of hydrodynamic performance of ducted controllable pitch propellers[J].Journal of Ship Mechanics,2002,6(6):18-27.
[2]Wu Baoqiang,Pan Ziying,Xia Xian,et al.Investigation of the hydrodynamic characteristics of body of revolution with stern ring-wing[J].Journal of Ship Mechanics,2003,7(6):54-59.
[3]Wang Xiaoyu,Du Lin,Sun Xiaofeng.A new approach for the acoustic design of aeroengine nacelle with the effect of varying cross-section area[J].Acta Aeronautica Et Astronautica Sinica,2006,27(6):1073-1079.(in Chinese)
[4]Doak P E.Excitation,transmission and radiation of sound from source distributions in hard-walled ducts of finite length(I):The effects of duct cross-section geometry and source distribution space-time pattern[J].Journal of Sound and Vibration,1973,31(1):1-72.
[5]Doak P E.Excitation,transmission and radiation of sound from source distributions in hard-walled ducts of finite length(II):The effects of duct length[J].Journal of Sound and Vibration,1973,31(2):137-174.
[6]Wang K S,Tszeng T C.Propagation and radiation of sound in a finite length duct[J].Journal of Sound and Vibration,1984,93(1):57-59.
[7]Nathalie D,Philippe G.Study of the radiation of acoustic sources in a duct with flow[J].AIAA,1998,98-2203:26-34.
[8]Hu Shimeng,Tang Weilin,Wang Bin,et al.Sound radiation from bulkheaded finite cylindrical shell under the action of multiple random point force[J].Journal of Ship Mechanics,2012,16(9):1085-1098.
[9]Gao Ju,Chen Meixia.Sound and vibration of a truncated conical shell under excitation of dipole source and force[J].Chinese Journal of Ship Research,2011,6(1):46-55.
[10]Zheng Han,Zhou Qidou.A method for duct acoustics based on NASTRAN infinite element technology[J].Journal of Naval University of Engineering,2015,27(1):68-73.(in Chinese)

- 船舶力學的其它文章
- Jacket Effects on Heave,Roll and Pitch Motions of a New Floating Deep-draft Semisubmersible Concept
- Convergence Method for Hydrodynamic Force on Surface Structures with Oblique Boundaries
- Two-dimensional Eulerian-Lagrangian Modeling of Shocks on an Electronic Package Embedded in a Projectile with Ultra-high Acceleration
- Load-Compression Relationship of Incompressible Circular Rubber Pad Bonded between Rigid Plates
- Mechanical Behavior of Flexible Jumper Installation in 3D Space
- Characteristics of Tendon Vortex Induced Vibrations Influenced by Platform Motion