Usage of global navigation systems for detection of dangerous meteorological phenomena
2015-07-06 15:03:47KravchenkoKravchenkoLutsenkoLutsenkoPopov
關(guān)鍵詞:檢測
V F Kravchenko, O V Kravchenko, V I Lutsenko, I V Lutsenko, D O Popov
(1. Kotel’nikov Institute of Radio Engineering and Electronics, Russian Academy of Sciences, Moscow 125009, Russia;2. Usikov Institute of Radiophysics and Electronics, National Academy of Sciences of Ukraine, Kharkov 61085, Ukraine)
?
Usage of global navigation systems for detection of dangerous meteorological phenomena
V F Kravchenko1, O V Kravchenko1, V I Lutsenko2, I V Lutsenko2, D O Popov2
(1.Kotel’nikovInstituteofRadioEngineeringandElectronics,RussianAcademyofSciences,Moscow125009,Russia;2.UsikovInstituteofRadiophysicsandElectronics,NationalAcademyofSciencesofUkraine,Kharkov61085,Ukraine)
The method of dangerous meteorological phenomenon detection using the data of coordinate measurement by receivers of global navigation satellite system (GLONASS) and global positioning system (GPS) is proposed. The possibility of thunderstorm courses and strong clouds detection on data of pseudo-distances and altitudes is shown theoretically and confirmed experimentally.
dangerous meteorological phenomenon; radio-raying; global navigation system; pseudo-range; altitude
0 Introduction
Many atmospheric phenomena are dangerous for aviation and sea transport. And some meteorological values have to be measured very precisely for modern aircraft and ships safety. Therefore, for the needs of the aviation and fleet, it is necessary to introduce the means and methods for calculation of the future state of the meteorological variables (air pressure, wind and air temperature) calculation of movement and evolution of the dangerous synoptic objects such as cyclones, theirs hollows with atmospheric fronts, anticyclones crests, etc. Synoptic processes (atmospheric fronts, heavy convective instability and extremely powerful progress of cumulonimbus cloudiness) lead to appearance of some dangerous meteorological phenomena. At presence of some of the phenomena there are bulk of humidity, ice and sand in the atmosphere. Therefore, the development of new methods for detection dangerous meteorological phenomena using radiation of Earth, artificial satellites and navigation satellites specifically is in great interest[1]. Difference of dielectric properties for that atmosphere parts in which are the dangerous phenomena like cumulonimbus clouds are moisture-laden from standard, can be the background for the dangerous phenomena detection.
1 Results of dangerous meteorological phenomena detection

Table 1 Dielectric parameters of freshwater for frequency 1 590 MHz

t(℃)n′n″09.260.81109.100.58208.910.42308.760.31408.530.23
These data are calculated for mean frequency 1 590 MHz of operating band of GPS (1 575 MHz) and GLONASS (1 602 MHz) systems.
Ice real and imaginary parts of refraction coefficient practically do not depend on wave length (in the centimeter band). Refractive index therewith does not depend on temperature and equals 1.78. The data[3]about temperature dependencen″ are presented in Table 2.
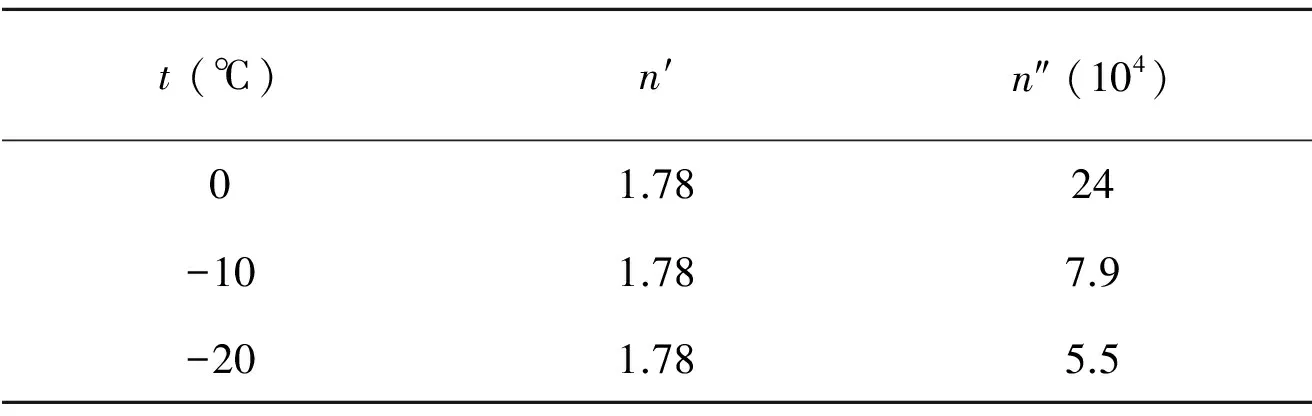
Table 2 Ice dielectric parameters[3]

shown in Table 4.
Table 3 Water content and spatial characteristics of meteorological formations[5]

TypeofformationSize(km)ΔXΔYWatercontent(g/m3) WmaxWFog100-10000.3-2.30.250.88Layeredclouds10001-40.10.4Cumulusclouds10100.41.7Cumulonimbusclouds15-202-10

Table 4 Parameters of rains
The dependence of the water content of the precipitation against their intensity in logarithmic scale[5], as well as linear and parabolic approximation of this dependence is shown in Fig.1.
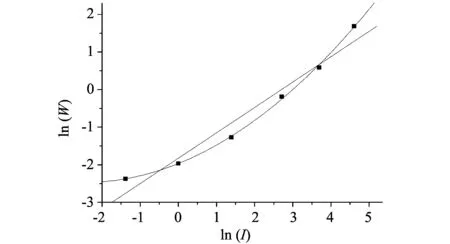
Fig.1 Dependence of water content of heavy rainfall upon intensity
It can be seen that the best results are obtained by the parabolic approximation

ThevaluesofcoefficientsaregiveninTable5.

Table 5 Approximation of water content and intensity of rain
In Table 5,Ris the coefficient of correlational,SDis the RMS error the approximation andNis the number of measurement points.
The correlation coefficient of data is more than 0.99. Empirical expression for the dependence of the water content against precipitation intensity has the form
Spatial correlation function of heavy rain[5]described by the expressionρ(l)=exp(-0.2l). It takes into account the fact that the correlationl0, where the valueρ(l) decreases ine-times relative to the maximum, is approximately 5 km[6]. Maximum amount of precipitationImaxis approximately in 2 times greater than their average intensity.
To account for the influence of meteorological formations on the phase delay and attenuation of the signal, the cloud cover model can be used[7]. In this case, introduced by meteorological formations in the signal per unit length, the dampingγand elongation of electrical path lengthδrdepend on the water content of precipitationWand the values of the real part of the refractive indexn′
γ=10lge×10-3Wn″,
δr=10-3W(n′-1).
The elongation of the electrical length path leads to an additional phase shift propagating through the zone of precipitation waves. Thus, the presence of moisture or dust particles in meteorological hazards affect both the amplitude and the phase delay of the signal received from the satellite. This influence can be detected by measuring the change in the satellite's pseudo-range, coordinates and altitude of the measuring points, as well as the interference pattern of the received field. The change of pseudo-range Δrby passing an electromagnetic wave through a zone with increased moisture reservesWand length Δl0will be Δr=δrΔl0, wherein at small angles the length of the zone will be approximately correspond to its horizontal extent, for heavy rains which constitute about 5 km. Expression for Estimation of maximal increments of pseudo-range maxδrto the satellite due to the presence in the propagation path of precipitation with regard to Eq.(2) has the form

(3)

Using data of the refractive indices (Tables 1 and 2), the relation is established between the water content and the intensity of precipitation (1), as well as the dependence of the Maximum amount of precipitation against their average intensity. The expected increment of pseudo-ranges upon the intensity of rainfall and elevation of the satellite are estimated as Fig.2.

Fig.2 Dependence of pseudo-range increment against intensity of rainfall and the sizes of their area
It is seen that heavy rains may lead to changes of pseudo-ranges, which can reach several meters. In experimental studies, the antenna of measuring receiver was located at a height of 30 m above the Earth’s surface. For the experimental investigations, the receiver СH-4701 and СH-4706 of the signals GPS, GLONASS, GNNS are used. It is developed and manufactured by construction department “NAVIS”, Smela, Mazura st.24, Ukraine, 20708.
Since the sensitivity to the presence of clouds increases at low elevation angles, and the length of the path in the sediments increases, the measured of pseudo-range to the satellite was at radio occultation. Fig.3 shows the variation of root-mean-square (RMS) fluctuations of pseudo-range to GPS satellite system, obtained by removing from the measured pseudo-range trend associated with changes in distance when satellite is moving.
It is seen that the presence of powerful stratocumulus clouds and rain zones increases RMS fluctuations of pseudo-range. Increasing the height of the clouds also affects the angles subtended by the greatest fluctuations of pseudo-range. Fig.4 shows the variation of pseudo-range to the GPS system satellites in the propagation of the signal through the zone of continuous heavy rainfall.

Fig.3 RMS value of pseudo-range fluctuations upon satellite's observation angle

Fig.4 Variation of pseudo-range to GPS system satellites in propagation of signal through zone of continuous heavy rainfall
It is obtained by removing from the measured pseudo-range trend (Fig.4(a)) associated with the movement of the satellite and the resulting of change in slant range (Fig.4(b)). The difference between the data with precipitation and without it is illustrated in Fig.4.
Similarly, propagation through the zone of precipitation due to the increase of the measured pseudo-ranges decreases measured altitude Δz, as shown in Fig.5. During precipitation, the measured altitude is usually decreasing due to the increase of pseudo-ranges to satellites. Altitude measurement error due to propagation through the zone of precipitation may be masked by the diurnal variation of measurement error associated with the tropospheric refraction.
Fig.6s(a) and (b) shows the daily altitude and surface refractive index value changes. It is seen that there is an increase in the measurement error in the evening and night hours, the nature of which repeats the changes in the surface refractive index value. These figures also show what happens when there was heavy rain. Comparison of altitudes measured during precipitation and in clear weather may allow the identification of changes due to delays in signal propagation through the zone of precipitation, as shown in Fig.6.

Fig.5 Changes in measured altitude in propagation through zone of precipitation

Fig.6 Changing of the altitude and the refractive index of the troposphere
The altitudes obtained are compared by measuring the same satellite at the same time. Altitude measurement error associated with errors in determining pseudoranges Δrican be got by
whereβiis viewing angle fori-satellite,m=4 is their amount that is used in the measurements.
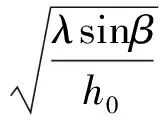
That at movement of satellites the troposphere inhomogeneities is moving in the areas is essential for propogation. This leads to an amplitude modulation of the received signal. The sizenof the Fresnel zone at distances up to the satelliteR0and inhomogeneitiesl0=h0/sinβ, whereh0its altitude, andβis the viewing angle of the satellite, taking into account thatR0?l0, is determined by the ratio[8]

The size of the Fresnel zones determines the spatial resolution of the inhomogeneities. It is for the height of the clouds for 1-4 km is about 15-60 m atβ=90°, increasing to 100-400 m at elevation angles of about 1°.
The angular size of the corresponding zone Δβnand the passage time Δrnwith its fixed point inhomogeneity due to the motion of the satellite in its orbit at a speedv0are defined by


Completely,
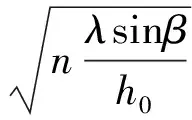

The first Fresnel zone equation takes the form

Estimates with using Eq.(7) show that at the height of the troposphere inhomogeneities, such as outbreaks of thunderclouds 1-4 km, the angular size of the first Fresnel zone for GPS satellites, located at the nadir, is about 1°-0.5°. The movement time of the satellite at an angular size is 35-140 s. At the same time, the small angle of sight satellites about 1° size of the area essential for propagation is a reduced to 0.1°, and the time of its flight to 3.5-14 s.
2 Conclusion
The possibility of detection of dangerous meteorological phenomena (areas of thunderstorm activity, saturated with water clouds) using the coordinate information receivers of satellite navigation systems is considered. The link between water content of clouds which shined through and the measured location, which can be used to identify areas of the hazardous meteorological phenomena is shown. It is experimentally shown that the presence of storm clouds and precipitation leads to an increase in RMS value of the fluctuations of the measured pseudo-range. The calculated ratio that connect error of pseudo-range measurements with altitude, water content and viewing angles of the satellite are obtained. Based on the dielectric properties of water and water content of different types of clouds, it is estimated thet the expected change in pseudo-range depends on the intensity of rain. For heavy rainfall, they can amount to a few meters. The experimental results show that with the increase in intensity of the cloud cover, the appearance of zones of precipitation is manifested in an increase in the RMS value of the fluctuations of pseudo-range. Their value is in agreement with obtained theoretical estimates. To isolate the fluctuation component of pseudo-range, pseudo-differential method is used. In experimental studies, the receivers of navigation satellite system GPS, GLONASS CN-4701 and CN-4706 developed by Ltd.“NAVIS” have been used.
[1] Gudkov V N, Lutsenko V I, Lutsenko I V, et al. Detection of hazardous weather phenomena using receivers of global navigation satellite system. In: Proceedings of the 19th International Crimean Conference on Microwave & Telecommunication Technology, Sevastopol, 2009: 929-930.
[2] Hyatt H A. Emission, reflection and absorption of microwaves at a smooth air-water interface. Journal of Quantitative Spectroscopy Radiative Transfer, 1970, 10: 217-247.
[3] Kolosov M A, Armand N A, Yakovlev O I. Propagation at space communications. Communication, 1969: 155.
[4] Krassyuk N P, Koblov V L, Krassyuk V N. Effect of the troposphere and the underlying surface to RLS Work. Radio and Communication, 1988: 213.
[5] Kalinin A I. Propagation of radio waves on the tracks of terrestrial and space radio links. Communication, 1976: 296.
[6] Sukhonin E V. Attenuation of millimeter and submillimeter waves in the atmosphere with hydrometeors. Doctoral Dissertation of Phyical-Mathematic Sciences: 01.04.03 “Radiophysics”, IRE Academy of Sciences USSR, Moscow, 1988.
[7] Royenko A N, Zamaraev B D, Kostin V L, et al. Scattering of millimeter radio waves with vegetation cover . In: Proceedings of Radio Physics and Electronics, Kharkov, 2002, 7(2): 335-341.
[8] Dolukhanov propagation of radio waves. Communication, 1965: 400.
利用全球?qū)Ш较到y(tǒng)檢測危險氣象
V F Kravchenko1, O V Kravchenko1, V I Lutsenko2, I V Lutsenko2, D O Popov2
(1. Kotel’nikov Institute of Radio Engineering and Electronics, Russian Academy of Sciences, Moscow 125009, Russia;2. Usikov Institute of Radiophysics and Electronics, National Academy of Sciences of Ukraine, Kharkov 61085, Ukraine)
提出了利用全球衛(wèi)星導(dǎo)航系統(tǒng)和全球定位系統(tǒng)接收器得到的坐標測量數(shù)據(jù)進行危險氣象現(xiàn)象檢測的方法。 依據(jù)偽距離和海拔高度的數(shù)據(jù)進行雷暴進程和強云團檢測的可能性在理論上進行了演示, 并在實驗中加以確認。
危險氣象; 無線輻射; 全球?qū)Ш较到y(tǒng); 偽距; 海拔高度
Kravchenko V F, Kravchenko O V, Lutsenko V I, et al. Usage of global navigation systems for detection of dangerous meteorological phenomena. Journal of Measurement Science and Instrumentation, 2015, 6(1): 68-74.
10.3969/j.issn.1674-8042.2015.01.013
s: Task Complex Program National Academy of Sciences of Ukraine on Space Research for 2012-2016.
V F Kravchenko (kvf-ok@mail.ru)
1674-8042(2015)01-0068-07 doi: 10.3969/j.issn.1674-8042.2015.01.013
Received date: 2014-10-03
CLD number: P4; TP274 Document code: A
登錄APP查看全文
猜你喜歡
中國設(shè)備工程(2022年12期)2022-07-11 04:33:00
海峽科技與產(chǎn)業(yè)(2016年3期)2016-05-17 04:32:12
 Journal of Measurement Science and Instrumentation
2015年1期
Journal of Measurement Science and Instrumentation
2015年1期
- Journal of Measurement Science and Instrumentation的其它文章
- Underground vibration signal detection and processing system based on LabWindows/CVI
- Test system for miniature pulse-powered photoelectric invert switch based on CPLD
- Design of IP core for IIC bus controller based on FPGA
- Design of multi-channel data acquisition system based on LabVIEW and NI PXI-5105
- Approach for epileptic EEG detection based on gradient boosting
- A spectrum measurement system for arc plasma with time and spatial indentification