可靠性、可用性與可維修性分析在LNG接收站產能預測中的應用
2015-06-15 06:51:06魯毅劉昳蓉袁小軍
化工學報 2015年2期
魯毅, ,劉昳蓉,袁小軍
(風控 (北京)工程技術有限公司IRC,北京100025)
Foreword
Reliability,Availability and Maintainability(RAM)analysis is a production-performance technique which can take into account all failure and repair rates of each of the equipment that compose a system along with its physical configuration in order to estimate the system's behavior over a given operational time.
RAM analysis is a technique which supports the production-assurance process recommended in ISO 20815/API 17N[1-2].
The RAM analysis covers an LNG(Liquefied Natural Gas)storage terminal located in Southern China.The LNG terminal is used to supply LNG and compressed natural gas (CNG)to the surrounding communitiesviaLNG/CNG trucks.The LNG storage terminal has two 20000m3LNG tanks to stored LNG from LNG carriers and a section of buried pipeline which serves as an intermediate storage buffer for BOG generated from LNG.A Failure Modes,Effects and Criticality Analysis(FMECA)was undertaken for the Berth LNG unloading arms to better understand the failure modes as failure data on such specialized equipment is limited.Failure data for all other equipment used in this study was compiled from Offshore Reliability Data Handbook (OREAD).The key step of RAM analysis is development and simulation of the LNG terminal using apredictive/deterministic algorithm software in order to calculate the distribution of probable outcomes.The RAM simulation software used in this study was ReliaS-uite?,a Monte Carlo method based simulation software.
The key products from the LNG storage ter-minal are LNG and CNG and results calculated are with reference to the ability of the terminal to deliver (deliverability)products to the end-users.Independent models for LNG and CNG system was developed to better understand the effects of failure on delivery of each product.A sensitivity case was developed to assess the impact of BOG storage capacity on the ability to deliver CNG to downstream users.
1 Introduction
The RAM analysis covers an LNG storage terminal located in Southern China.The LNG terminal is used to supply LNG and compressed natural gas (CNG)to the surrounding comm-unitiesviaLNG/CNG trucks.The project was in detailed engineering when this study was performed.
The LNG storage terminal receives LNGviaLNG carriers with LNG stored in two 20000m3LNG tanks.LNG pumps are used to transport LNG to LNG truck loading facilities for truck offloading.Boil-off gas (BOG)generated during LNG tank filling (from LNG carrier)and normal operations are compressed,stored and offloading onto trucks as CNG.The terminal includes a section of buried pipeline which serves as an intermediate storage buffer.
The purpose of the RAM study is to evaluate the following:
(1)Determine the failure modes of com-ponents within the LNG unloading arms using Failure Modes,Effects and Criticality Analysis(FMECA);
(2)Availability of both LNG and CNG systems to deliver product to end-users considering storage and truck schedule constraints;
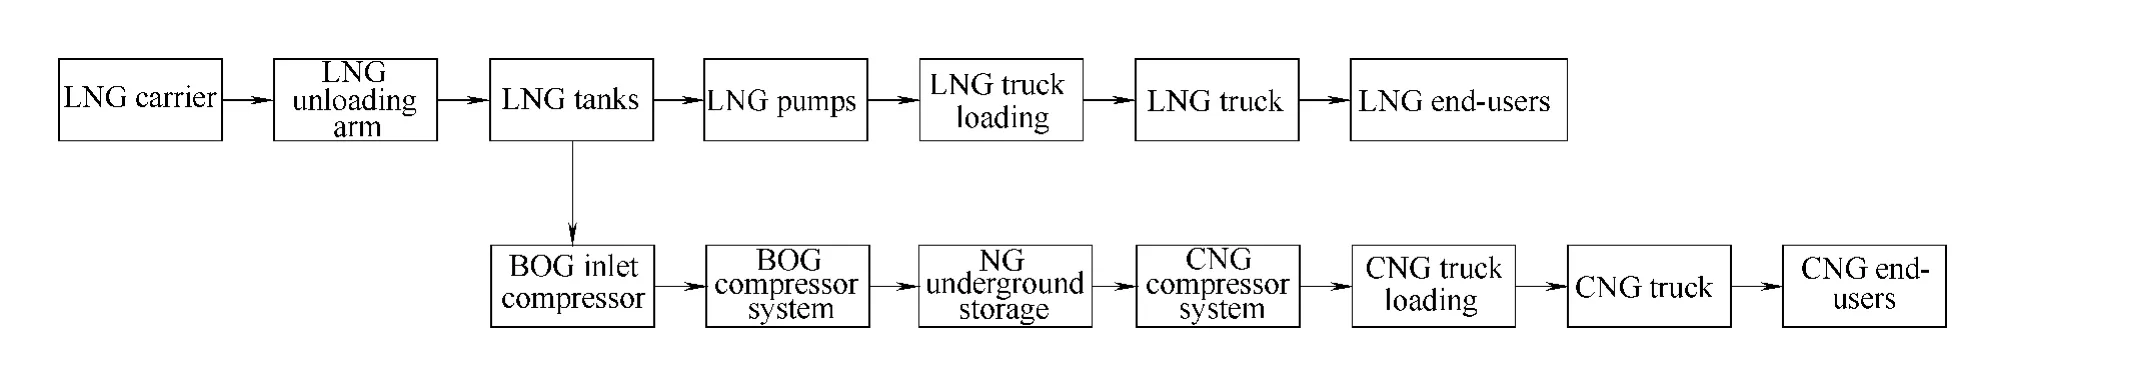
LNG storage terminal process flow
(3)As a sensitivity case,determine the optimal BOG storage volume for the CNG system.
2 Study Methodology
2.1 Overview
RAM modeling is a way of quantitatively assess the performance of a complex system.In many industries such as the oil and gas industry,the cost of equipment failure (though reduced production)is relatively high.Therefore a highly reliable system is desired and through RAM modeling,the reliability of an entire system can be analyzed.
The RAM analysis itself is a production-performance technique which can take into account all failure and repair rates of each of the elements that compose a system along with its physical configuration in order to estimate,by the use of a simulation model,the system's behavior over a given operational time.ISO 20815 -Petroleum,petrochemical and natural gas industries-Production assurance and reliability management describes the establishment and execution of a production-assurance programme (PAP)to ensure optimum economy of the facility.Part of the PAP is production-performance analysis which can be undertaken using RAM.Fig.1presents a simplified relationship between reliability,availability and maintainability depicting how changes in reliability and maintainability affect availability.Fig.2presents the overview of a RAM analysis.
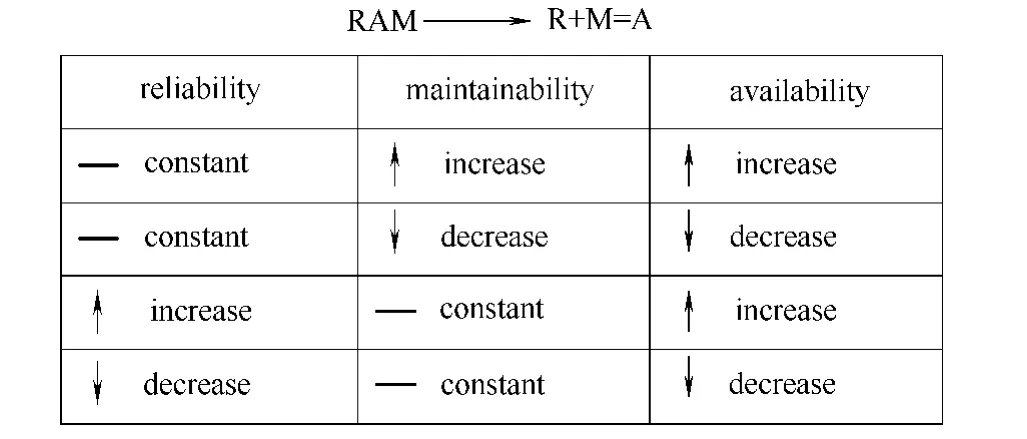
Fig.1 RAM relationship
2.2 Terms and definitions
Failure Termination of the ability of an item to perform a required function[3].Examples: Mechanical failure,material failure,instrument failure,etc.
Failure Mode Effect by which a failure is observed on the failed item[7].Examples:Leakage,vibration,alignment failure (all related to a mechanical failure).Mean Time to Failure MTTF is the time elapsed between failures of an equipment[5].
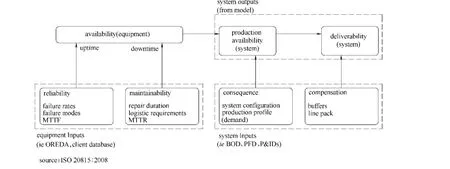
Fig.2 RAM overview
Mean Time to Repair MTTR is the time required to repair and return the equipment to a state where it is ready to resume its function.
Reliability Ability of an item to perform a required function under given conditions for a given time interval[2].Reliability can be thought of as the probability of conformance to a speciation (required function)over a specific time.This is an inherent characteristic of an item and is only influenced by the operating context in which it is working.This is most commonly defined in association with the Mean Time between Failures (MTBF).
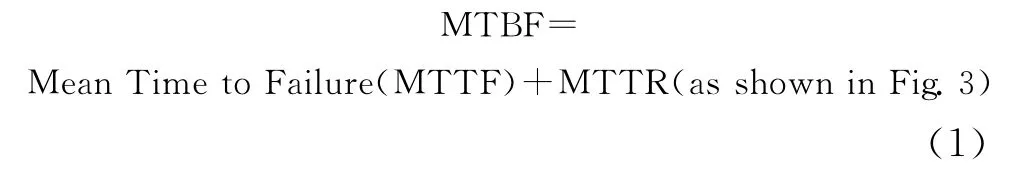
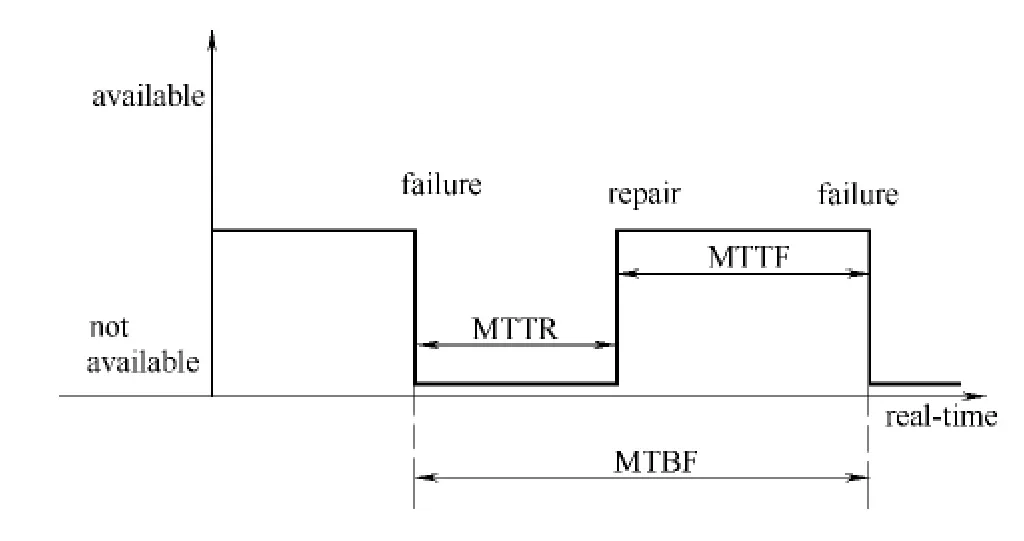
Fig.3 Inherent availability
Maintainability Ability of an item under given conditions of use,to be retained in,or restored to,a state in which it can perform a required function,when maintenance is performed under given conditions and using stated procedures and resources[4].Maintainability can be thought of as the probability of returning a failed item to a specific standard level over a specific time after a failure has occurred.This is the typical time spent fixing aproblem,allowing it to get back to service.Its most commonly quoted as Mean Time to Repair(MTTR).
Availability Availability is an important metric used to assess the performance of repairable systems,accounting for both the reliability and maintainability properties of a component or system.A wide range of availability classifications and defini-tions exist.The ones presented here are the most common used in RAM modeling,but variations exist and one should be aware of how they are calculated and what they mean so that one can make an appropriate choice for the analysis to be performed.
Production Availability Ratio of production to planned production,or any other reference level,over a specified period of time.It is defined as the production throughput of a system as a ratio of potential production in a given operation time as shown in Eq.(2).
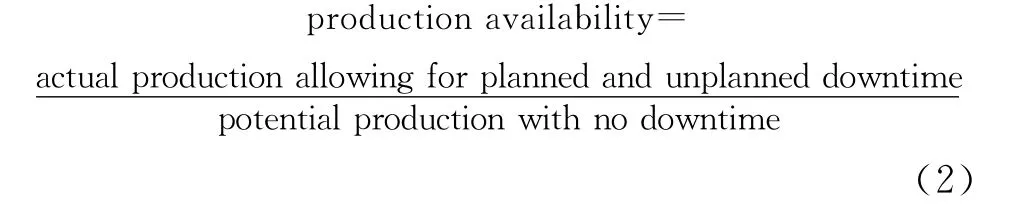
This type of Production Availability is considered by simulating models (egMonte Carlo),that evaluate the effects of failures in terms of production losses.
Production-Performance Analysis Systematic evaluations and calculations carried out to assess the production performance of a system[1].
Deliverability Ratio of deliveries to planned deliveries over a specified period of time,when the effect of compensating elements,such as substitution from other producers and downstream buffer storage,is included[1].
Reliability Block Diagram (RBD) A diagram that represents how the components,represented by“blocks”,are arranged and related reliability-wise in a larger system[6].A RBD is often used to depict the relationship between the functioning of a system and functioning of its components.In a RBD,a block is often used to represent each component.
2.3 RAM Process
The RAM analysis is a production-performance technique which can take into account all failure and repair rates of each of the equipment that compose a system along with its physical configuration in order to estimate,the system's behavior over a given operational time.Monte Carlo simulation method is often the preferred method as this technique allows the evaluation of complex system and can accept inputs with a range of answers (ieequipment failure rate and failure characteristics).
The common outputs from a RAM analysis are overall performance of the system and the number of predicted equipment failures for all equipments in the system with respect to operational time.Through RAM analysis,equipment with relatively high failure rates can be identified and suitable PHA methodology can be applied to assess the process safety risk of the failure.Fig.4 presents the steps taken in performing the RAM study.
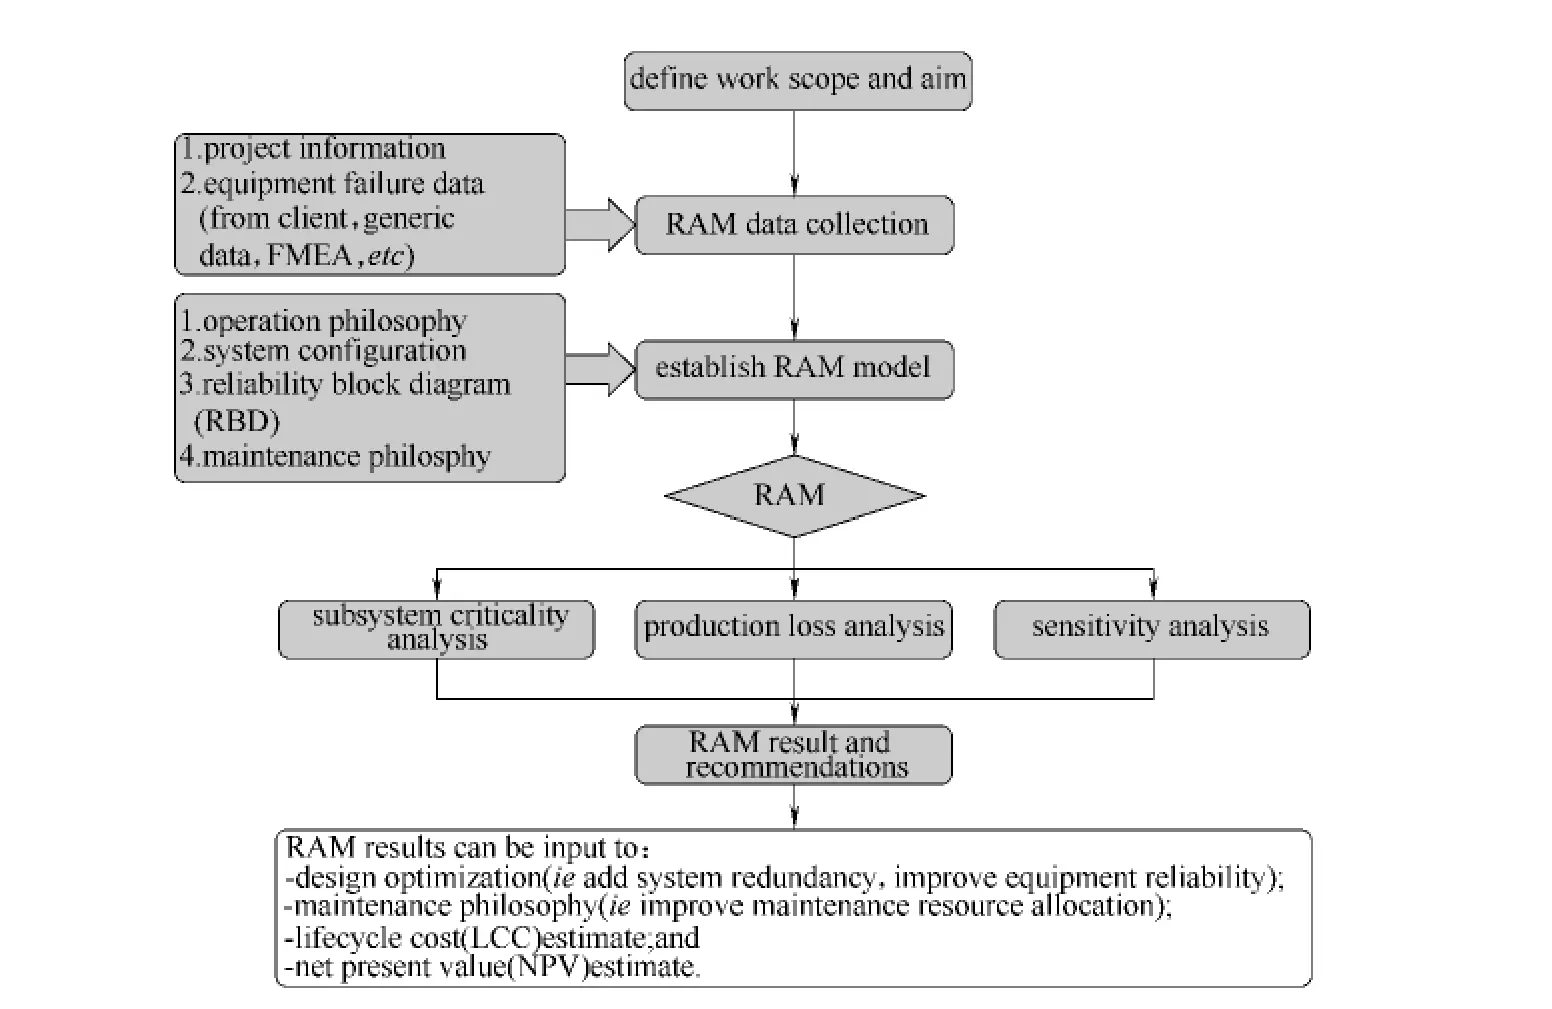
Fig.4 RAM modeling process flow
3 Simulation Software
There are many numerical methods used in the area of prediction and simulation to build simulation models (Markov,Petri Net,etc.),but the Monte Carlo method is the technique most widely used for the simulation of complex and dynamic interactions where a number of restricting elements or time-based activities need to be incorporated.Monte Carlo is a method of generating values from a known distribution for the purposes of experimentation.This is accomplished by generating uniform random variables and using them in an inverse reliability equation to produce failure times that would conform to the desired input distribution.The simulation software used in this study is IRC's propriety software,ReliaSuite?.ReliaSuite?is Monte Carlo method based software tailored for use in the oil &gas and process industries.Using Monte Carlo method,ReliaSuite?is able to handle various failure patterns (expo-nential,weibull,etc.)with different repair parameters (maintenance resources).Outputs from the software are time-based system availability with respect to simulation time (Fig.5).Time-based prediction outputs allow the reporting of periods of low availability or system outages.
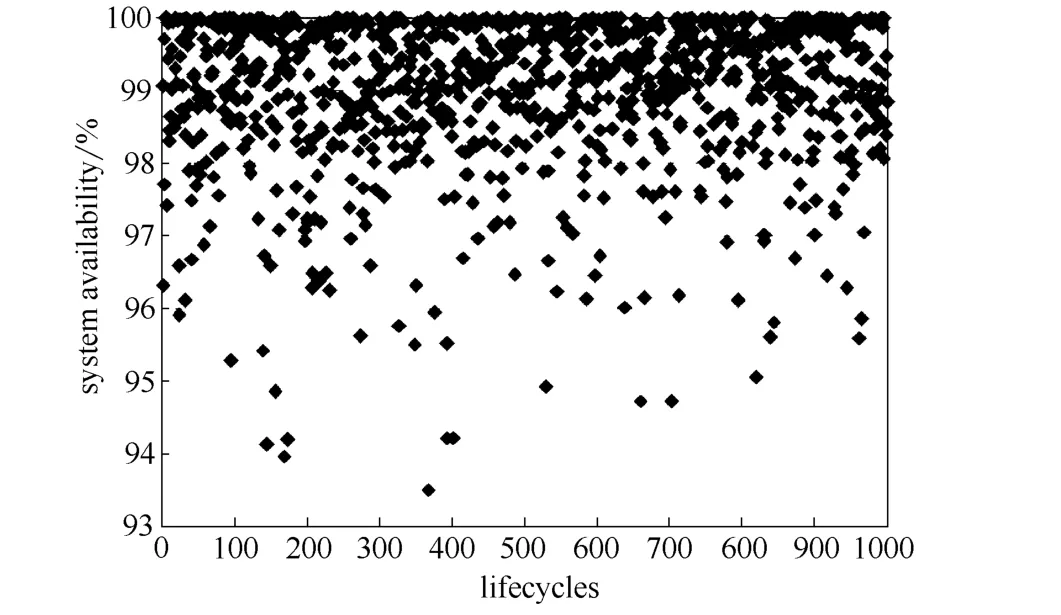
Fig.5 System availability distribution in a 1000lifecycle simulation
4 Key RAM Assumptions
4.1 System and equipment configuration
Equipment and system configuration of the LNG terminal RAM model was gathered from the following project documents:
(1)Basis of Design (BOD);
(2)Piping and Instrumentation Diagrams(P&IDs);
(3)Process Flow Diagrams (PFD);
(4)Operational and maintenance philosophies/strategies.
RBDs of the LNG terminal was developed to provide a reliability-wise graphical representation of the equipment items included in the model.The RBDs represents the relationships needed to construct the RAM model and indicates the configuration of equipment items (series or parallel)and the effect of equipment failure on system production.
4.2 Failure data
Failure data for this study was collectedviatwo sources[10,12]:
(1)FMECA on the berth LNG unloading arms;
(2)Process equipment failure data from Offshore Reliability Data Handbook,2009 (OREDA).
FMECA was undertaken for the LNG unloading arms as failure data on such specialized equipment is limited and the project team has identified the unloading arms process critical with significant consequence if there was a failure.FMECA was facilitated using the methodology aligned to Mil-STD-1629AMilitary Handbook,Procedures for Performing a FMECA[13].Fig.6presents the general steps in a FEMCA.
The unloading arms were divided into a number of subsystems and each subsystem was further broken down into components.Table 1presents the summary of the LNG unloading arm FMECA workshop.
4.3 System life
System life or mission time assumed for the LNG Storage Terminal RAM Analysis was 25 years.

Fig.6 FMECA process flow
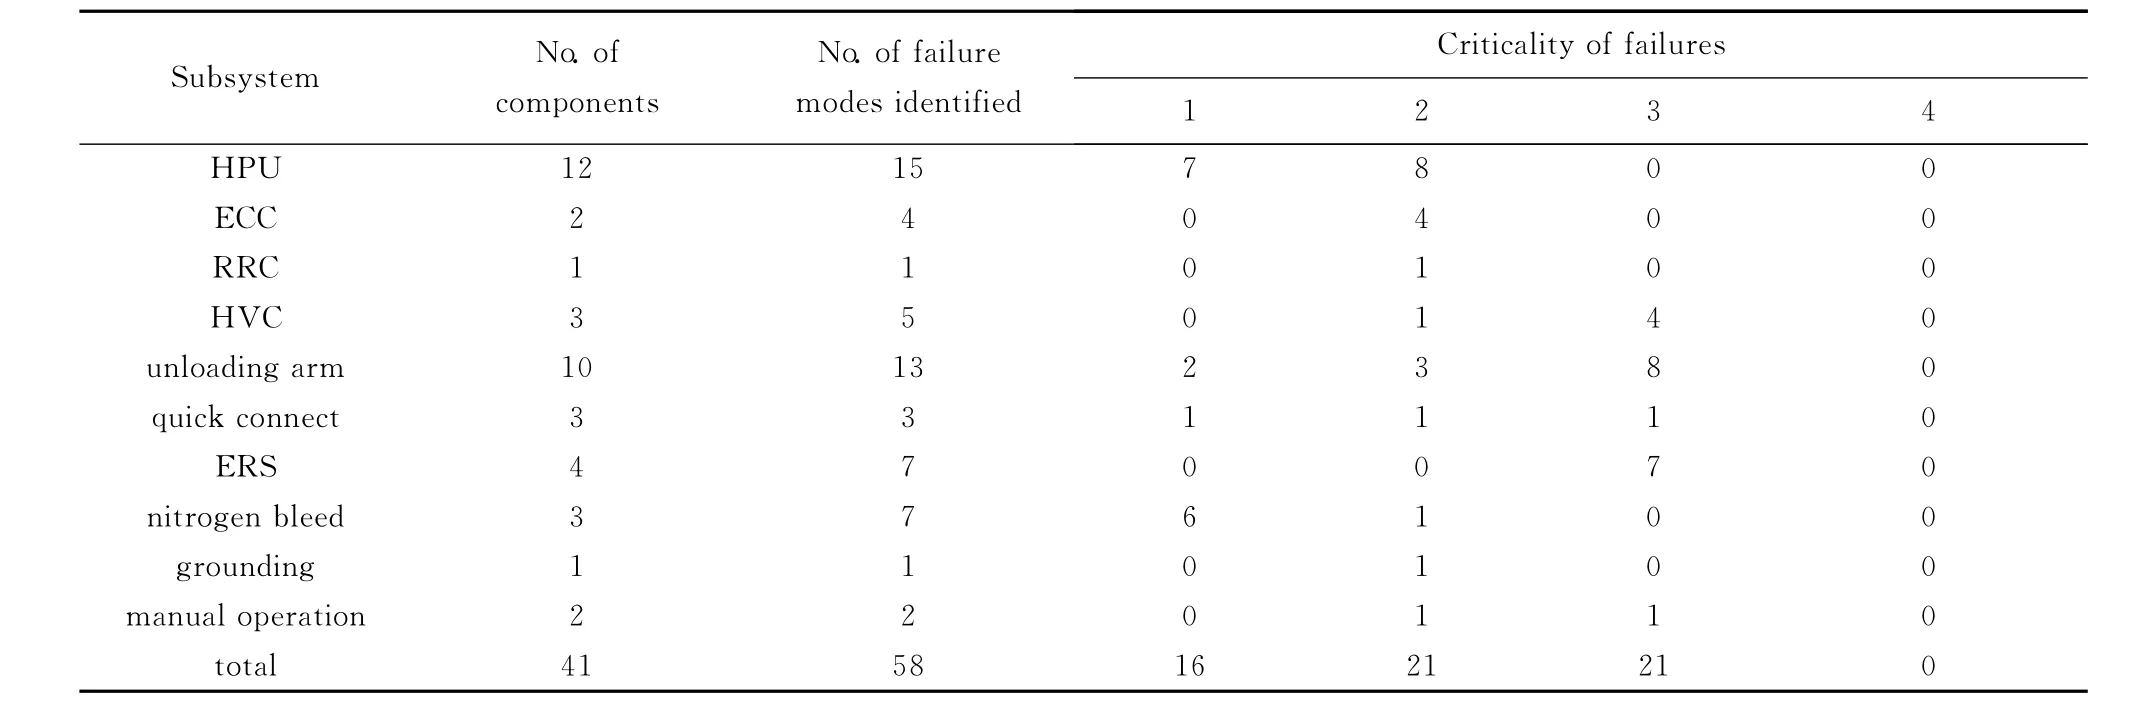
Table 1 LNG unloading arms FMECA summary
4.4 Lifecycle
Monte Carlo simulation method simulates the dynamic interfaces between various restricting elements or time-based activities and each simulate of a system life (lifecycle)may yield a different result.Therefore a large number of lifecycles (reruns of system life)is required to capture the varying results arising different interactions between elements in the model[11,8].
Typically 1000lifecycles is recommended to ensure results are statically stable however due to the complexity modeling shipping of products to downstream users,the LNG Storage Terminal RAM models were simulated for 100lifecycles.
4.5 Maintenance utilities
As production efficiency and ultimately achieved production is a product of reliability and maintainability,ensuring that a design is maintainable is as essential as its reliability[16].The RAM models considered maintenance resources for both unscheduled maintenance(due to equipment failure)and planned maintenance(preventive maintenance).
5 Results
The key outputs from the RAM models were:
(1)Deliverability of LNG and CNG to downstream users;
(2)Key subsystem criticality (downtime);
(3)Key contributors to equipment downtime.
Although LNG and CNG(BOG from LNG operation)are linked together,LNG and CNG were modeled as independent base case models to better understand the dynamics within each system.Due to the limited storage capacity of BOG,the project team decided to remove storage constraint (unlimited storage)for the CNG system.Unlimited BOG storage is unrealistic therefore a sensitivity case was developed to study the impact of BOG storage on CNG deliver-ability.Table 2presents the deliverability of LNG and CNG to downstream users.
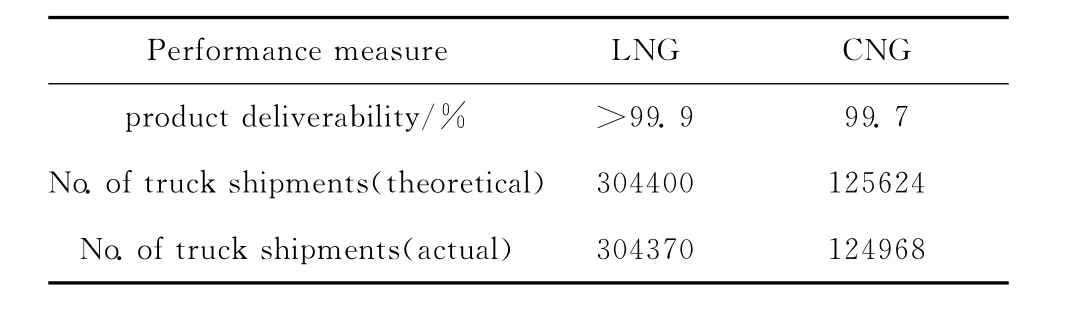
Table 2 LNG &CNG deliverability results
The theoretical number of LNG truck shipments to be made is 304400based on a 6days LNG carrier delivery schedule of 10000m3for a system life of 25years.Whilst CNG truck shipments were based on BOG generated during LNG carrier offloading and BOG generated during normal operations.LNG deliverability >99.9as the terminal LNG storage capacity is 40000m3which provides sufficient buffer mitigate downtime arising from equipment failure and truck delivery constraints.High deliverability targets are required for end-user product storage facilities such as LNG storage terminals as supply interruption (ieterminal outage)of this facility will result in immediate downstream shortage.Without the constraint of BOG storage (unlimited storage),CNG deliverability of 99.7%can achieved and 0.3%downtime as a result of equipment failure on the critical path(no equipment redundancy).Fig.7and Fig.8presents the breakdown of downtime per subsystem for LNG and CNG systems respectively.Subsystem downtime presented does not necessary reflect supply interruption (ieliquid arm failure when in use,does not affect system deliverability).
6 Sensitivity Case
A sensitivity case was developed to study the impact of BOG storage on CNG deliverability.The series of RAM models was developed with BOG storage capacity ranging from 1000000m3(virtually unlimited)to 5000m3(severely constrained).Fig.9presents the CNG deliverabilityversusa range of BOG storage capacity.
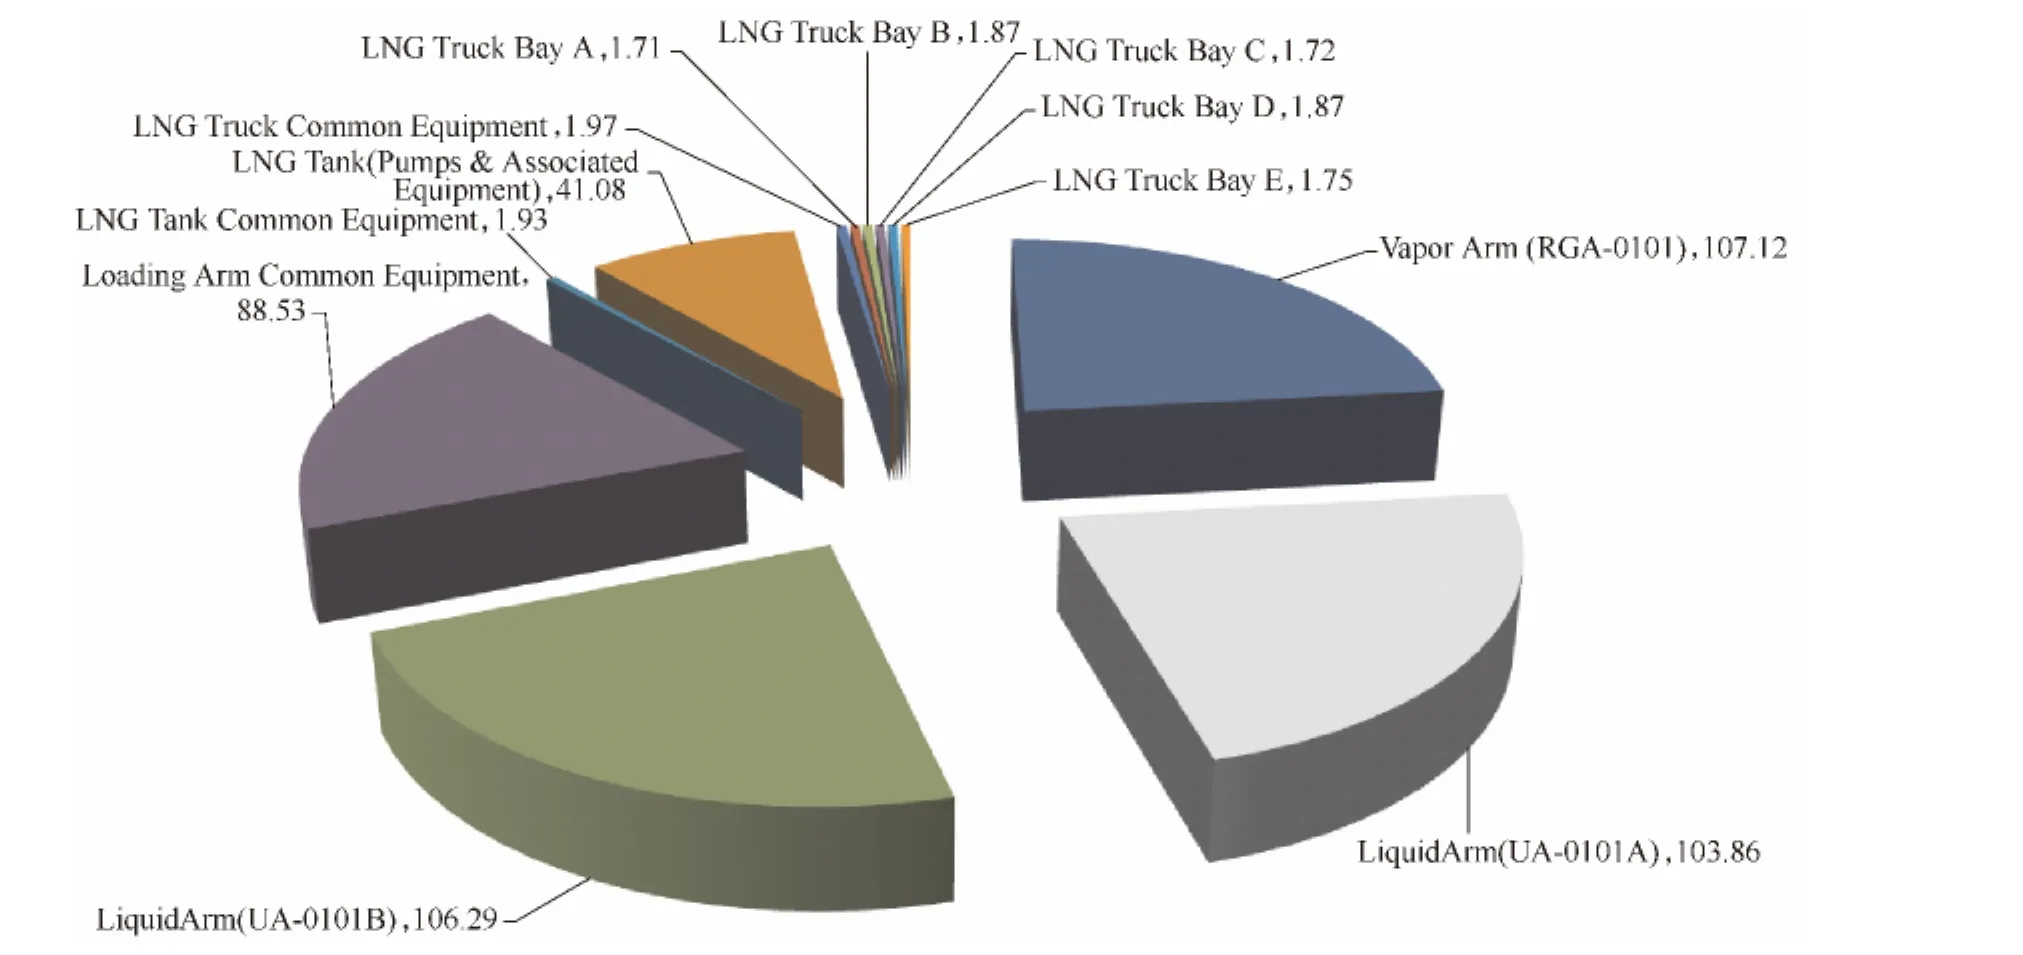
Fig.7 LNG subsystem criticality (downtime,hours)
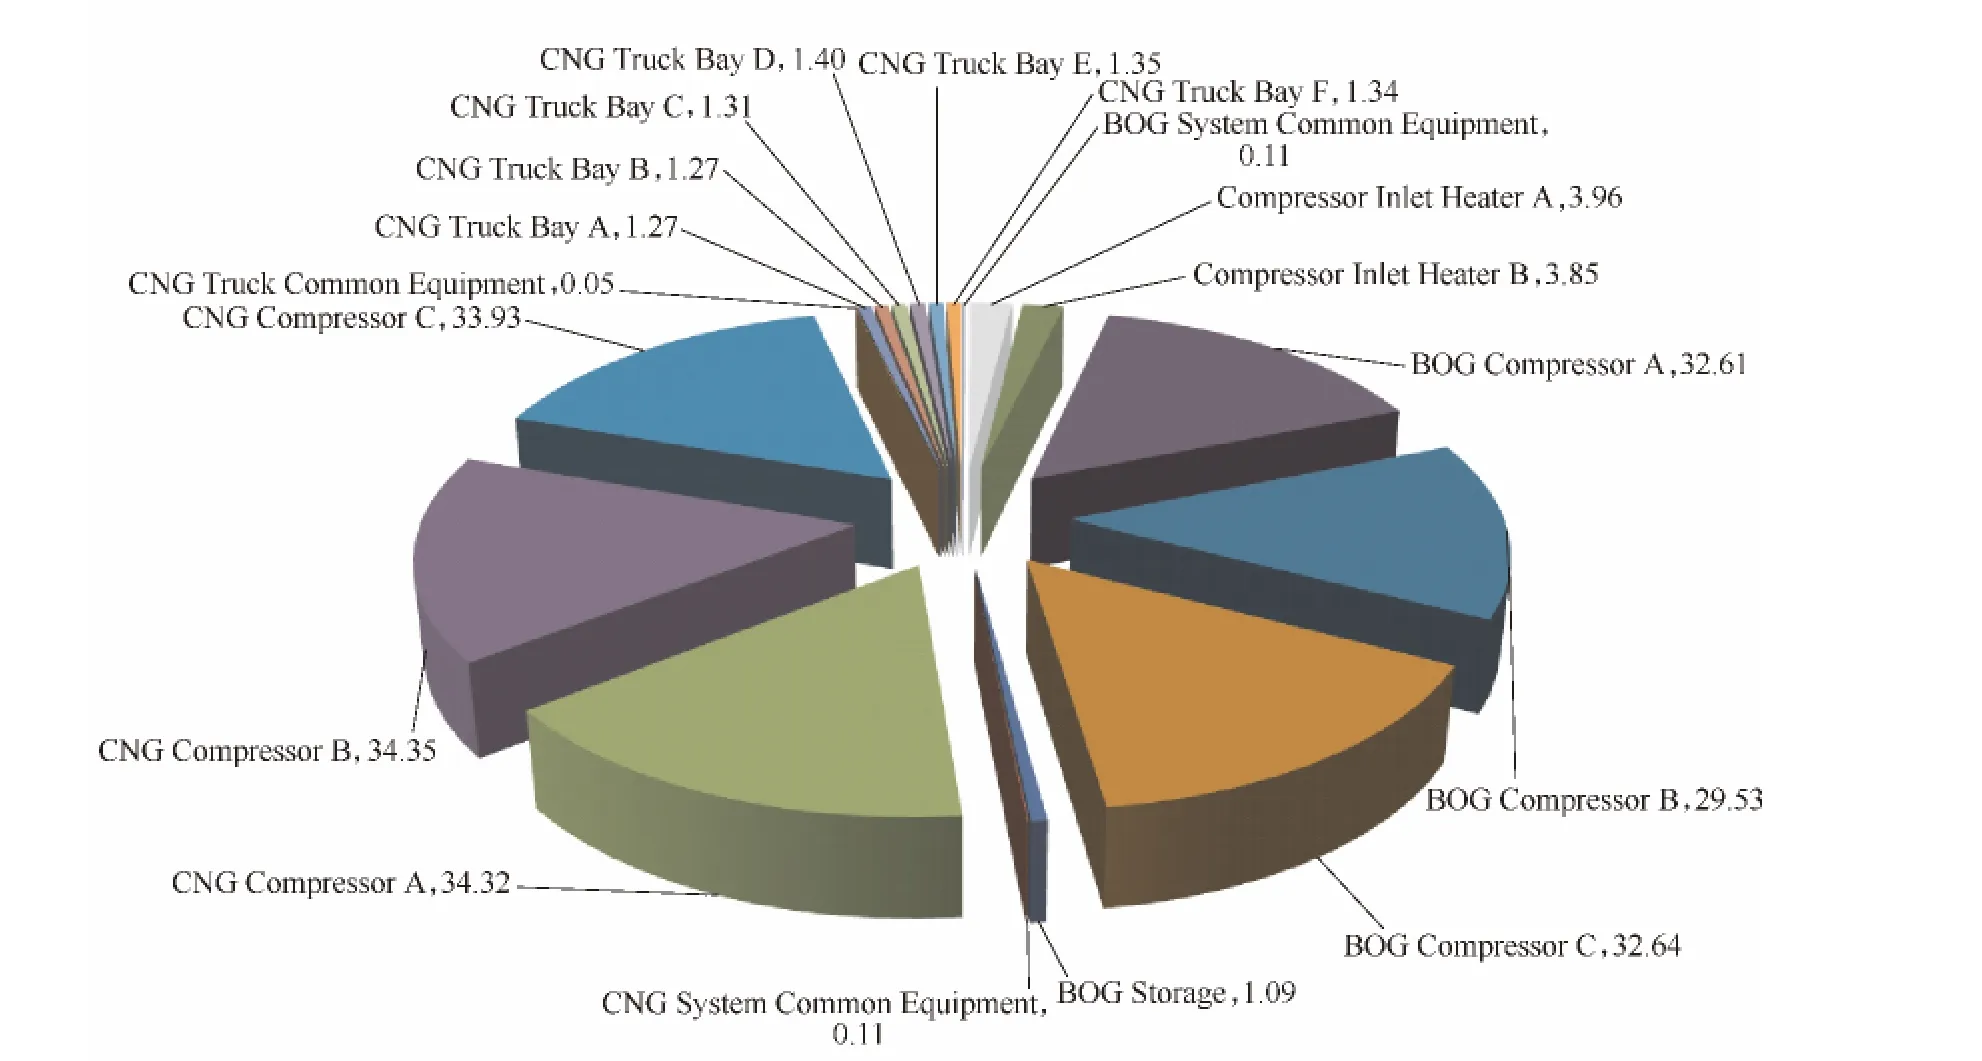
Fig.8 CNG subsystem criticality (downtime,hours)
Typical of such storage capacity analysis,a knee shape trend will form when unconstrained storage gradually becomes constraint and is reflected by the delivery performance of CNG.As such,the optimal storage of BOG capacity (@ 1.19 barg,5℃)can be narrowed to a range of 20000 m3to 50000m3.A cost and benefit analysis(CBA)on the associated cost with storage capacity can further narrow the optimal storage capacity range[14].
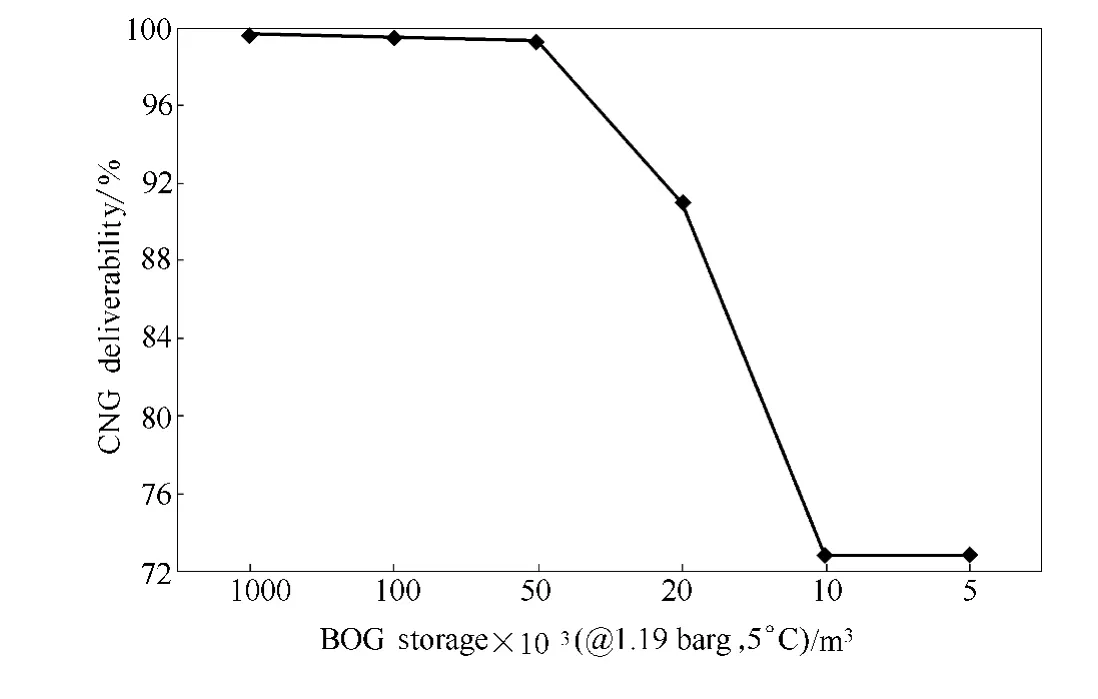
Fig.9 BOG storage capacity sensitivity case
7 Conclusion
Through the use of FMECA,58failure modes were identified within the LNG unloading arms.By reviewing the failure effects of each component,special attention(sparing,maintenance strategies,etc)can be given to these components.
High LNG deliverability (>99.9%)can be achieved with current design of the LNG system but this may not be achievable if there is insufficient BOG storage as both LNG and CNG(from BOG generation)are linked together.
Through development of the CNG base case and sensitivity case models,the key deliverability constraint of the CNG system is the capacity of the BOG storage.The optimal BOG storage capacity(@1.19barg,5℃)for the CNG system is between 20000m3to 50000m3.However this storage capacity should be reviewed using CBA to ensure viable economic return of investment.
RAM analysis using a RAM modeling soft-ware is a useful method that allows system designers and facility operators to predict the performance of their systems with a high degree of confidence (relative to input data).The ability to handle a large degree of input variables and operating conditions makes Monte Carlo method based simulation software ideal to model complex facilities in the oil &gas and process industries.
[1] API 17N.Recommended practice for subsea production system reliability and technical risk management [S].American Petroleum Institute,2009.
[2] ISO 20815.Petroleum,petrochemical and natural gas industries-Production assurance and reliability management [S].International Organization for Standardization,2008.
[3] Birolini Alessandro.Reliability Engineering [M].Berlin:Springer-Verlag Berlin Heidelberg,2014.
[4] David J Smith.Reliability,Maintainability and Risk [M].8th ed.Butterworth-Heinemann,2011:45.
[5] IEC 60812.Analysis techniques for system reliability procedure for failure mode and effect analysis [S].International Electrotechnical Commission,2006.
[6] IEC 61078.Analysis techniques for dependability reliability block diagram and boolean methods[S].International Electrotechnical Commission,2006.
[7] IEC 60300-3-11.Analysis techniques for system reliability-Procedures for failure mode and effects analysis [S].International Electrotechnical Commission,2009.
[8] IEC 61165.Application of Markov Techniques [S].International Electrotechnical Commission,2006.
[9] ISO 14224.Petroleum and natural gas industries-Collection and exchange of reliability and maintenance data for equipment [S].International Organization for Standardization,2004.
[10] Center for Chemical Process Safety.Guidelines for Improving Plant Reliability Through Data Collection and Analysis[M].1998.
[11] Kristopher J Preacher,James P Selig.Advantages of Monte Carlo confidence intervals for indirect effects[J].CommunicationMethodsandMeasures,2012,6:77-98.
[12] Reliability Prediction of Electronic Equipment,MIL-HDBK-217FMILITARY HANDBOOK [S].1991.
[13] Mil-STD-1629AMilitary Handbook,Procedures for Performing a FMECA [S].1977.
[14] Rao S S.Reliability Based Design [M].USA:McGraw Hill,Inc,1992:67.
[15] Stapelberg,Rudolph Frederick.Handbook of Reliability,Availability,Maintainability and Safety in Engineering Design [M].London:Springer-Verlag,2009:247.
[16] Wang Hongzhou,Pham Hoang.Reliability and Optimal Maintenance[M].London:Springer-Verlag,2006:134.