Perspective to study on macro-mixing in chemical reactors
2015-04-01 11:54:42MAOZaishaYANGChao
化工學報 2015年8期
MAO Zaisha, YANG Chao
(Key Laboratory of Green Process and Engineering,Institute of Process Engineering,Chinese Academy of Sciences,Beijing100190,China)
1 Introduction
Mixing is an important unit operation in process industries. Many mixing processes involve only with physical mechanisms so as to make the medium homogenized in composition, physical and chemical properties. In chemical reactors, the mixing exerts great impact on the reactants conversion and products selectivity. In particular, the impact is much stronger for fast reaction in complex reaction systems.Therefore, thorough study of mixing in chemical reactor bears academic and practical importance fordesign, optimization and scale-up of chemical reactors[1]。
According to the scale of object under scrutiny,mixing is usually divided into 2 domains:macro-mixing and micro-mixing. Macro-mixing process comprehends the motion and dispersion of liquid packets with different properties inside a reactor and the consequent homogenization on the reactor scale. However, micro-mixing addresses the approach to chemical uniformity of components on the molecular scale[2]. The performance of macro-mixing is popularly quantified with the mixing time, and extensive experimental and numerical simulation studies have been reported on a wide range of academic and applied topics[3-4]. Because micro-mixing has great effects on the conversion of raw materials and the selectivity of desired products in a chemical reactor, micro-mixing attracts naturally great attention from chemical engineers. Nevertheless,as the prerequisite and starting point of micro-mixing,the important role of macro-mixing is not recognized sufficiently, and its fundamental and applied researches need to be brought to a higher level. This short review addresses a few problems of macro-mixing in chemical reactors, and proposes some worthwhile topics on macro-mixing for further in-depth understanding.
2 Measurement of macro-mixing
2.1 Mixing time
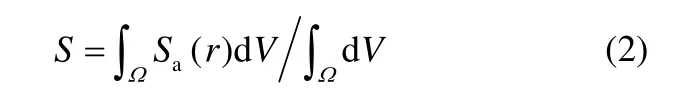
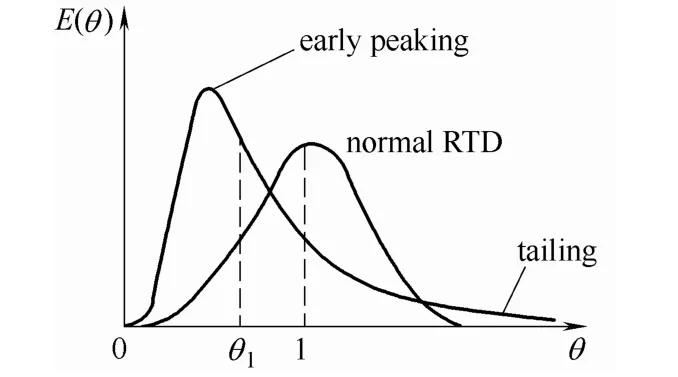
Macro-mixing performance needs to be characterized quantitatively assessed with a suitable index. The most popular one is mixing time, defined as the time needed for achieving certain degree of uniformity of composition or other detectable property of the medium after a tracer impulse is injected into the reactor. For example (Fig. 1), after a small amount of NaCl solution is injected at point A as the tracer, its concentrationc(t) is monitored continually at point B in terms of the solution conductivity so that the time trace ofc(t) is obtained, and transformed into a non-dimensional concentrationC(t). The mixing timetm95%is defined as the time whenC(t) at point of detection B falls into the range {0.95 In experimental measurement of mixing time, the tracer can be either electrolyte, dye, fluorescent reagent, the same liquid with higher temperature, or solid particles that follow the liquid flow well; a suitable measurement instrument is selected according to the physical property by which the tracer distinguishes itself from the liquid bulk[5]. Nevertheless, the above traditional definition could not reflect faithfully the macro-mixing in the whole reactor. In a typical tracer experiment (Fig. 1),the resulted mixing time records such a process:the tracer injected at point A being transported/dispersed into the central impeller region M with strong mixing and turbulence, further dispersed to the detection point B, and subsequently being spread over the whole tank by repeated transport among A, M and B. However,such a mixing time fails to represent the global mixing in a reactor by spreading involved with paths of A1→M→B1, A2→M→B2etc. What we desire really is the global mixing behavior comprehending all paths in a chemical reactor. In this sense, choice of the points for injection and detection is in fact a subjective factor in studying the macro-mixing. Researchers do pay attention to selecting the representative points of injection and detection in designing their mixing experiments, but the subjectivity in selection is not by far eliminated. Fig. 1 Sketch of stirred tank with injection point A and detection point B Suggestion 1It is not necessary to select an injection point with good representativeness to suppress the subjectivity related to tracer injection.Instead, the tracer is suggested to be injected into the region of strong turbulence, for example, the impeller region M in Fig. 1. Thus, only the process involvedwith the dispersion/homogenization of path M→B is tested. However, the factor of subjectivity related to selecting the detection point still exists. Therefore, a few new definitions are proposed for mixing time. For example, it was proposed to adopt as mixing time, the time period for the final tracer concentration within an error of 5% being achieved over a certain percentage of reactor volume(homogenized volume fraction being 0.9 or 0.95 )[6].Or, the mixing time is chosen for making the extent of color change in the detection window reach a threshold by either chemical reaction (acid-base neutralization + indicator)[7], or physical technique(planar laser induced fluorescence, PLIF)[8]. The advantage of using the fraction of homogenized reactor volume as the criterion is that it corresponds to using many detection points across the whole reactor for describing the global progress of homogenization, so that the subjectivity of choosing the detector position is largely avoided[6]. To further eliminating the subjectivity of selecting the injection point, it is advised to followSuggestion 1to inject the tracer into the impeller region where the mixing condition is the most favorable. The above indicates that as many as possible injection and detection points should be used in global macro-mixing experiment. The corresponding experimental technique must be very complex and difficult, but we anticipate that such kind of sophisticated method will be available along with the development of measurement technology and signal treatment technique. Liu[9-10]recently proposed to utilize the simulated 3D distribution of mean age in a continuous stirred tank for quantifying the mixing performance. It was found that the mixing time estimated from the mean age frequency function was very close to the empirical correlations in the literature. This approach is novel in conception, and the estimated mixing time is a global one by using the mean age distribution over the whole tank. However, there exists no suitable experimental method for validating the novel approach. In this case they took the estimated mixing time as 4 to 5 times the variance of mean age frequency function, thus adding a sense of subjectivity to the proposed approach. For mixing time measurement, the instrument is selected according to the property by which the tracer can be easily distinguished from the bulk liquid[5].Other factors influencing the accuracy and precision of mixing time determination include the position and manner of tracer injection (injection rapidness, jetting directionetc), detection position, size of detection window, tracer signal treatment, and whether if the tracing mechanism involved with chemical reaction(acid-base neutralization, coloring or decoloring reactionsetc). Besides, the measurement technique must suit well with the adopted definition of mixing time, if the definition is new. Cabaretet al[7]determined the mixing time of a stirred tank by monitoring color change by acid-base neutralization. A CCD camera recorded the color images of a half of the tank section, with the global sense enhanced. All images taken were processed to get the time history of indexM, which was the ratio of the number of homogenized pixels to that of all pixels in an image. Initially,M=0 att=0 of the tracer (acid)injection; the mixing time was determined whenMreached 0.9 or 0.95. In their experiment, a 3D tank was represented by 2D images, a pixel of image closer to the tank axis bore a larger weight (for longer optical path) than a pixel close to the tank wall, but this was ignored in the data reduction, making the time traceM(t) a distorted picture of the global homogenization process. Besides, the chemical method of color change is involved with micro-mixing steps, so the mixing time thus determined fromM(t) corresponds a smaller scale of segregation than that of pure macro-mixing. Huet al[8]adopted planar laser induced fluorescence (PLIF) technique to investigate the effects of multiple factors on the mixing time in stirred tanks. They handled the images of a half of vertical cross-section, but the weight of an image pixel was not incorporated into the procedure for determining the value of mixing time. Suggestion 2When using a physical PLIFmethod to make the color change in a mixing vessel,let the planar laser sheet pass through the axis so as to get a 2D image to represent the true tracer concentration field, and in the subsequent image processing and data reduction, the radial coordinate of image pixels should be related to the weight during establishing a proper index to the homogenization,thus the time trace of this index becomes a faithful and global indication of tank mixing performance. In addition to the popular mixing time,Danckwerts[11]defined in 1950s two parameters to quantify the extent of mixedness in a continuous reactor:Scale of segregation(S,the average distance between liquid packets with different concentration)andIntensity of segregation(I,the mean square variation of concentration among all packets). In general,S(t) andI(t) decrease as the operation of mixing proceeds. Curve 1 in Fig. 2 illustrates that the agitating system decreasesS(t) down to the turbulent Kolmogorov scaleλK(the ending point of macro-mixing) at a certain instant, which can be defined as the macro-mixing timetm. With weaker agitation,Sdrops asymptotically following curve 2 to a value greater thanλK. Fig. 2 Scale of segregation decreases as time elapses Similar to Danckwerts’ definition of coefficient of correlationR(r)[11], we propose to define alternativelyR(r) by auto-correlation coefficient of the concentration of a solute at point ofxain a one-dimensional space as where the domain of integration [xa-L,xa+L] is much larger than the scale of segregation. For an artificial 2D concentration field as exemplified in Fig. 3(a), the calculatedR(r) is presented as contours plot in Fig.3(b). The distance |ra| of the point with a maximumR(r) which is the closest to the originr=0 is taken as the scale of segregationS.If the integral domain is up to the whole reactor volume (or whole cross section),the estimatedSis a global one. If the domain is localized,Sis only a local index, which needs further integration to get a weighted average over the reactor volume Fig. 3 (a) a sample of periodic 2D concentration field, (b)contours of autocorrelation coefficient with a scale of segregation equal to 26.9. (examined concentration field ranging from 1 to 5 is a square of 100×100. The auto-correlation coefficient ranges from 0.5098 to 1, except at origin the nearest maximum ofR(r) is 1, and this distance of 26.9 is taken asS) Kukukovaet al[12]screened out 3 parameters which could describe well the macro-mixing from previous mixing studies by chemical engineering and other discipline communities:intensity of segregation(variance in concentration)I(t),scale of segregation(length of spatial proximity)S(t), andexposure(rate of change in segregation)X(t). Using artificial check-board concentration fields as testing models,they showed that any index itself fails to characterize the mixing process. In our opinion, the scale of segregation is simply the most important and relevant index for macro-mixing. AsS(t) decreases, the contact area between different packets increases, giving better conditions (greater exposure) for mass exchange and composition homogenization, so thatI(t) decreases andX(t) evolves. Since bothI(t) andX(t) are related with molecular diffusion, or micro-mixing dependent,we think that only the scale of segregation plays the pure role in indexing the macro-mixing. Looking at the concentration distribution sketched in Fig. 4, when macro-mixing approaches the ending point, the sharp stripes indicate that the concentration difference is still large, but the scale of segregation is already smaller than the probe size and the Kolmogorov scale,suggesting local homogenization and macromixedness. However, the intensity of segregation and the exposure remain large, suggesting erroneously a status far from ideal mixing on a macroscopic point of view. It is thus deduced that the macro-mixing study should be based mainly on the scale of segregation. It is believed not an efficient tactics to tackle a macro-mixing problem by making macro-mixing and micro-mixing entangled together. Fig. 4 Fine scale view of segregation at ending point of macro-mixingvsprobe size and Kolmogorov scale There is no technical report on experimental determination of scale of segregation to date. The difficulty comes naturally from the high spatial resolution for identifying scale of segregation, the ability discerning the property difference on a small spatial scale, and the necessity of 3D measurement for capturing the global nature of macro-mixing. Among all possible measurement techniques, the optical high resolution instrumentation with a planar illumination seems to deserve intensive developmental efforts. There often exists in a reactor some dead zone,and the tracer enters or leaves this zone with much difficulty. The dead zone obstacles the measurement of mixing time and interpretation of measurement data.In experiment with a single detection point, if it happens to be in the dead zone, the mixing time would be excessively long, failing to reflect the global mixing performance; on the contrary if detection is outside the dead zone, the measured mixing time ignores largely the dead zone. Fig. 5 RTD curves corresponding respectively to normal flow system and that with dead zone[15] If a reactor is taken as a “black box”, the tracer experiment for mixing time is the response of the black box, so does the RTD measurement. This motivates us to wonder what is the inherent relation between the mixing time and theE(θ) curve, since both are the superficial expression of mixing and hydrodynamics in a reactor? The interrelation between these two scenarios deserves serious exploration. Suggestion 3When conducting RTD study in a flow reactor with strong mixing capacity (strong internal circulation existing, as in stirred tank, loop reactor), tracer is better to be injected in the strong mixing region, thus the response in the outlet stream is the least influenced by flow rate and location of the inlet stream, resulted in better suppression of subjectivity in experiment. The obtainedE(θ) curve contains more emphasis on the roles of materials interchange, dispersion, mixing and homogenization.In fact, the distributor of key reactant is often located inside the strong mixing region (impeller region in stirred vessels) in industrial reactors, particularly for reactors having special requirements on macro-mixing and micro-mixing. This has become seemingly the consensus of chemical reaction engineering community. Putting the mixing time measurement and the RTD study (both by tracer technique) side by side, it is easy to observe that to find out a dead zone, several macro-mixing experiments have to be conducted with a single detection probe at different locations and the mixing times to be decided with different homogenization criteria (90%, 95%, 99%etc), while only one RTD experiment is necessary since RTD is the global response of the reactor as a whole. More in-depth comprehension of these two differentlooking approaches is needed. In recent years, the mixing study in multiphase reactors is being advanced smoothly. Relatively, the knowledge on macro-mixing of continuous phase is more abundant, due to being strongly motivated by academic and industrial needs in addition to sufficiently developed experimental techniques. Zhaoet al[16]measured the mixing time of continuous phase(water) in a stirred kerosene-water system, and observed the influence of the holdup of dispersed kerosene on the mixing time is no more monotonic.Zhanget al[17]studied the macro-mixing in a gas-liquid stirred tank. Chenget al[18]studied a gas-liquid-liquid system in a stirred tank. Zhanget al[19]measured the mixing time of continuous water phase in a loop reactor. The measurement techniques and data reduction procedures are mainly that developed successfully for single phase stirred tanks. Macro-mixing of dispersed phase also has important significance in chemical reaction engineering and in industrial applications. When adding some dispersed phase reactant into a liquidliquid system in which chemical reaction has gone to certain extent, chemical engineers feel that the larger the amount added, the easier the re-homogenization is.This feeling is substantiated by a recent work on the macro-mixing of dispersed phase in a liquid-liquid stirred system[20]. Evidently, macro-mixing of continuous phase is realized through bulk convection,vortex motion and associated tear/distortion; however,additional drop-drop interactions (breakup and coalescence) are absolutely indispensable for macro-mixing of dispersed phase. Only one experimental report of macro-mixing of dispersed phase is available to the authors’ knowledge.Chenget al[20]measured the macro-mixing of water drops in an immiscible water-silicon oil stirred system using PLIF technique. The stirred tank wasT= 0.12 m in diameter, stirred by either of four radial and axial impellers. After fluorescent tracer was injected, the images of a finite monitoring window were taken continuously, and converted into non-dimensional concentration maps, from which the time trace of variance was evaluated, and the instant when the variance dropped to a threshold was assigned as the mixing time. The results indicated that the mixing time of dispersed phase was several tens times that of continuous phase, because coalescence/breakup of drops were heavily relied on, in addition to the samemechanisms of convection/turbulence/deformation as occurring in the continuous phase. Also, axial impeller led to longer mixing time than radial one for the latter exerted strong shear to favor in drop interaction.Moreover, the mixing time of dispersed phase decreased as its holdup increased (Fig. 6) because larger volume fraction of dispersed phase gave higher frequency of drop coalescence, favoring the homogenization of tracer among water drops. Fig. 6 Mixing time as a function of dispersed water volume fraction[21](Rushton impeller,C=T/3,N=380 r·min-1) 50 years ago, Curlet al[22-23]demonstrated by experiment and theoretical analysis that the mixing of dispersed phase had dominant effects on the reaction rate and product yield of non-first order and mass transfer-controlled reactions occurring in a dispersed phase. They introduced a qualitative index related to the mixing rate of dispersed phase, but they failed to give the macro-mixing time values. In subsequent 50 years, the study of dispersed phase macro-mixing gains little progress, mainly due to difficulty in experimental technique. Chenget al[20]realized the experimental determination of mixing time of dispersed phase, but it was a single-injection/local-detection technique, and further improvements to a new technique for measuring the global mixing time of dispersed phase are necessary. There are plenty of experimental data on mixing time and empirical correlations for practical applications. Nevertheless, these do not suffice in design and optimization of industrial reactors and configuration innovation. Looking back at the existing literatures, the mathematical models for mixing time simulation can be divided roughly into four categories:diffusion model, bulk flow model, compartment (zone)model, and CFD model[3], with more physical and chemical mechanisms incorporated in increasing order. 文獻[1]規定鏈路總衰減量為30dB,文獻[2]規定鏈路總衰減量為20dB,相當于本文方法中可調衰減器衰減量分別為20dB和10dB時的情況. The first three categories of model are simple and easy for computing, but the model parameters have to be empirically estimated, and their extrapolating application seems risky. Therefore, this category of model attracts only limited response from chemical engineers, and is replaced gradually by CFD macro-mixing models. Along with the rapid development of CFD technique in recent decades, precision of numerical simulation is also enhanced, that pushes the numerical study into a wider range of application. The general numerical procedure for simulating macro-mixing is as follows:(1) Numerical solution of fluid flow in the reactor; (2) Solving the transport equation of tracer across the flow field; (3) Get the statistics of tracer concentration at the detection point or detection window; (4) Determine the mixing time according to the preset criterion of homogenization index. The convective diffusion equation to be solved in step 2 is Such a procedure is adopted successfully for simulating macro-mixing in single-phase stirred tanks without and with draft tube[6,24-26]. If Eq. (5) is converted non-dimensional, we have whereLis the characteristic length, andu0the characteristic velocity. The importance of the right-hand term is relied on the effective diffusivityDefftherein. As known from typical results of turbulent stirred tank simulation,Deffis generally below the level of 1×10⁻³m2·s-1, and (Deff/Lu0)=0.001 whenL=1 m andu0=1 m·s-1. Thus, the right hand of Eq. (4)is a small quantity, negligible as compared with theconvective term in the left-hand side of Eq. (4). This approximates Eq. (4) to According to Eq. (5), any infinitesimal fluid element will move following a streamline, and never jumps onto another streamline, so that the tracer will not be dispersed and spread to the whole reactor. In fact, the macro-mixing in stirred systems means that the segregation is reduced gradually down to the Kolmogorov scale, through repeated birth, distortion and death of random vortices along their flow and mutual interaction. These factors should be included into Eq. (5) to establish a mathematical model of pure macro-mixing. Although molecular mixing does exist concurrently, macro-mixing study has better to exclude diffusion temporarily so as to focus on the fluid mechanics factors impacting on macro-mixing.The right-hand side term of Eq. (5) should be re-modeled and formulated. Another influencing factor to macro-mixing is recognized to be so-called “macro-instability” at a larger scale beyond the time-averaged turbulent flow field[27], which enhances flow packets exchange but is not fully considered in the standardk-εmodel based CFD simulations. So far, no report is available on the effect of “macro- instability” on macro-mixing time. Suggestion 4Since each computational cell is assumed as ideally mixed in numerical schemes, as a compromise for the key step 2 in the general procedure of macro-mixing simulation, the concentration fieldc(x,t) at timetis suggested to be decided byc(x,tt-Δ ) at instanttt-Δ and its transport by fluid flow, ignoring theDeffterms. Exemplified with a 2D case in Fig. 7, the governing equation of the concentration at the central cell is thus Discretizing and mathematical rearrangement lead to whereAis the cell face area, ΔVthe cell volume, and subscriptiindexes all in-flow and out-flow faces. Fig. 7 Sketch of tracer transport with respect to central cell P Even more simplified form will be resulted by neglecting the temporal term in Eq. (6) (eligible for large Δt/ΔVon dense grid), and the concentration on the central node becomes the weighted average of all tracer-carrying entering streams. Nevertheless, such simplified algorithms need sufficient exploration and validation of their reliability. In recent years, the simulation study on macro-mixing time of multiphase reactors proceeds actively. For example, Chenget al[28]simulated numerically the macro-mixing in an immiscible liquid-liquid stirred tank, and Zhanget al[29]simulated macro-mixing in a gas-liquid stirred tank using large eddy simulation method:both simulation works as good addition to experimental study of multiphase stirred systems. It should be noted that the accurate simulation of fluid flow is the foundation for further simulation of macro-mixing. Therefore, serious efforts need to be devoted continuously to developing models and algorithms for turbulent multiphase flow in agitating vessels, so that the requirements of great computational grid and moderate CPU time can be met for dealing with large scale industrial reactors. In this respect, the explicit algebraic stress model (EASM)shows a good promise and is worthy of further development and application[30]. Some conclusions from the above analysis are as follows. (1) The commonly used definitions and data of mixing time contain implicitly certain degree of subjectivity, and they fail to objectively represent the global macro-mixing status in the reactor as a whole.Need to develop a rational definition of mixing time of a global sense and the corresponding experimental methods for direct and indirect measurement. (2) By its true nature, macro-mixing is a purely physical and hydrodynamic process. Using chemical methods introduces an extra factor of interference of micro-mixing. It is desired to exclude chemical factors from the macro-mixing study, so that the separate roles of macro-mixing and micro-mixing can be clearly understood. (3) The macro-mixing of continuous and dispersed phases in multiphase systems differ in mechanism,measurement technique, simulation methodetc. There currently lacks specific study on macro-mixing of dispersed phase in stirred tanks, for which more efforts should be devoted. It seems that study of macro-mixing in reactors is far from reaching a conclusive end. Some topics listed below are worthwhile: (1) When assessing the mixing performance of a reactor, the popularly used index is the mixing time. In fact, chemical and product engineering desires sometimes the mixing on a finer scale, as in mixing raw rubber with carbon black fines. The index like scale of segregation is thought valuable for assessing the quality of mixing operation. Presently, a systematic procedure also needs to be developed for study of the segregation scale reduction for industrial mixing. This deserves the attention from chemical engineers. (2) The mixing time is only an intermediate index,because our ultimate goal of study is to assess the reactor performance in reactant conversion and product selectivity. What is the quantitative relationship between mixing time and the reactor production performance? Can we find a more comprehensive index or procedure to predict the final reactor yield and help us to optimize the reactor configuration and operation? (3) The theory of RTD is one side of the external demonstration of global mixing ability of a reactor.What is the relationship different aspects as compared with the mixing time? Can we retrieve the mixing time from a RTD experiment? This is what we really want to find out. [1] Harnby N, Edwards M F, Nienow A W. Mixing in the Process Industries [M]. London:Butterworths, 1985. [2] Santos R J, Dias M M, Lopes J C B. Ch. 4 Mixing through half a century of chemical engineering// Dias R, Lima R, Martins A A, Mata T M. Single and Two-Phase Flows on Chemical and Biomedical Engineering [M]. Hilversum Bentham Science Publishers, 2012:79-112. [3] Zhang Qinghua(張慶華), Mao Zaisha(毛在砂), Yang Chao(楊超),Zhao Chengjun(趙承軍). Research progress of liquid-phase mixing time in stirred tanks [J].Chemical Industry and Engineering Progress(化工進展), 2008, 27 (10):1544-1550. [4] Cheng Dang(程蕩), Cheng Jingcai(程景才), Yong Yumei(雍玉梅),Yang Chao(楊超), Mao Zaisha(毛在砂). Research progress of macro-mixing in multiphase stirred vessels [J].Chemical Engineering(China) (化學工程), 2011, 39 (6):59-64. [5] Ascanio G. Mixing time in stirred vessels:a review of experimental techniques [J].Chinese Journal of Chemical Engineering, 2015,23(7):1065-1076. [6] Zhang Qinghua(張慶華), Mao Zaisha(毛在砂), Yang Chao(楊超),Wang Zheng(王正). A new method for determining mixing time in stirred tanks [J].Journal of Chemical Industry and Engineering(China) (化工學報), 2007, 58 (8):1891-1896. [7] Cabaret F, Bonnot S, Fradette L, Tanguy P A. Mixing time analysis using colorimetric methods and image processing [J].Industrial &Engineering Chemistry Research, 2007, 46 (14):5032-5042. [8] Hu Y Y, Wang W T, Shao T, Yang J C, Cheng Y. Visualization of reactive and non-reactive mixing processes in a stirred tank using planar laser induced fluorescence (PLIF) technique [J].Chemical Engineering Research and Design, 2012, 90 (4):524-533. [9] Liu M, Tilton J N. Spatial distributions of mean age and higher moments in steady continuous flows [J].AIChE Journal, 2010, 56(10):2561-2572. [10] Liu M. Quantitative characterisation of mixing in stirred tank reactors with mean age distribution [J].Canadian Journal of Chemical Engineering, 2011, 89 (5):1018-1028. [11] Danckwerts P V. The definition and measurement of some characteristics of mixtures [J].Applied Scientific Research A, 1952, 3:279-296. [12] Kukukova A, Aubin J, Kresta S. A new definition of mixing and segregation:three dimensions of a key process variable [J].Chemical Engineering Research and Design, 2009, 87 (4):633-647. [13] Danckwerts P V. Continuous flow systems. Distribution of residence times [J].Chemical Engineering Science, 1953, 2:1-13. [14] Nauman E B. Residence time theory [J].Industrial & Engineering Chemistry Research, 2008, 47 (10):3752-3766. [15] Mao Zaisha(毛在砂), Chia Yung Chen(陳家鏞). Elemental Chemical Reaction Engineering(化學反應工程學基礎) [M]. Beijing:Science Press, 2004. [16] Zhao Y C, Li X Y, Cheng J C, Yang C, Mao Z S. Experimental study on liquid-liquid macro-mixing in a stirred tank [J].Industrial &Engineering Chemistry Research, 2011, 50 (10):5952-5958. [17] Zhang Q H, Yang C, Mao Z S, Zhao C J. Experimental determination and numerical simulation of mixing time in a gas-liquid stirred tank[J].Chemical Engineering Science, 2009, 64 (12):2926-2933. [18] Cheng D, Cheng J C, Li X Y, Wang X, Yang C, Mao Z S.Experimental study on gas-liquid-liquid macro-mixing in a stirred tank [J].Chemical Engineering Science, 2012, 75:256-266. [19] Zhang W P, Yong Y M, Zhang G J, Yang C, Mao Z S. Mixing characteristics and bubble behaviors in an airlift internal loop reactor with low aspect ratio [J].Chinese Journal of Chemical Engineering,2014, 22 (6):611-621. [20] Cheng D, Feng X, Cheng J C, Yang C, Mao Z S. Experimental study on the dispersed phase macro-mixing in an immiscible liquid-liquid stirred reactor [J].Chemical Engineering Science, 2015, 126:196-203. [21] Cheng Dang(程蕩). Numerical simulation and experimental studies on mixing processes in liquid-liquid and gas-liquid-liquid stirred reactors [D]. Beijing:Institute of Process Engineering, CAS, 2014. [22] Curl R L. Dispersed phase mixing (Ⅰ):Theory and effects in simple reactors [J].AIChE Journal, 1963, 9:175-181. [23] Miller R, Ralph J, Curl R L, Towell G. Dispersed phase mixing (Ⅱ):Measurements in organic dispersed systems [J].AIChE Journal, 1963,9:196-202. [24] Wang Zheng(王正), Mao Zaisha(毛在砂), Shen Xiangqian(沈湘黔).Numerical simulation of macroscopic mixing in a Rushton impeller stirred tank [J].Chinese Journal of Process Engineering(過程工程學報), 2006, 6 (6):857-863. [25] Wang Z, Mao Z S, Yang C, Shen X Q. CFD approach to the effect of mixing and draft tube on the precipitation of barium sulfate in a continuous stirred tank [J].Chinese Journal of Chemical Engineering,2006, 14 (6):713-722. [26] Min J, Gao Z M. Large eddy simulations of mixing time in a stirred tank [J].Chinese Journal of Chemical Engineering, 2006, 14 (1):1-7.[27] Fan J H, Wang Y D, Fei W Y. Large eddy simulations of flow instabilities in a stirred tank generated by a Rushton turbine [J].Chinese Journal of Chemical Engineering, 2007, 15 (2):200-208. [28] Cheng D, Feng X, Cheng J C, Yang C. Numerical simulation of macro-mixing in liquid-liquid stirred tanks [J].Chemical Engineering Science, 2013, 101:272-282. [29] Zhang Q H, Yang C, Mao Z-S, Mu J J. Large eddy simulation of turbulent flow and mixing time in a gas-liquid stirred tank [J].Industrial & Engineering Chemistry Research, 2012, 51 (30):10124-10131. [30] Feng X, Li X Y, Yang C, Mao Z S. Numerical simulation of liquid-liquid turbulent flow in a stirred tank with an explicit algebraic stress model [J].Chemical Engineering Research and Design, 2013,91 (11):2112-2121.
2.2 Other definition of mixing time
2.3 Measurement technique
3 Indices to macro-mixing status


4 RTDversusmacro-mixing
5 Multiphase reactor
5.1 Macro-mixing of continuous phase
5.2 Macro-mixing of dispersed phase

6 Simulation of macro -mixing
6.1 Mathematical model of macro-mixing
6.2 Numerical simulation of mixing time


6.3 Simulation in multiphase systems
7 Conclusions and perspectives
