基于過渡層的縱向電導率凍土特征監測
2014-03-19 03:43:44VladimirEfremov
黑龍江大學工程學報 2014年3期
Vladimir N.Efremov
(俄羅斯科學院西伯利亞分院麥爾尼科夫凍土研究所,雅庫茨克677010,俄羅斯)
0 Introduction
Monitoring of permafrost condition is essential to control the strength of the foundation soils of buildings and engineering constructions in permafrost.Traditionally it is performed by means of soil temperature measurements in boreholes.However,ground temperature is not always an indicator of their frozen state degree.The frozen state depends on ice and unfrozen water contents.This particularly refers to fine-grained and saline soils,which have the freezing point below 0℃.In these areas,it is appropriate to monitor the soil condition by means of geophysical measurements at medium frequencies of the electromagnetic field.In this sense,it is appropriate to use surface impedance measurements in the frequency range of 10 to 1 000 kHz with determination of longitudinal conductivity of the transition layer of permafrost for monitoring[1].The transition layer of perennially frozen deposits identified in the geoelectric section of permafrost is located beneath the seasonally thawed layer and corresponds to the Yanovsky's[2]definition of the transition layer as the“upper layer of permafrost”.To a certain extent,it corresponds to the notion of interbedded layer of syngenetic permafrost with the thickness of 1~2 m according to Shur Y.L.[3].Longitudinal conductivity of the transition layer is determined by radioimpedance sounding data interpretation.
1 Methods
The seasonally thawed layer and upper permafrost subject to seasonal variations of temperature,form together,as is known,the layer of annual temperature fluctuations.With regard to the geoelectric structure,it would be appropriate to divide the layer of annual temperature fluctuations into two layers-the seasonally thawed layer and the permanently frozen layer of seasonally changing parameters,defined here as the transition layer.Temperature and thickness are variables.Electrical resistivity of the transition layer is also variable,which depends on phase states of free and interfacial water contained.Longitudinal conductivity and thickness of the transition layer with varying temperature have a strong impact on surface impedance of permafrost.During the period of intensive seasonal thaw,the surface impedance modulus reduces in linear dependence of increasing longitudinal conductivity of the layer of annual temperature fluctuations(Fig.1).Therefore,seasonal variations of permafrost surface impedance are determined not only by longitudinal conductivity of the seasonally thawed layer,but also by longitudinal conductivity of the layer of seasonal temperature variations in general[1].

Fig.1 Reduction of the surface impedance modulus at frequency of 549 kHz with increase in longitudinal conductivity of the layer of annual temperature fluctuations in the period from May 11 to July 31,2007
In geoelectrical meaning,the transition layer of frozen deposits has seasonally changing gradients of temperature and electrical resistivity variations with depth and it corresponds to the second layer of the geoelectric section of permafrost according to Borovinsky B.A.[4].However,the thickness of transition layer also varies depending on the season.Lying below the seasonally thawed layer,it notable for its frozen condition and higher electrical resistivity values.In the model of permafrost geoelectric structure the transition layer,as we think,is the second layer after the seasonally thawed layer.It is a perennially frozen layer with seasonally changing values of thickness,temperature and electrical resistivity,which differ from the constant values for the underlying layer.The transition layer is characterized by longitudinal conductivity:

where h2is thickness of the transition layer;ρ2is electrical resistivity value averaged for the transition layer.
The thickness of the transition layer is in the range of 1 to 20 m,and its electrical resistivity is in the range of 102to 105Ohm*m.Accordingly,longitudinal conductivity values S2may be in the range of 0.01 to 200 ms.
From 2005 to 2012 observations of seasonal variations of surface impedance had been conducted in two control sites in Central Yakutia,located at the distance of 200 m from each other under the same geological conditions,but the landscapes were different.The first site was located in a forest,the thaw depth was 1.3 m and the second site was open,the thaw depth was 1.9 m.The surficial materials in the area consist of sands and silts up to 30 m in total thickness,overlying up to 300 m of frozen rocks.Geological and geocryological conditions at both sites are typical of Central Yakutia.
The surface impedance measurements were taken by receiving the horizontal electric component of the Exfield to a symmetric ungrounded detector line and by receiving the horizontal magnetic component of the Hyfield to a framework magnetic antenna.The measurements were taken in the same points once a week during the warm season and in rare thaw periods in the winter.Measurements were made using the IPI-1 000 surface impedance meter[5].This instrument is a selective microvoltmeter-phasemeter operating in the frequency range of 10 to 1 000 kHz and measuring the magnitude of wave impedance with an accuracy of 5% and phase angle with an accuracy of 1°.
Longitudinal conductivity of the transition layer at each point for a certain time was calculated by the formula(1)using the values h2and ρ2.These values were obtained as a result of interpretation with the help of the“Impedance”software package[6],the modulus and phase angle data of surface impedance obtained by radioimpedance sounding[7].
2 Experimental results and discussion
The seasonal variations of the transition layer longitudinal conductivity obtained at experimental sites show that its changes correspond to the processes of ground freezing and thawing.For example,in the sounding area of the forest site the longitudinal conductivity S2values increased from 0.4 ms in May to 2.5 ms in October.
The transition layer is formed as a result of heat penetration into the soil during the warm months or cold penetration into the soil during the cold season.Changes in longitudinal conductivity of the transition layer soils are more rapid,than those of the seasonally thawed layer due to its greater thickness(Fig.2).For example,during the thaw period from 31.05.07 to 31.07.07,longitudinal conductivity of the seasonally thawed layer increased 3 times and longitudinal conductivity of the transition layer increased 5 times.With increase in temperature,the electrical resistivity of the transition layer decreases and its thickness increases.As a result of this simultaneous double action,caused by increase in thickness of the transition layer and decrease in its electrical resistivity,longitudinal conductivity of the layer S2rises sharply in the period from May to July.Then stabilization of S2svalues takes place followed by a sharp decrease during November-December and more gradual decrease in February,followed by stabilization during March-April.Changes in soil temperature of the transition layer occur in the range of 0 to-10℃,i.e.in temperature range at which free and then part of interfacial ground water begin to freeze.Therefore,the corresponding changes in its electrical resistivity are significant.
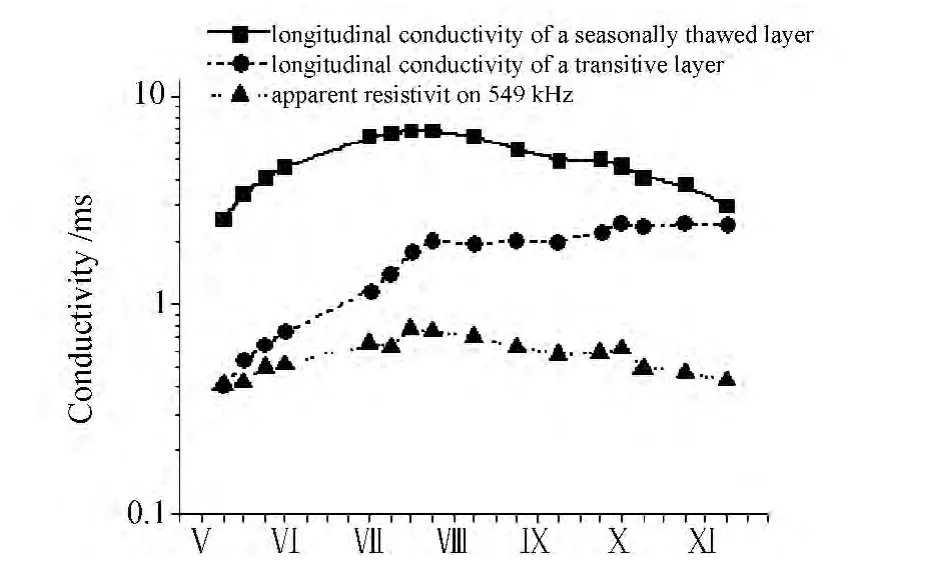
Fig.2 The seasonal changes in longitudinal conductivities of the seasonally thawed and transition layers as well as changes in ground effective conductivity at frequency of 549 kHz in the forest area during May to November,2007
Nature of longitudinal conductivity changes of the layers is similar,but it has some peculiarities.In the upper,seasonally thawed layer longitudinal conductivity increases sharply from May to June.This can be explained by a rapid increase in thickness of the thawed layer.First it is due to the thawing front,which is close to ground surface,and then due to increase in thermal current,caused by high-solar intensity.
Longitudinal conductivity increases sharply in the lower frozen layer of seasonally changing parameters in the period from May till July,i.e.this period is longer than that of the seasonally thawed layer.The sharp rise can be explained by the double action of increase in thickness and decrease in its electrical resistivity as a result of heat penetration into the soil.Decrease in electrical resistivity occurs due to temperature increase in the layer to the water thawing point.In this region,including temperatures close to 0℃,part of the deposits will become plastic frozen or thawed with a corresponding decrease in electrical resistivity.As it is known,electrical resistivity of fine deposits at low negative temperature values(0~-5℃)may have low values.
From August to September heat penetration rates reduce considerably due to decrease in solar intensity and increase in thermal insulating properties of the surface layer.Therefore,from July to August the increase in thickness of seasonally thawed and surface layers becomes less significant.On the other hand,electrical resistivity of the seasonally thawed layer increases and decrease in electrical resistivity of the surface layer reduces.As a result of these processes,stabilization of longitudinal conductivity values of both layers takes place from August to September.This is also reflected on stabilization of surface impedance values.
In October,together with downward freezing of the seasonally thawed layer,its longitudinal conductivity decreases.Longitudinal conductivity of the transition layer does not change to a considerable degree in October.
As it is currently typical for Yakutsk region,the periods,corresponding to characteristic changes in longitudinal conductivity of the seasonally-active layer have approximately following position in the annual cycle:thawing period(May-June-July);stabilization period of thawing(August-September-October);freezing period(November-December-January);stabilization period of freezing(February-March-April).The duration of these periods varies and depends not only on climate changes but mostly on aspect,snow depth,surface cover(forested or open),and soil conditions (grain size,thermal conductivity).
In recent years,in the open and forest areas,a tendency toward reduction in the amplitude of variations of ground resistivity has been observed.These changes can be explained by increase in snow depth and climate warming.The increase in depth of thaw is confirmed by probe measurements at the sites.These data confirm the fact that seasonal variations of surface impedance and climate changes are connected.
It should be noted,that the effect of longitudinal conductivity of the frozen transition layer on surface impedance and ground apparent resistivity may be more significant,than the effect of longitudinal conductivity of the seasonally thawed layer.The most significant seasonal changes of longitudinal conductivity of the perennially frozen transition layer are expected if it is represented by syngenetic permafrost with high ice content.
3 Conclusions
Longitudinal conductivity of the transition layer identified in the geoelectric section of permafrost shows seasonal variations.Seasonal changes in longitudinal conductivity of this layer are more significant and more dynamic than those of the active layer.Consequently,this layer has a considerable effect on surface impedance of permafrost in Central Yakutia.
For these reasons,the geoelectrical monitoring of the ground state and its geocryological condition will be more efficient if the monitoring is conducted based on longitudinal conductivity changes of the transition layer.
Monitoring of longitudinal conductivity of the transition layer in permafrost should be based on the radioimpedance interpretation data at several frequencies.
[1] Efremov V N.Radiowave monitoring of seasonal thawing and freezing of the active layer of permafrost.In:Proceedings of the International Conference“Cryogenic Resources of Polar and Mountain Regions.State and Prospects of Engineering Permafrost Studies”[C]//Tyumen,2008,179-182.
[2] Yanovsky V K.Expedition to the Pechora River to identify the southern boundary of permafrost[J].Proceedings of the Permafrost Commission,Academy of Sciences of the USSR Press.Mos-cow-Leningrad,1988,2:66-149.
[3] Shur Y L.About the transition layer.Methods of geocryological investigations[J].Transactions of the Russian Research Institute of Hydrogeology and Engineering Geology(VSEGINGEO),1975,98:82-85.
[4] Borovinsky B A.Electrical and Seismic Surveys of Permafrost and Glaciers[M].Moscow:Nauka,1969.
[5] Parfentiev P A,Pertel M I.The measuring instrument for surface impedance in the VLF-MF bands.The low-frequency waveguide“Earth-ionosphere”[J].Galim:Alma-Ata,1991,133-135.
[6] Angarhaeva L K.The“Impedance”Software Package for Radioimpedance Sounding[M].The Certificate of Official Registration of the Software#2002610893.Moscow:Rospatent,2002.
[7] Efremov V N.Radioimpedance Sounding of Frozen Soils[M].Yakutsk:Melnikov Permafrost Institute SB RAS Press,2013.

- 黑龍江大學工程學報的其它文章
- The harm of perennial frozen soil to the pipeline exporting the crude oil from Mohe county to Daqing city
- Overview of research methods of frozen soil hydrology in Heilongjiang Province
- Environmental geochemistry of urban areas in Yakutia
- A permafrost factor in the development of deformations on the Amur Highway
- The problem of project statement of construction principles of buildings and facilities in permafrost
- The forecast of a temperature regime of soils containing the pile foundation of a pithead on diamond-mining mines of cryolithic zone