Investigation on Hydrodynamic Performance of T-shaped Barge in Topside Transportation
2013-02-27 09:05:42XUXinYANGJianminLIXinLUHaining
船舶力學 2013年12期
XU Xin,YANG Jian-min,LI Xin,LU Hai-ning
(State Key Laboratory of Ocean Engineering,Shanghai Jiao Tong University,Shanghai 200240,China)
1 Introduction
Topside installation of platform in open waters has always been a great challenge for offshore operation.Floatover is a new method to install the integrated topside onto a platform with some substantial advantages,such as high capacity,short project time and low costs[1-2].In this method,the topside is constructed as one large integrated module and assembled completely on shore,then is transported by a barge to installation site,and finally transferred from the transportation barge onto the supporting structure through barge ballasting as shown as Fig.1(a)[3-4].
So far over thirty floatover installations have been carried out successfully in open waters,and the largest topside weighted over 20 000 tons[5].As the topside is becoming increasingly heavier,the installation barge is in need of larger displacement and breadth to increase the lifting capacity needed,while the barge breadth is also limited to the size of jacket slot.Thus a T-shaped barge concept is put forward to eliminate this limit by its narrower bow half and its wider stern half which contributes to a larger displacement and a better transverse stability(Fig.1(b)).Consequently,it allows the vertical COG(center of gravity)of the transported topside to be higher above the barge deck,which permits a larger air gap for easier and safer installation.For example,a special T-Shaped Barge TCB-2(Fig.1(c))was purpose-built to install the 21 800Te Lunskoye-A(Lun-A)Topsides and it broke the original world record of the heaviest topside in June 2006[6].

Fig.1 Floatover installation using a T-Shaped Barge
The T-shaped barge has some unique characteristics different from conventional barge which has the same breadth at bow and stern.The topside transportation is concerned by many designers in that the high COG of the system leads to large motion responses especially in roll mode.In order to investigate hydrodynamic performance of the T-shaped barge,numerical simulations are carried out for two T-shaped barges and a conventional barge.Data from model tests performed at SKLOE(State Key Lab of Ocean Engineering,Shanghai Jiao Tong U-niversity,China)is also presented to verify the numerical result.
2 Mathematical formulation
2.1 Hydrodynamic analysis in frequency domain
Assuming the incompressible and inviscid flow with irrotational motion,the velocity potential Φ is introduced,which satisfies the Laplace equation within the fluid domain.The governing equation and linearized boundary conditions which are satisfied by the diffraction and radiation potentials φm(m=D or j,j=1~6)are summarized as follows[7]:
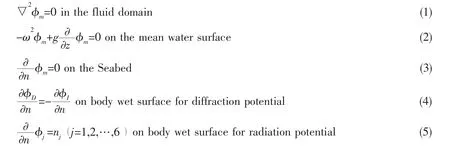
where φIis the incident wave potential; ω is the wave frequency;the unit vector n→ is normal to the body boundary and points out of the fluid domain.
The boundary-value problem of first order in the wave amplitude can be derived and solved,and the details can be found in previous research[7-10].
Based on the diffraction pressure field,the linearized hydrodynamic forces(and moments)acting on the body are represented as follows:

where Fiis the wave exciting force in the i-th mode of motion of the body.Based on the radiation field,the added mass Aijand damping coefficient Bijin the i-th direction due to the jth mode of motion can be written as

The 2nd order mean drift forces and moments can be calculated from the first-order linear potential.There are two alternatives available including near field method[11](direct pressure integration of the pressure on the body surface)and far field method(application of momentum theorem)[12-13].The present study is based on far field method.The horizontal drift forces and vertical moments are evaluated from the following expressions,
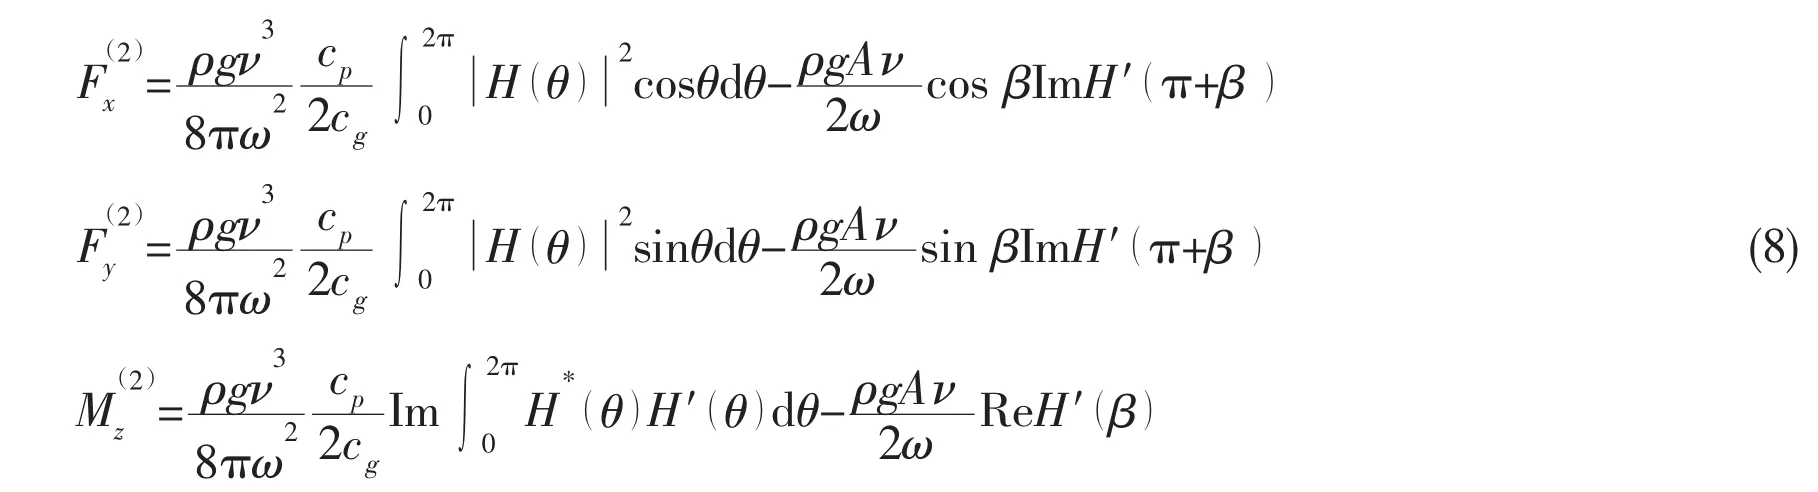
where cpis the phase velocity,cgis the group velocity,H*denotes the complex conjugate,H′denotes the derivative of the Kochin function,and
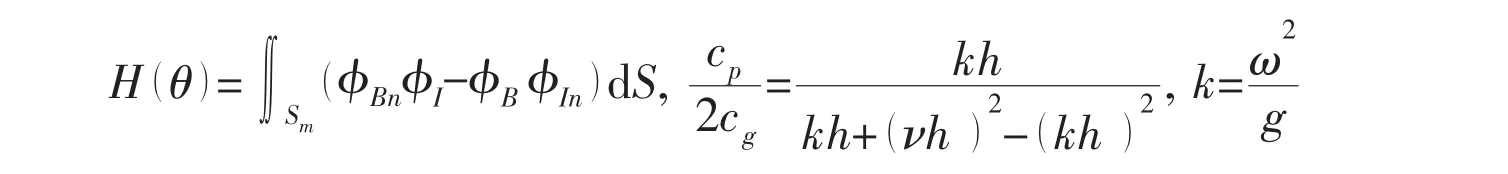
where,φB=φD+φRis the part of the total potential due to bodies.
2.2 Motion equation in frequency domain
The equation of the rigid body motions of 6 DOF(degree of freedom)in frequency domain can be expressed as

where,Mijis inertia matrix;Aijis added mass matrix;Dijis potential damping matrix;Kijis restoring coefficient matrix;Fiis first order wave force and moment;ξjis vector containing the three translational and three rotational displacements about the coordinate axes in j-mode.
The first order motion RAO(response amplitude operator)can be expressed as:

2.3 Motion equation in time domain
Based on Newton’s second law,the 6-DOF non-linear motion equations for a rigid body with respective to COG can be expressed as:
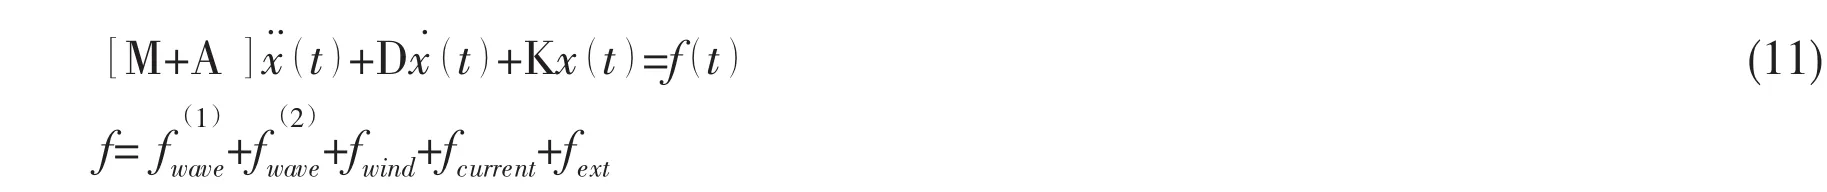
where f(t)are the external force and moment vector including 1st order wave exciting force,2nd wave drift force,wind force,drag force and other connecting forces.
Assuming linear behavior of wave effects and considering impulses in the components of motion,the motion equation of a floating body can be written as[14]

where,the convolution terms capture the effect that the changes in momentum of the fluid at a particular time affect the motion at subsequent time,which is known as fluid memory effect.R(t)is the retardation function which depends on the geometry of the body,and can be calculated by added mass and damping coefficient as follows:

All the coefficient matrixes in Eq.12 can be obtained in frequency domain analysis.
In the numerical simulation,the fourth order Runge-Kutta method is used for the numerical integration of motion equation(Eq.12)which is a second order ordinary differential equation,and the formula and code detail can be found in the Refs.[15-16].
3 Numerical simulation
3.1 Description of T-shaped barge transportation system
The transportation system contains a T-shaped barge,topside and a DSF(deck support frame)with 10 DSU(deck support units).The topside is supported by DSF which is used to distribute highly concentrated topside leg loads onto the barge frames.The barge is 215 m in length,14.25 m in depth,and the width of the bow half is 42 m,while the stern half is 65m.Fig.2 and Fig.3 show the right side view and the top view of the transportation system.The main particulars of the barge and topside are listed in Tab.1.In the transportation configuration,the topside is fixed on the barge by welding,so the whole system can be regarded as a rigid body.
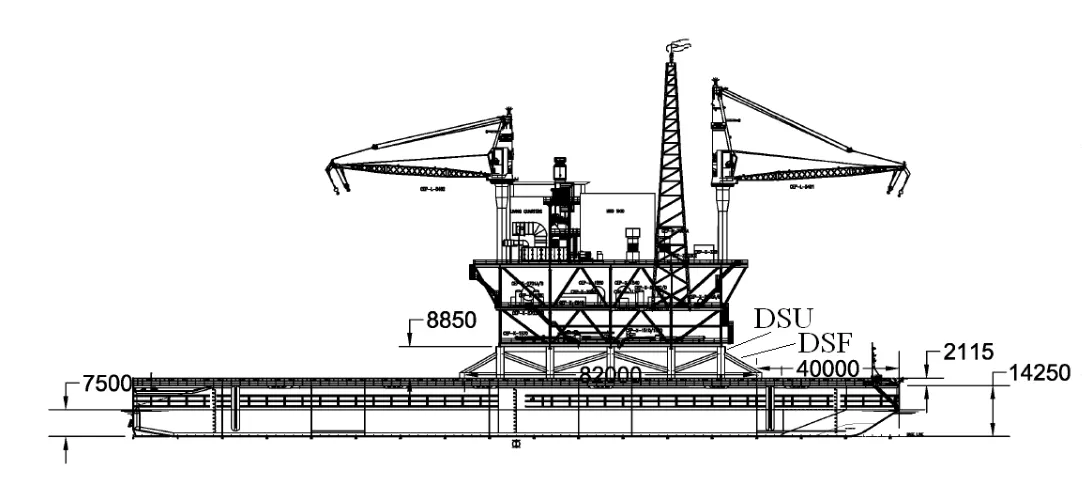
Fig.2 The right side view of barge with topside
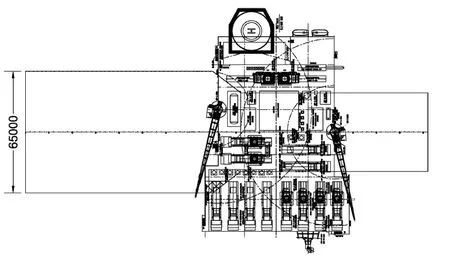
Fig.3 The top view of barge with topside

Tab.1 Main particulars of transportation barge system
3.2 Hydrodynamic model of barges
In order to investigate the unique character of T-shaped barge,we study three different barges including one conventional barge and two T-shaped barges.As shown as Fig.4,barge-3 is the T-shaped barge described above;barge-2 is also a T-shaped barge with 42 m bow breadth(same with barge-3)and 52.5 m stern;barge-1 is a conventional barge with 52.5 m breadth.Fig.5 shows the panel models of these three barges and they are meshed with 2 450,2 020 and 1 796 elements respectively.We adopt the same draft for these three barges for ease of hydrodynamic performance comparison in frequency domain analysis.
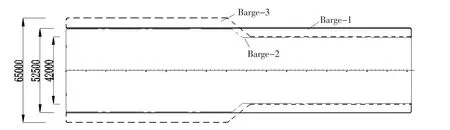
Fig.4 The top view of three barge contours
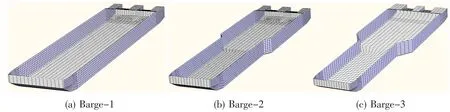
Fig.5 The panel models of three barges
Numerical simulation in frequency domain was carried out by commercial code WAMIT,which is developed by MIT.Velocity potential on each element was solved,and hydrodynamic parameters in frequency domain were calculated.
3.3 Environment condition
In our research,the water depth of the location is 200 m.Since we concern the seakeeping of the barge due to wave effect,this simulation only considers the waves without wind and current.
The irregular wave spectrum is Pierson-Moskowitz(PM)spectrum,and the expression can be written as[17],

where,S(f)is spectral wave energy density distribution,Hsis significant wave height,f is wave frequency,fp=1/Tpis peak wave frequency,Tpis period of peak wave spectral density,and α=0.2.
To validate the numerical simulation,calculation and model test were carried out for one irregular wave condition,in which Hsis 5.4 m and Tpis 13.5 s for 180 deg,135 deg and 90 deg in direction,respectively.The time domain simulation was carried out by solving Eq.12 using a self-compiled program written by FORTRAN.
4 Model test
A series of model tests were carried out in the State Key Laboratory of Ocean Engineering(SKLOE)basin.The scaling factor is 1:50,and the water depth of model scale is 3.8 m.The barge is moored by 4 wire-springs(2 wiresprings attached at fore and aft locations, respectively)as shown in Fig.6,which is used to withstand wave drift force.

Fig.6 The arrangement of barge model in the basin

Fig.7 The irregular wave test in the beam sea condition
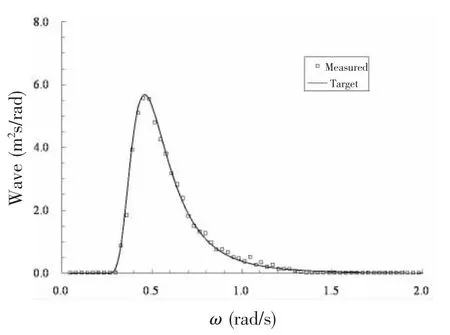
Fig.8 Comparison between measured and target wave spectrum
The tests included decay tests,white noise wave tests and irregular wave tests.Decay tests were performed in still water in roll and pitch mode to validate the moment of inertia.In white noise wave tests,the response amplitude operator(RAO)was obtained by means of spectral analysis for motion results.In the irregular wave tests,the sea states in three wave directions were generated by a PM spectrum with significant wave height of 5.4 m and peak period of 13.5 s.Fig.7 shows the irregular wave test in the beam sea condition.Wave probes of resistance type at specified locations provided measurements of generated wave elevation.For each irregular wave case,the maximum wave elevation above mean water surface was 0.97 to 1.03 times the target significant wave height.As shown in Fig.8,the spectra generated in the basin presented that significant wave height (Hs)and peak period (Tp)are within plus or minus 5%of the target values,which are listed in Tab.2.The effective duration for each irregular wave was over 3 hours in full scale(25.5 mins in model scale).
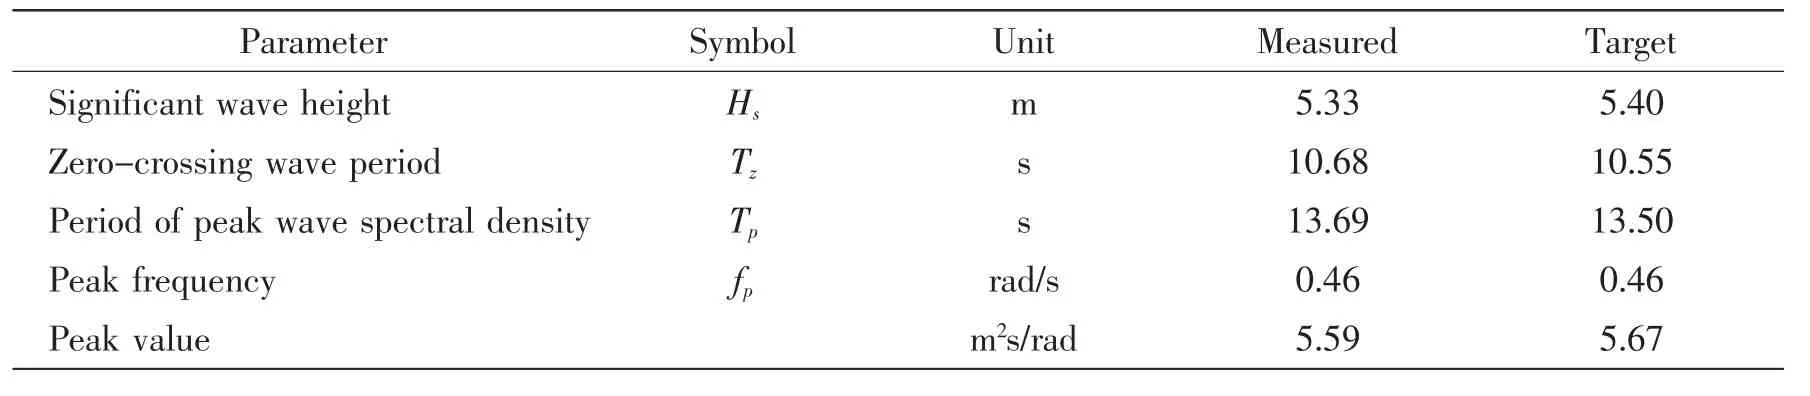
Tab.2 The comparison between measured and target wave spectrum parameters
5 Results and discussion
5.1 Frequency domain analysis results
5.1.1 Calculation VS.model test
In order to validate the numerical models and the first order boundary value problem solution in frequency domain,a comparison of RAOs between calculation and experiment is carried out first.Fig.9 shows 6-DOF motion RAOs in head sea and beam sea condition,and fairly good agreements are obtained for each motion mode except for some discrepancy at narrow band frequencies near the natural frequency for some mode.As shown in Fig.9(b)and(d),there is a little difference at around the frequency of 0.7 rad/s(the natural frequency of pitch)in the head sea,which is because that the barge motion is large and nonlinear at the natural frequency,and the linearization of RAOs underestimates the motion.As shown in Fig.9(c),the peak of roll RAO occurs at the frequency of 0.4 rad/s,and its magnitude continues to decrease with the additional damping increasing.The solid diamond points present the experimental result,which is less than the calculation value around natural frequency when no viscous damping was considered.When the linearized roll damping(D44)equals 1.0E9 N/(deg/s)2or critical damping(CD)equals 0.01,the calculation result is consistent with model test.
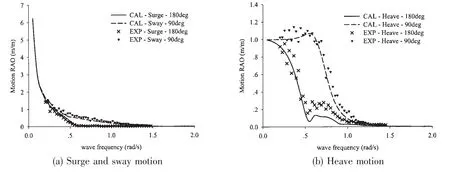
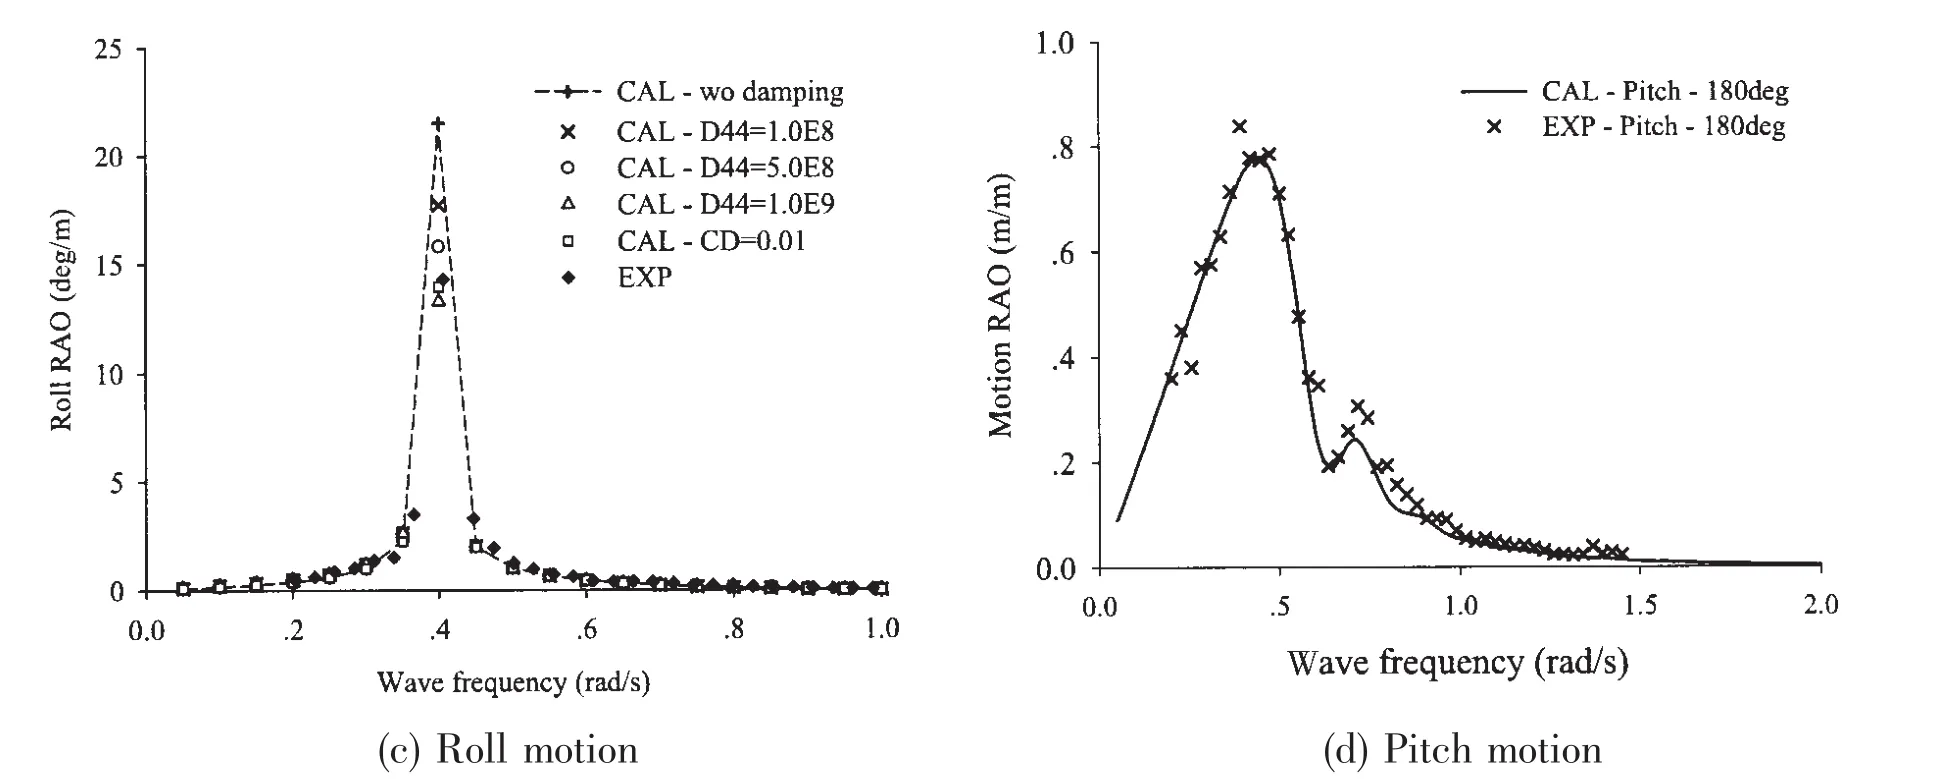
Fig.9 The comparison of RAOs between calculation and experiment
5.1.2 Comparisons between different barges
In order to compare hydrodynamic characteristics between T-shaped barge and conventional barge,1st and 2nd order wave forces of one conventional barge and two T-shaped barges are calculated in frequency domain.Fig.10 shows the comparison of 1st order wave exciting moment in the roll and pitch mode among three barges.The roll moment of Barge-3 is larger than that of Barge-1 and Barge-2 in beam sea at the natural frequency,as shown in Fig.10(a),but it is smaller than that of Barge-1 and Barge-2 when wave frequency is larger than 0.7 rad/s(wave period is smaller than 9s),which means Barge-3 has smaller roll moment response in majority sea conditions.As shown in Fig.10(b),the pitch moment of Barge-1 is nearly zero at beam sea because of the longitudinal symmetry,while Barge-3 has a larger moment due to the different breadths at bow and stern;the pitch moment of Barge-3 in head sea is larger than that in following sea.

Fig.10 The comparison of 1st order wave exciting moment among three barges
As shown in Fig.11(a),the longitudinal drift forces of Barge-1 in head sea and following sea are approximate,but the longitudinal drift forces of Barge-3 in following sea are nearly two times of that in head sea.Fig.11(b)shows that the three barges have similar transverse drift force in beam sea.The results of horizontal drift moment are shown in Fig.11(c)and it can be seen that T-shaped barge has a larger moment at 45deg wave heading.
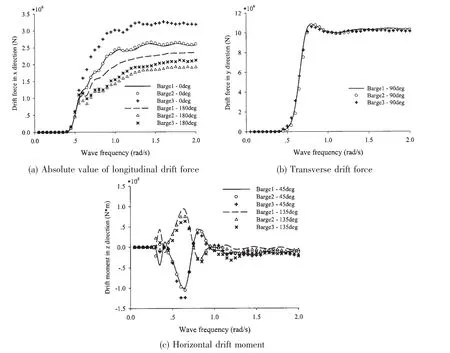
Fig.11 The comparison of 2nd order wave drift force and moment among three barges
5.2 Time domain analysis results
5.2.1 Calculation VS.model test
The time domain simulation can be carried out once the frequency domain results have been derived.We compare the free decay test results with calculation results in order to validate the numerical program and to verify the adjustment of COG and gyration radius in model test.Fig.12(a)and(b)shows roll and pitch free decay comparisons.The prediction results agree well with the model tests.We can find the natural period of roll motion is nearly 16 s and corresponding frequency is 0.393 rad/s,which is consistent with RAO result.Furthermore,the roll viscous damping is also proven indispensable to roll motion.For the pitch decay,the natural period is nearly 9.5 s and corresponding frequency is 0.67 rad/s,which agrees well with frequency domain analysis.

Fig.12 The comparison of decay test between calculation and experiment
The comparison of motion response in irregular wave condition is executed between time domain simulation and model test.The wave condition is given by a PM spectrum with significant wave height of 5.4 m,peak period of 13.5 sec,and the direction includes 180,135 and 90deg.The wave frequency motions(heave,roll and pitch)are concerned in the transportation condition.Tab.3 lists the comparison of all statistic results between the model test and analysis in three wave directions.Most of the calculation results are in agreement with the model test except the roll motion in beam sea which is 20%higher than experimental result.The reason may be that the viscous damping is nonlinear and linearized damping is under-predicted for large amplitude roll motion.Fig.13 shows the comparisons of time series in head sea and beam sea.The times series obtained by numerical simulation agree quite well with experimental results,which also demonstrates the reliability of numerical tool.
5.2.2 Comparisons between different barges
The time domain simulations are also carried out for three different barges in the irregular wave.The wave condition is also given by a PM spectrum with significant wave height of 5.4 m and peak period of 13.5 sec,and the direction includes 180,135,90,45 and 0deg.The maximum values of motion responses are shown in Fig.14.Barge-3 has the smallest heave motion in all 5 directions,and Barge-2 has the smallest roll motion in all 5 directions.For the pitch motion,the results of Barge-1 is nearly symmetrical for head sea and following sea,while the results of Barge-3 is not and the largest response occurs at 135deg wave heading.

Tab.3 Comparison of statistic results between calculation and model test

Fig.14 Comparison of motion response maximum value among three barges
6 Concluding remarks
Floatover is a new method for integrated topside installation of offshore platforms,and it has become more and more popular in recent years.The T-shaped barge concept is introduced in topside installation to both alleviate the constraints from jacket slot size and satisfy the larger lifting capacity and better transverse stability requirement.
In this paper,hydrodynamic performance of T-shaped barge is investigated in frequency and time domain.The frequency domain analysis was executed with 3D potential flow code WAMIT,and motion RAOs and other hydrodynamic parameters are obtained.The time domain analysis was performed using FORTRAN code.
Furthermore,corresponding model tests are also carried out in the State Key Laboratory of Ocean Engineering(SKLOE)basin.Through comparison,we can see that RAOs from experiment agree quite well with numerical results,and that the effect of viscous roll damping is significant for roll motion.The statistic results and times series in irregular wave test are also consistent with time domain simulation results obtained by self-compiled program.
Finally,the comparisons of hydrodynamic performances among two T-shaped barges and one conventional barge are carried out.1st and 2nd order wave forces of these three barges are calculated in frequency domain.The results show that T-shaped barge(Barge-3)has smaller roll moment response in majority sea conditions;T-shaped barge has larger pitch moment and longitudinal drift force in head sea than those in following sea for its asymmetry.The motion responses in irregular wave show that T-shaped barge has better performance in waves.
Acknowledgement
This work is supported by The Lloyd’s Register Educational Trust(The LRET)through the joint centre involving University College London,Shanghai Jiao Tong University and Harbin Engineering University,to which the authors are most grateful.This work is also supported by the Youth Innovation Fund of State Key Laboratory of Ocean Engineering(No.GKZD010059-21).
[1]O’Neil L A,Fakas E.History,trends and evolution of float-over deck installation in open waters[C]//Proceedings of SPE2000 Conference on Society of Petroleum Engineers.Dallas,TX,USA,2000.
[2]Khaled S,Suresh P K,Eliseo C.Deck installation by floatover method in the Arabian Gulf[C]//Offshore Technology Conference,OTC11026.Houston,Texas,1999.
[3]Hartell W D,Beattie S M.Integrated,float-over deck design considerations[C]//Offshore Technology Conference,OTC8119.Houston,Texas,1996.
[4]Tribout C,Emery D,Weber P,Kaper R.Float-overs offshore west Africa[C]//Offshore Technology Conference,OTC 19073.Houston,Texas,2007.
[5]Seij M,Groot H.State of the art in float-overs[C]//Proceedings of 2007 Offshore Technology Conference.Houston,Texas,USA,2007.
[6]Wang A M,Jiang X Z,Yu C S,et al.Latest progress in floatover technologies for offshore installations and decommissioning[C]//Proceedings of the 20th International Offshore and Polar Engineering Conference,June 20-25,2010.Beijing,China,2010:9-20.
[7]Lee C H,Newman J N.Computation of wave effects using the panel method[M].Numerical Models in Fluid-Structure Interaction,WIT Press,Southhampton,2004.
[8]Xu Xin,Yang Jianmin,Lu Haining.Experimental and numerical analysis for floatover installation on jacket[J].Journal of Shanghai Jiaotong University,2011,45:439-445.
[9]Xu Xin,Li Xin,Lu Haining,Xiao Longfei,Yang Jianmin.An experimental and numerical study on motions of three adjacent barges in floatover installation[C]//Proceedings of the 22nd International Offshore and Polar Engineering Conference,June,2012.Rhodes,Greece,2012.
[10]Xu Xin,Yang Jianmin,Li Xin,Xiao Longfei.A study of floatover installation onto jacket with two barges[C]//17th Annual Offshore Symposium of SNAME Texas Section,2012.Houston,USA,2012.
[11]Pinkster J A.Low frequency second order wave exciting forces on floating structures[M].NSMB Publication,1980(650).
[12]Maruo H.The drift of a body floating on waves[J].Journal of Ship Research,1960,4(3):1-10.
[13]Newman J N.The drift force and moment on ships in waves[J].Journal of Ship Research,1967,11(1):51-60.
[14]Cummins.The impulse response function and ship motions[J].Schiffstechnik,1962:101-109.
[15]Xu Xin,Li Xin,Yang Jianmin,Lu Haining.An experimental and numerical study on seakeeping of T-shaped barge in topside transportation[C]//Proceedings of the 23rd International Offshore and Polar Engineering Conference,June,2012.Alaska,USA,2012.
[16]William H P,Saul A T,Vetterling W T.Numerical recipes in Fortran 77:The art of scientific computing[M].1986:704-708.
[17]DNV-RP-C205(2005).Environmental conditions and environmental loads[R].2007.