Concentration of trace elements and their sources in a snow pit from Yuzhu Peak, north-east Qinghai-Tibetan Plateau
2011-12-09 07:12:30YueFangLiXiaoLanShiNingLianWangJianChenPuTanDongYao
YueFang Li , XiaoLan Shi, NingLian Wang, JianChen Pu, TanDong Yao
State Key Laboratory of Cryospheric Science, Cold and Arid Regions Environmental and Engineering Research Institute, Chinese Academy of Sciences, Lanzhou 730000, China
Concentration of trace elements and their sources in a snow pit from Yuzhu Peak, north-east Qinghai-Tibetan Plateau
YueFang Li*, XiaoLan Shi, NingLian Wang, JianChen Pu, TanDong Yao
State Key Laboratory of Cryospheric Science, Cold and Arid Regions Environmental and Engineering Research Institute, Chinese Academy of Sciences, Lanzhou 730000, China
In order to understand the potential influence of pollution from human activity on the natural cycle of trace elements in the atmosphere over the eastern Kunlun mountains, north-eastern part of the Qinghai-Tibetan Plateau, concentrations of Al, Fe, Ba, Cd,Co, Cr, Cu, Li, Ni, Zn, Pb, Sb, Sr, U and V in a 75 cm-deep snow pit recovered from 5,800 m a.s.l. of the Yuzhu Peak Glacier on October 25, 2009, were determined by a sector field inductively coupled plasma mass spectrometry. The results indicate that concentrations of the measured trace elements vary by orders of magnitude from one element to another ranging from the minimum value 1.2 pg/g (U) to the maximum value 293 ng/g (Fe); the value of Max/Min ranges from 7 pg/g (Sd) to 358 pg/g (Li). EFc values of measured trace elements show that there are other important sources except dust for Cd, Sb, Zn, Pb and Cu. Comparison of the concentrations of the measured trace elements with those in other areas in the Tibetan Plateau indicates that trace element concentrations for Yuzhu Peak are lower than those in east Tianshan and Muztagh Ata (Pamirs). Concentrations of some trace elements are also lower than those in East Rongbuk Glacier. However, concentrations of all measured trace elements are extensively higher than those in Greenland and the Antarctic.
trace elements; dust; anthropogenic pollution; Yuzhu Peak Glacier
1. Introduction
Studies of trace elements in snow and ice from Greenland indicate that atmospheric pollution in regional northern hemisphere are the result from mining and smelting of nonferrous metals which took place as early as Greek,Roman, Medieval and Renaissance times (Honget al., 1994,1996). Such pollution has been increasing largely since the Industrial Revolution (Boutronet al., 1995; Candeloneet al.,1995). The increase of Pb in snow and ice in Greenland and other areas of the Arctic are mainly from the use of alkyl-leaded petrol in American and European countries since the 1930s, reaching the highest level in the 1960s, followed by a decreasing trend of concentrations over the next 2–3 decades due to the limitation of alkyl-leaded petrol and emission of the associated pollutants in these countries(Boutronet al., 1991). The increase of Sb in Devon Island,Arctic Canada indicate that the atmospheric Sb signal preserved in the ice core reflects contamination from industrialization, the economic boom after World War Two, and that anthropogenic emissions have dominated atmospheric Sb deposition throughout the entire period (Krachleret al., 2005).
Recently, increasing number of studies have focused on trace elements in snow and ice from mountain glaciers of the Qinghai-Tibetan Plateau because rapid economic growth in some areas near the Tibetan Plateau may result in atmospheric pollution of the plateau. Results on trace elements in snow and ice from a few glaciers on the plateau indicate that some elements were from anthropogenic emissions (Liet al., 2006a, b, c, 2007a, b, 2008; Duanet al., 2007; Leeet al., 2008; Zhanget al., 2008; Honget al.,2009; Kaspariet al., 2009). However, this data is not suffi-cient enough for us to better understand and estimate the pollution of trace elements from human activity on the atmosphere of the plateau.
Yuzhu Peak is the second highest peak of the eastern Kunlun Mountains. This peak is 160 km south of Golmud,Qinghai province, western China, and 10 km east of the Kunlun Mountain Pass. The altitude of Yuzhu Glacier is 6,178.6 m a.s.l., with a total area of 6.75 km2and a length of 5.7 km (Pu, 1994).
However, there have been no investigations on the occurrence of trace elements in snow and ice from Yuzhu Glacier. In this paper, we present the first data set of some trace elements in a snow pit from Yuzhu Peak Glacier, collected on October 25, 2009. The objective of this study is to obtain information of natural and anthropogenic influences on regional atmospheric composition recorded by trace elements preserved in the glacier.
2. Experiment
2.1. Sampling method
On October 25, 2009, a continuous series of 15 snow samples from a 75 cm deep snow pit were collected from an accumulation zone at a site (35°39′N, 94°14′E, and 5,800 m a.s.l.) of the Yuzhu Peak Glacier (Figure 1). The surface snow layer was the latest snowfall event within a few days before sampling.
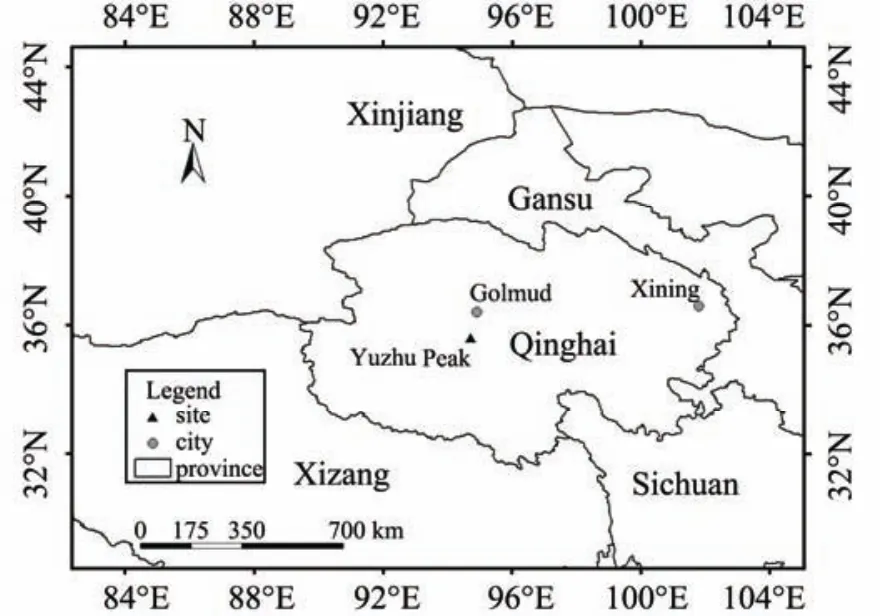
Figure 1 Location map of Yuzhu Glacier in the Qinghai-Tibetan Plateau
Great precautions were taken in the field to prevent the possibility of snow contamination. Firstly, the operators wore full clean garments and polyethylene gloves with acid-cleaned plastic shovels. Secondly, they were upwind of the snow pit and hand-dug the snow pit, using polyethylene plastic shovels. The snow pit samples were collected from bottom to top with pre-cleaned polyethylene sampling tubes which was vertically pushed into the wall of the snow pit to collect the snow samples. After collecting a sample, the polyethylene gloves were replaced for the next sample. Finally, the collected snow samples in the tube were transferred to pre-cleaned LDPE sample bottles which were wrapped with double plastic bags. Before collecting the next snow pit sample, the sampling tube was cleaned in the same snow layers by pushing it into the wall several times. The collected snow pit samples were kept frozen in the freezer at the State Key Laboratory of Cryospheric Science until analysis.
2.2. Analytical procedures
The pretreatment of all snow pit samples was carried out in a class 100 clean workbench in a class 1000 clean room.After melting at room temperature, all samples were acidified with purified nitric acid from a PTFE sub-boiling distillation apparatus (BSB-939-IR, Berghof, Germany) to reach a 1% (v/v) concentration of nitric acid, and then stored in the freezer.
The determination of trace elements was performed in a class 1000 clean room in the State Key Laboratory of Cryospheric Science, Cold and Arid Regions Environmental and Engineering Research Institute (CAREERI), Chinese Academy of Sciences (CAS). The concentration of all trace elements was determined by an inductively coupled plasma sector field mass spectrometry (ICP-SFMS) (Element, Finnigan MAT). The analyzing method was improved by adding indium into all solutions as an internal-standard to compensate for sensitivity drift and matrix effect (Liet al., 2007c,2008).
Data quality was controlled by analyzing a standard reference material SLRS-4 (Riverine Reference Material for Trace Metals, National Research Council Ottawa, Canada).Good agreement between our data and the certified values was observed for most elements (Table 1).
Detection limits for trace elements in Table 1 were determined by measuring a 1% HNO3solution ten times, and defined as three times the standard deviation of the ten measurements. The precision was expressed by measuring a snow pit sample four times, and defined as relatively standard deviation, which are generally lower than 10%.
In order to find any possible change of trace element concentrations associated with acidification time, the concentrations were first determined after a week, then stored frozen and determined again after five months. Figure 2 shows the results of both determinations for Zn, Pb, Al and Fe after one week and five months, respectively. It can be found that good agreements exist between determinations for Zn and Pb, but disagreement for Al and Fe, of which the average concentrations after five months were 3.1 and 3.9 times higher than after a week, respectively. This can be explained by the fact that more Al and Fe were dissolved into water over time, while Zn was fully dissolved into water after a week, and Pb was dissolved into water differently(Edwards and Sedwick, 2001). Ratios of the second to the first determination for other trace elements range from 1 to 1.5. The data determined after five months are discussed in this paper.
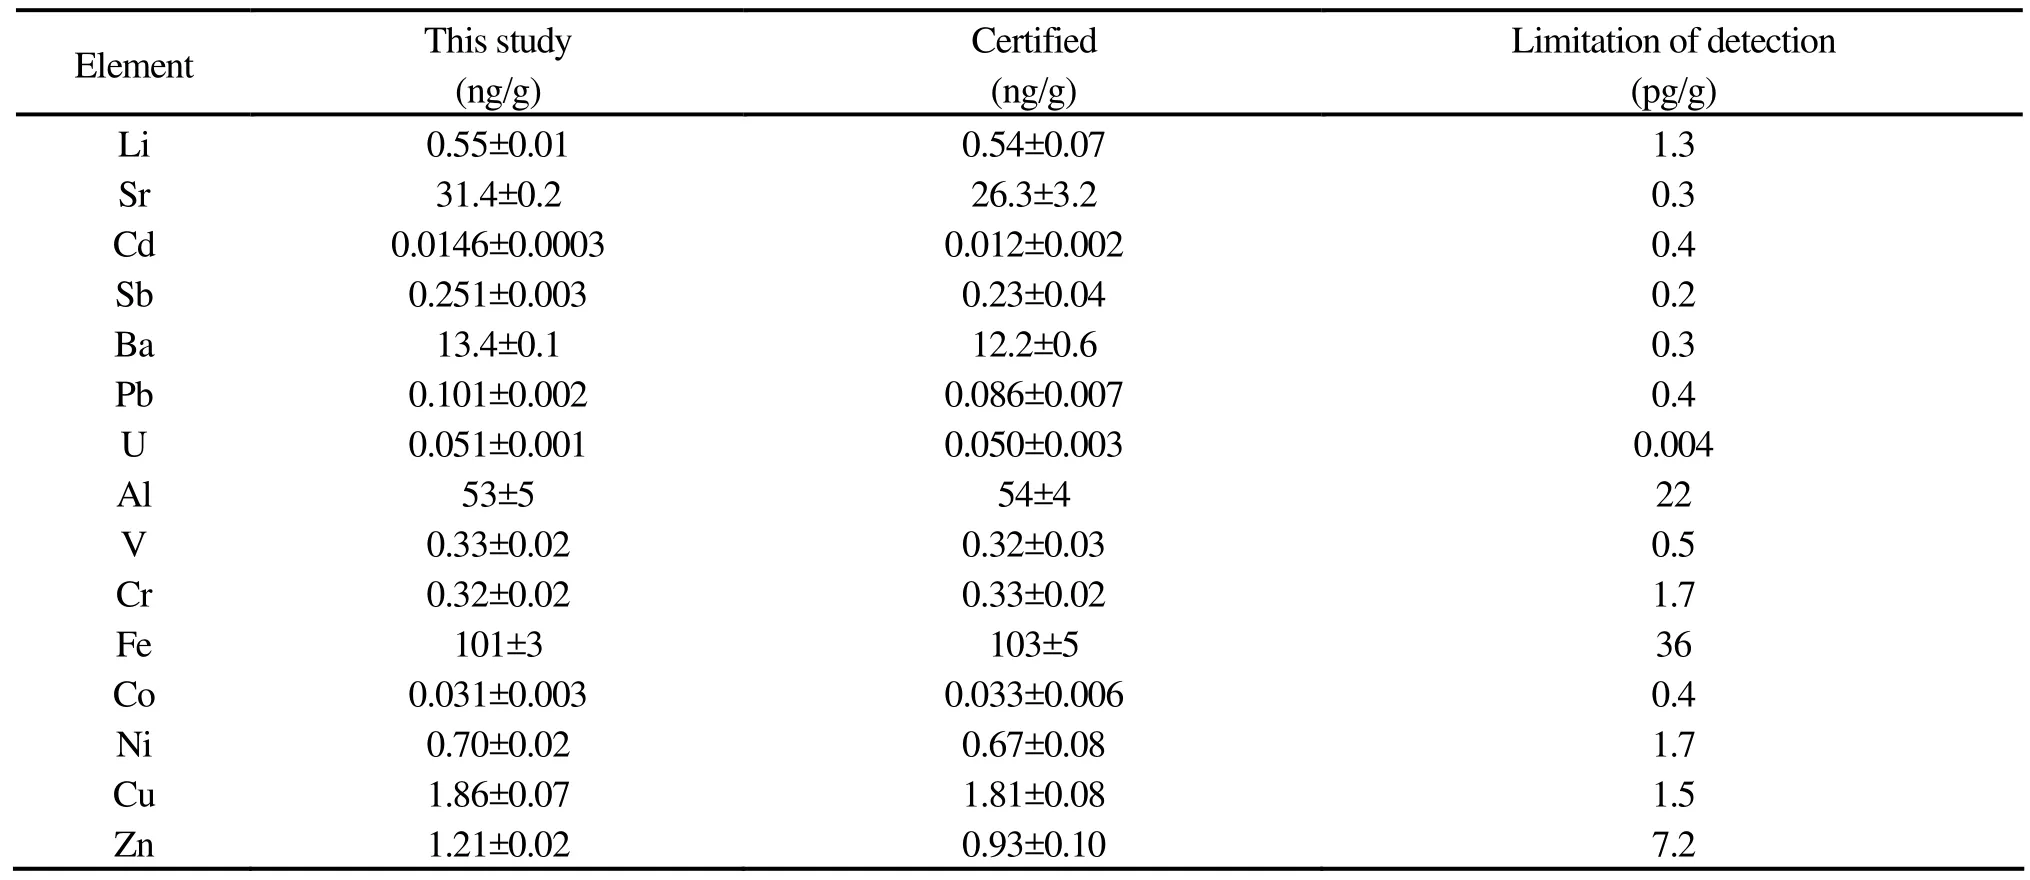
Table 1 Comparison of measured trace element concentrations with certificated values of SLRS-4 and limitation of detection
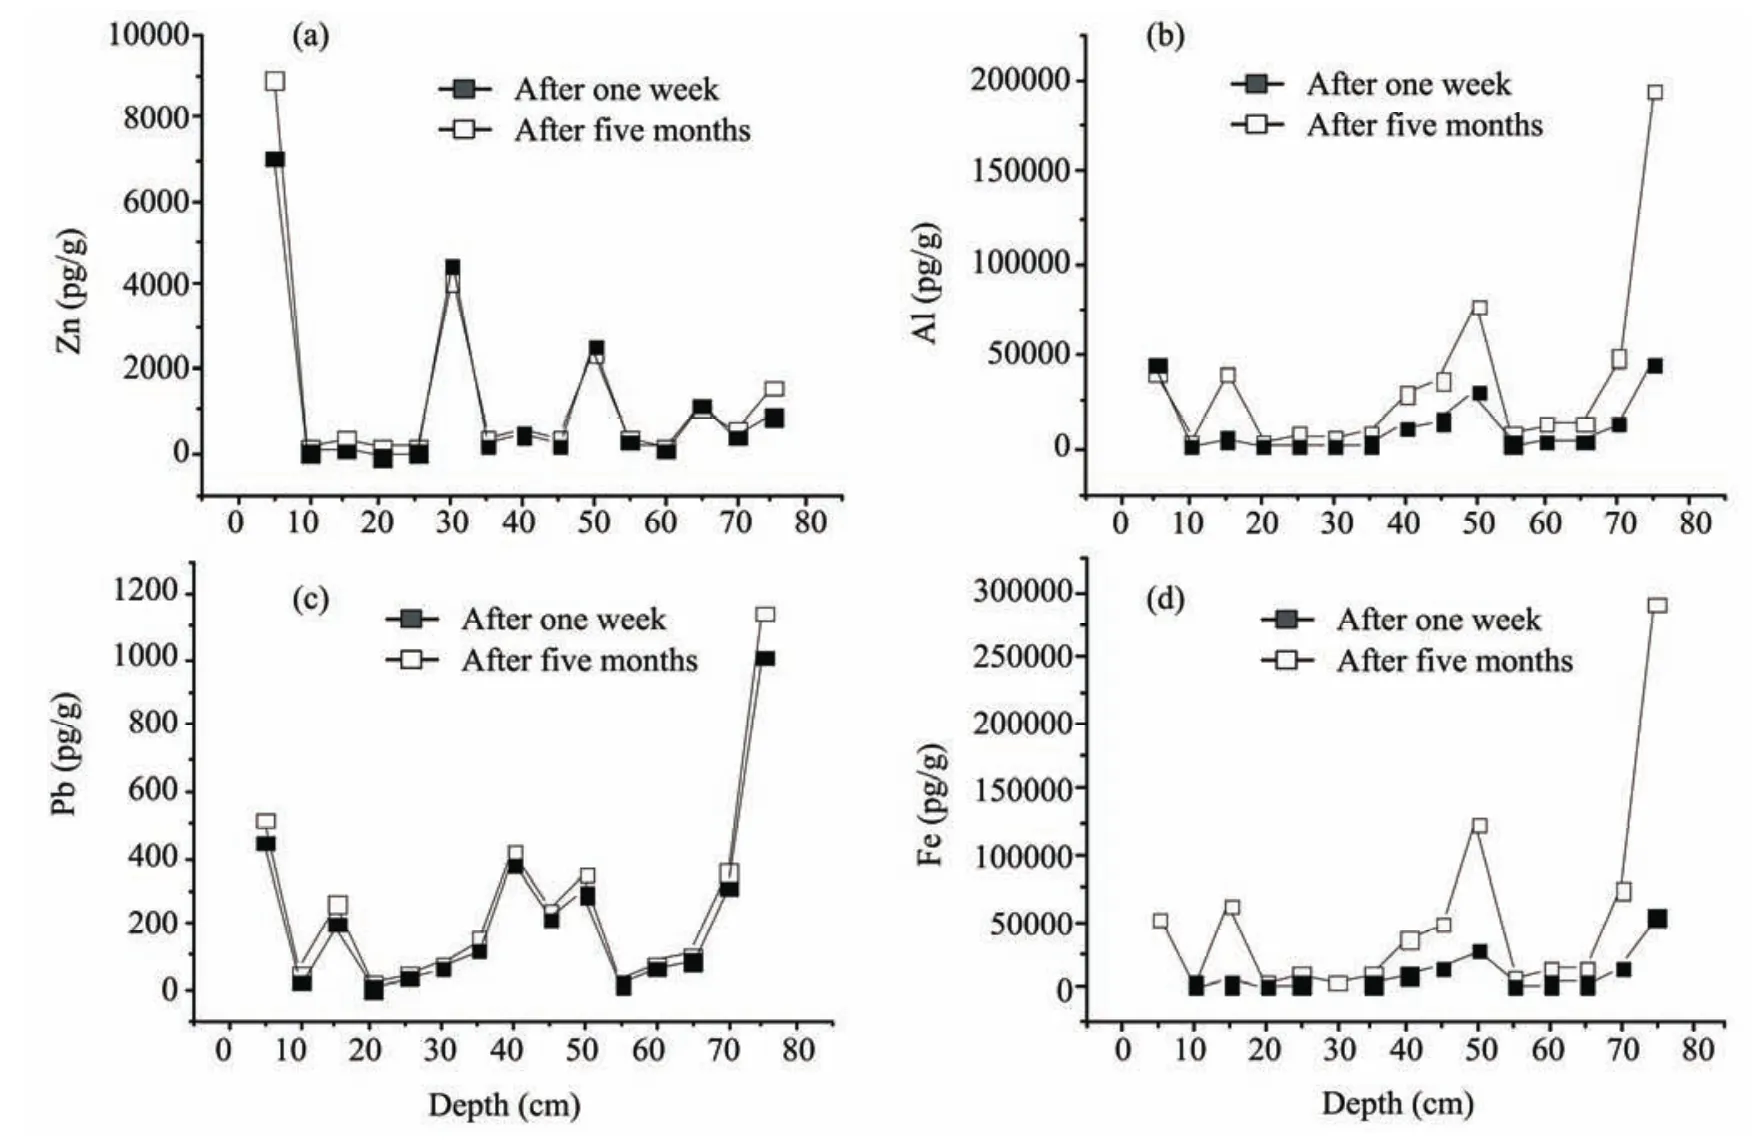
Figure 2 Comparison of some measured trace element concentrations in snow samples from Yuzhu Peak Glacier between two determinations spanning five months
3. Results and discussion
3.1. Characteristics of the data
The statistical data of the 15 trace elements, in a snow pit from Yuzhu Glacier, are listed in Table 2, of which metals such as Cd, Ni and Cu cannot be detected in just a few samples because the concentrations are below detection limits.
It can be seen that there are large variations of concentrations from one element to another. The highest concentrations are at several hundred ng/g for Al and Fe, while the lowest concentrations are at pg/g levels for Li, Cr, Sb, Co, Cd and U.
The ratio of maximum to minimum concentration changes from 7 pg/g (Sb) to 358 pg/g (Li). The minimum concentration of trace elements in the snow pit is actually representative of the background level of trace elements in the regional atmosphere corresponding to the time when the snow was deposited. It can be seen from Table 2 that Al and Fe are two dominant elements, with all other trace elements in lower concentrations. Of the trace element concentrations, the highest one is from Zn, which minimum value (113 pg/g) is about 2–3 times higher than that of Sr,Ni or Ba (30–50 pg/g), and nearly ten times higher than that of Cu, V or Pb (10 pg/g).
The maximum concentrations of Zn, Ba, Li and Pb are in the range of 1,000–5,000 pg/g; those of Ni, Cr, Cu, V and Co are at the same level ranging from 250–600 pg/g; those of Cd, U and Sb are below 100 pg/g.
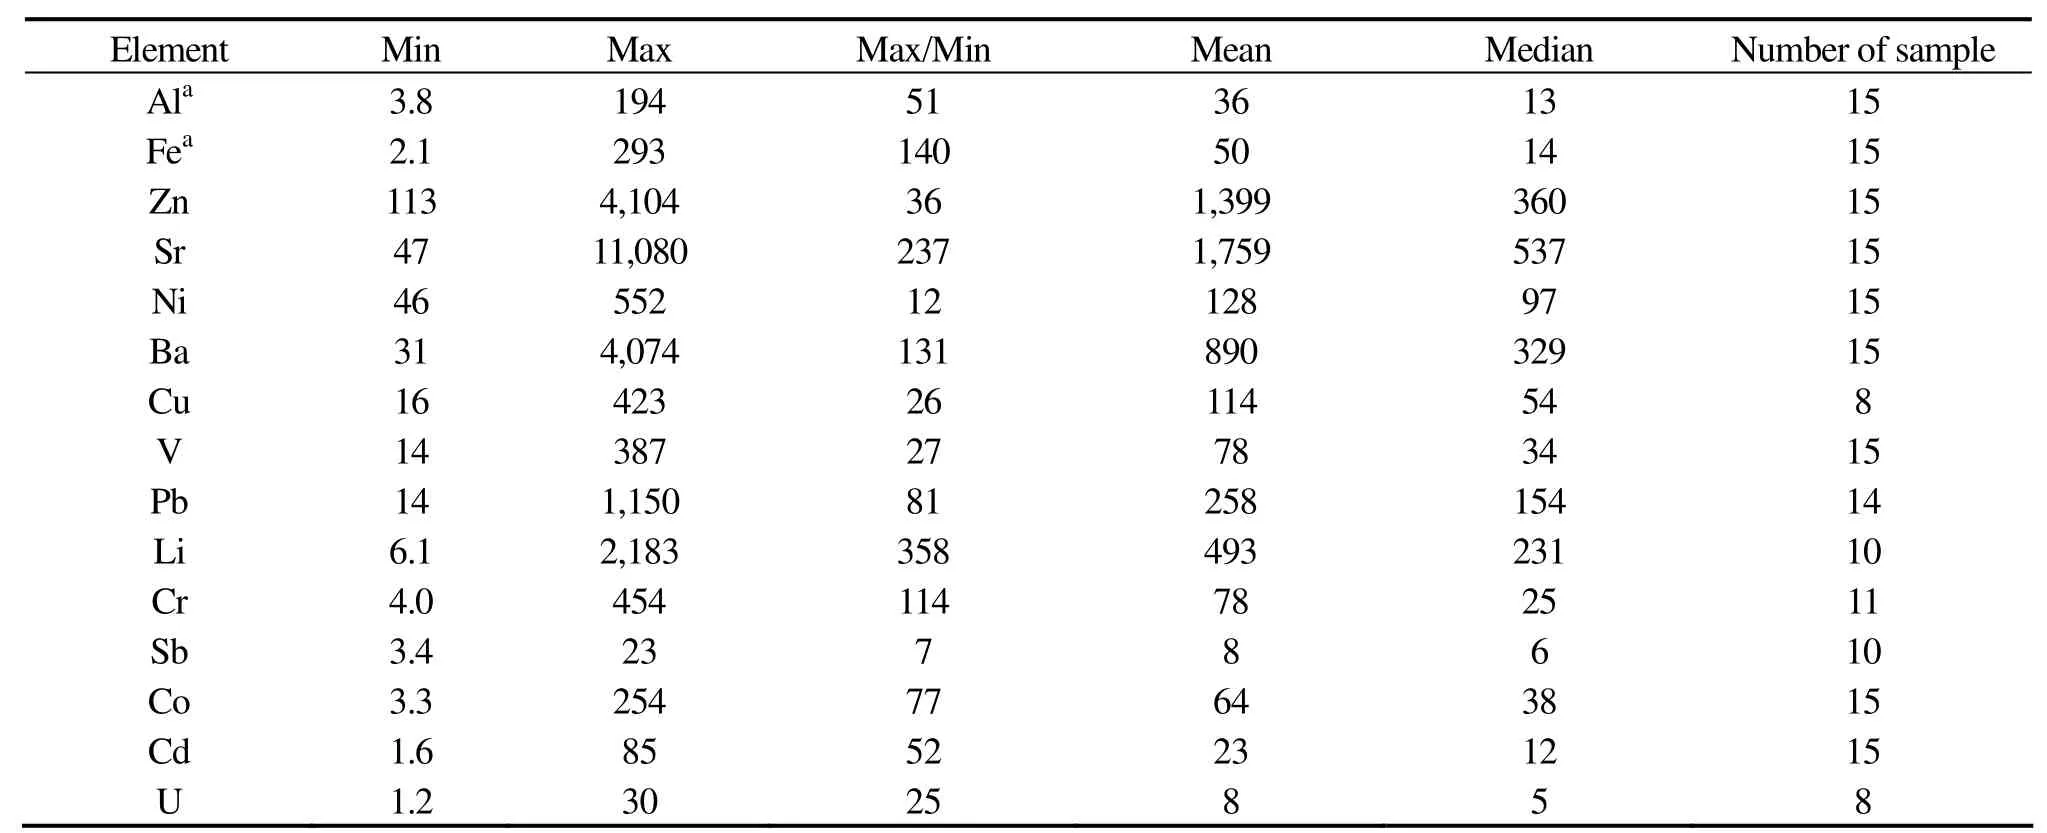
Table 2 Statistical data of trace elements of a snow pit from Yuzhu Peak Glacier (pg/g)
3.2. Changes of trace element concentrations with depth
Concentrations of 15 trace elements associated with snow pit depth are shown in Figure 3. The concentrations of the measured elements display a consistent pattern except for Zn. The variation of trace element concentrations are the same as Al and Fe which are the reference elements of rock and soil dust. This indicates that transportation and deposition of the measured trace elements to the investigated region are associated with dust. Variation of Zn different from other trace elements possibly indicates that it came from different sources.
There are larger variations of the measured trace element concentrations associated with depth or different deposition time. The minimum concentration of Sb is at the same level reported by Honget al. (2009) for the East Rongbuk Glacier on Mt. Everest, but the maximum to minimum ratio for Sb is pronouncedly higher than reported for the eastern Rongbu Glacier. This is potentially related to a strong variability in air mass trajectories that impact upon the measured trace elements of Yuzhu Glacier.
It was reported that there is a positive correlation of oxygen isotopes with temperature in glaciers in the northern Qinghai-Tibetan Plateau. Higher values of oxygen isotopes correspond with higher temperatures and lower values correspond with lower temperatures (Zhanget al., 2003). In addition, variation of the measured trace element concentrations is similar to those of oxygen isotopes, which could account for the intensified transport of the measured trace elements to the study site at higher temperatures.
3.3. Crustal enrichment factors
In order to understand the possible sources of trace elements in the atmospheric of Yuzhu Glacier, crustal enrichment factors (EFc) is used to discuss the sources of the elements. EFc is defined as the concentration ratio of a given metal to that of Al normalized to the same concentration ratio characteristic of the upper continental crust (UCC). For example, the EFc for Zn is defined as the following:

Here, we use upper continental crust data by Wedepohl(1995) and Liet al. (2009) as the average composition of rock and soil dust for the studied region. However, because of the differences between elemental composition of local soil and reference crustal composition, it is generally considered that rock and soil dust is a dominant source if the value of EFc is between 0.1 and 10. Conversely, important contributions from other natural or anthropogenic sources is considered if the value is greater than 10 (Liet al., 2006a;Leeet al., 2008; Honget al., 2009; Kaspariet al., 2009).
Figure 4 illustrates the average value and standard deviation of crustal enrichment factors for the measured trace elements. The average EFc values for Cr, V, Ba, Fe, Co and U are below 10, which indicate that dust is the dominant source for these elements. The maximum EFc value is greater than 10 for Ni, Sr, Cr and U, which indicate that periodically, there are other natural or anthropogenic sources contributing to these elements. The average EFc value is between 20 and 350 for Zn, Pb, Cu, Cd and Sb, indicating that for these elements, sources other than rock and soil dust are more important.
In addition, ratios between elements possibly contain source information of trace elements. The ratio of Zn to Sr is between 0.20 and 23.1, with an average value of 2.9, but in upper continental crust it is 0.16; the ratio of Zn to Ba is between 0.18 and 52.6, with an average value of 5.28, but in upper continental crust it is 0.078. These higher ratios of Zn to Sr and Ba indicate that higher concentration of Zn in the snow pit samples of Yuzhu Glacier is related to other sources besides dust.
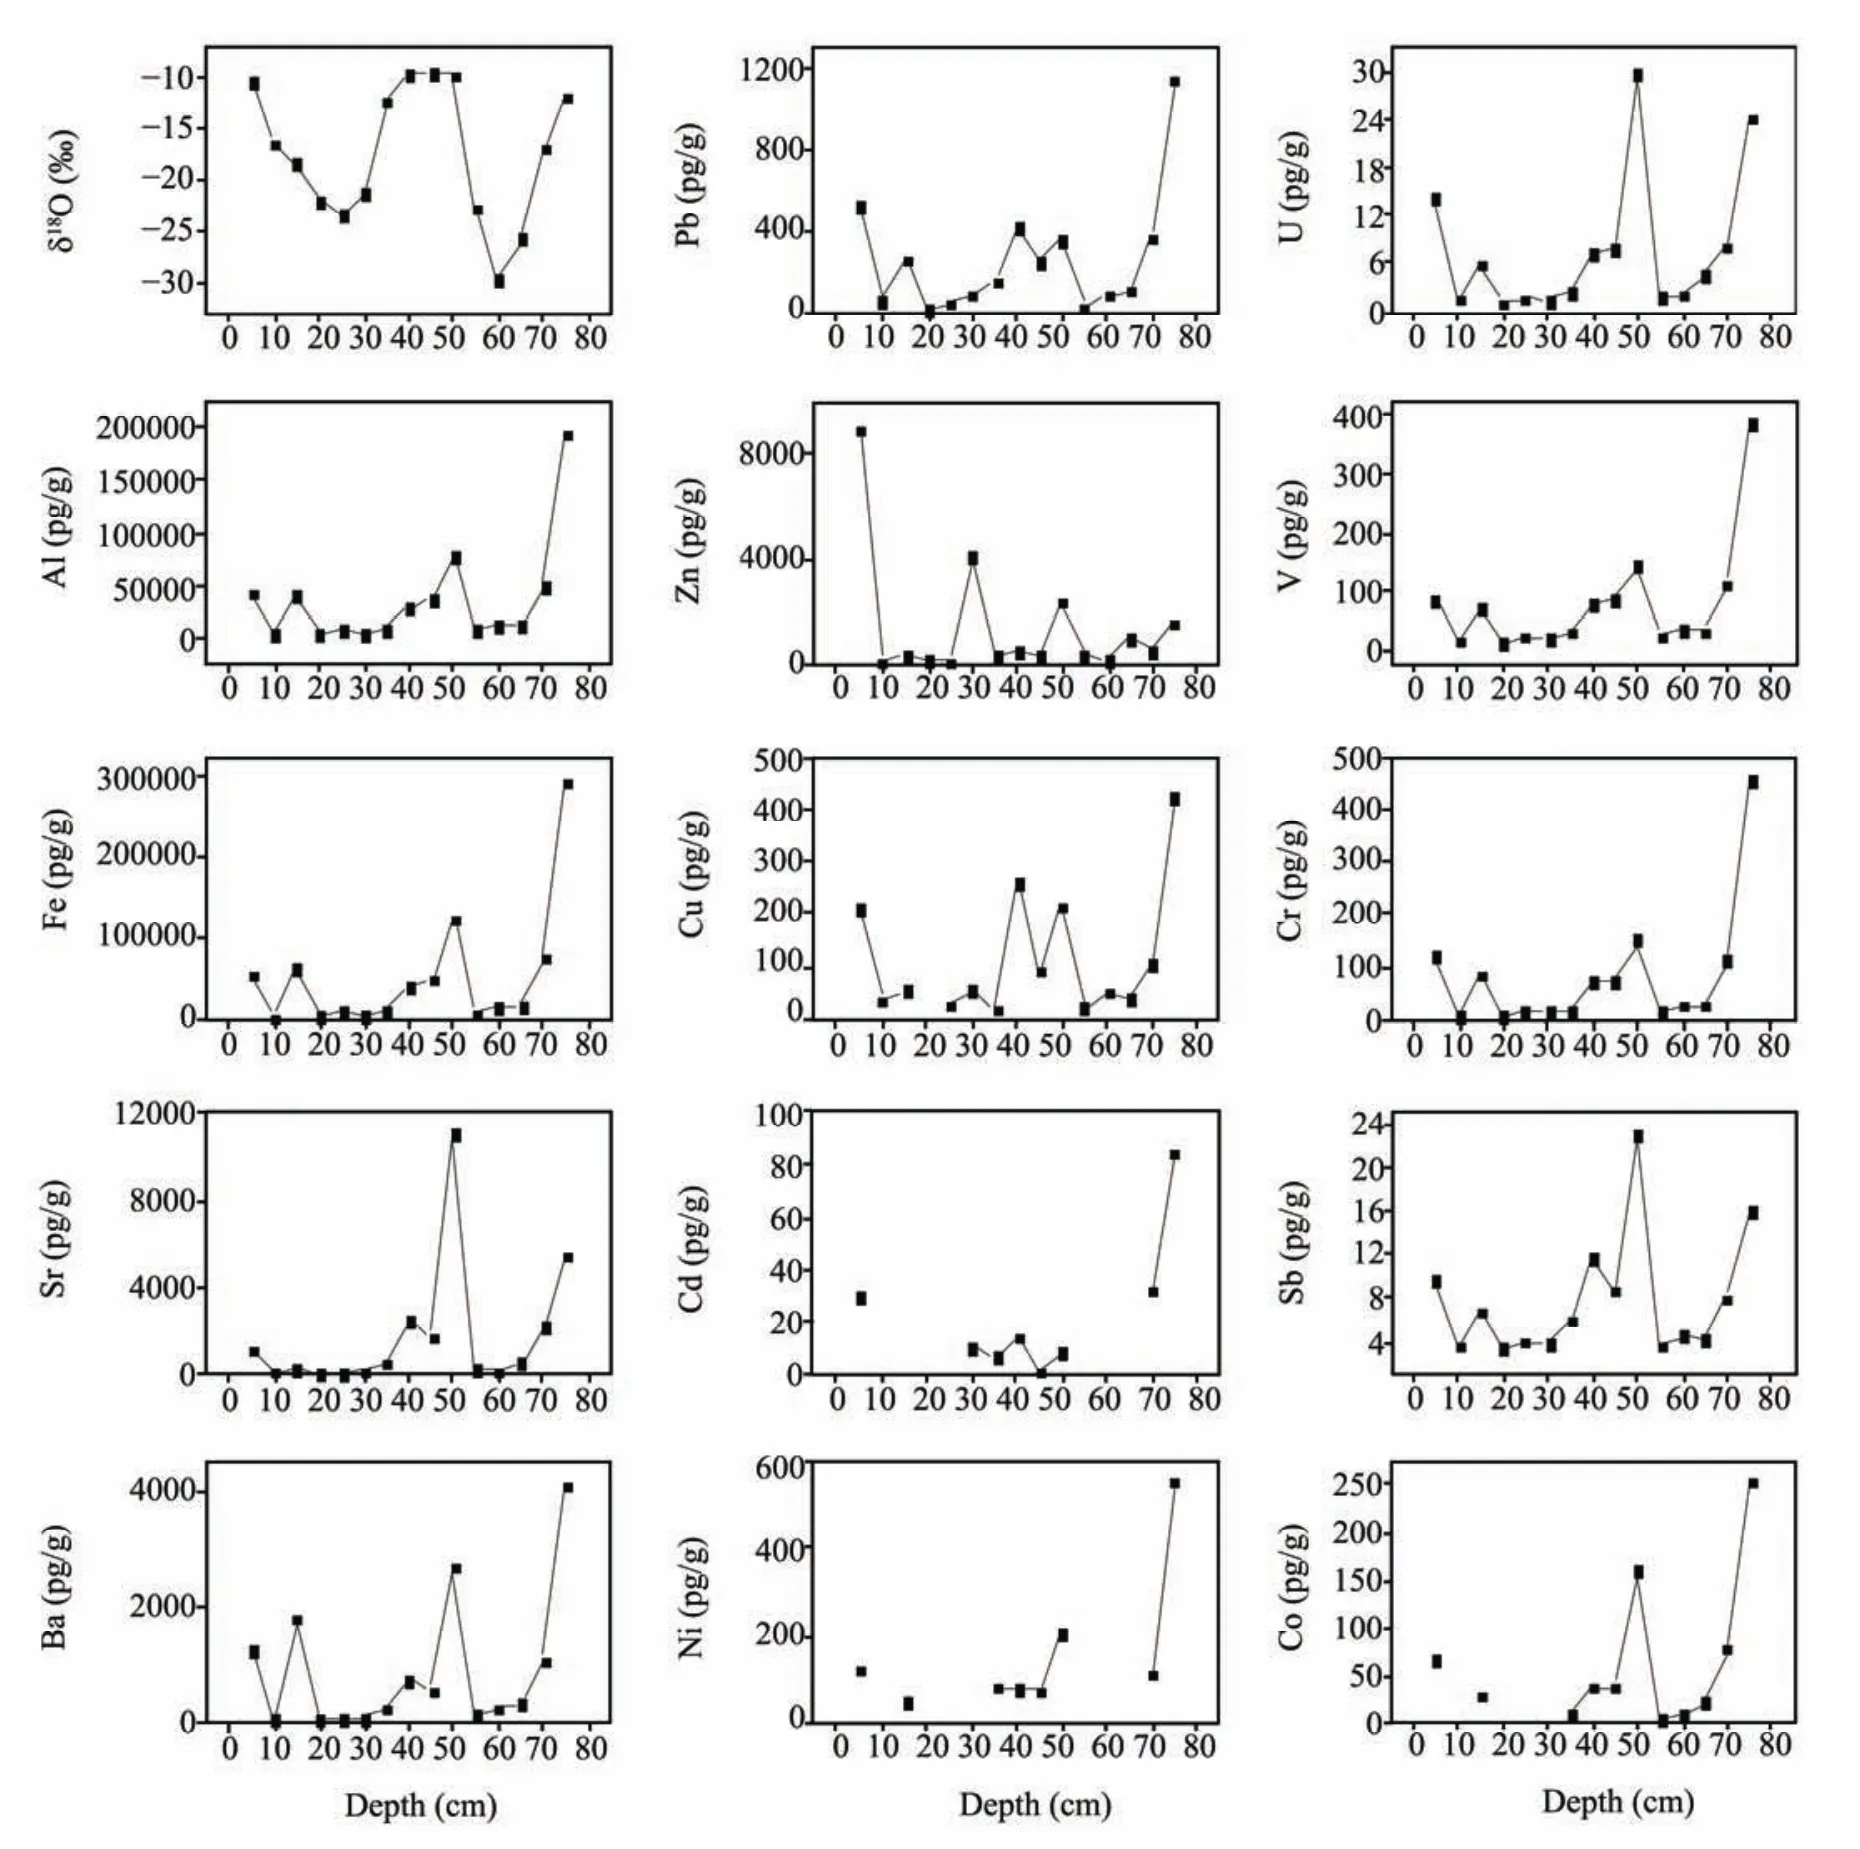
Figure 3 Depth profiles of measured trace element concentrations in a snow-pit from Yuzhu Peak Glacier
Regarding the atmospheric condition in the region of Yuzhu Glacier, anthropogenic sources are the most important sources for Zn, Pb, Cu, Cd and Sb. Other natural sources, such as sea-salt, volcanic activity, wild forest fires,continental and sea bioactivity could not account for the higher EFc values of these elements in the study site. Statistical data shows that world-wide contribution of Pb from sea-salt aerosol is only about 16%, and the contribution to other elements is below 10% (Nriagu, 1989). Moreover,Yuzhu Glacier lies inland, far from the ocean, so the contribution from sea-salt is less than average. Thus, bioactivity from the ocean cannot be the main source of trace elements.Yuzhu Glacier is located in an arid and semi-arid region; as a consequence, continental bioactivity cannot account for higher EFc values of these elements. There was no volcanic dust in the snow pit samples. During the whole time period of the snow pit, there was no forest fires happened. Therefore, the potential source for higher EFc values may be from anthropogenic activity.
Nriagu and Pacyna (1988) noted that the quantity of trace elements emitted from anthropogenic sources have already exceeded their natural sources. Statistical data shows that Asia is the largest area in the world to emit trace elements into the atmosphere (Pacyna and Pacyna, 2001). The main sources of these elements are fossil fuel combustion,and non-ferrous metal mining and smelting. Therefore, trace elements in the atmosphere of Yuzhu Glacier can only be accounted for by the aforementioned anthropogenic sources.
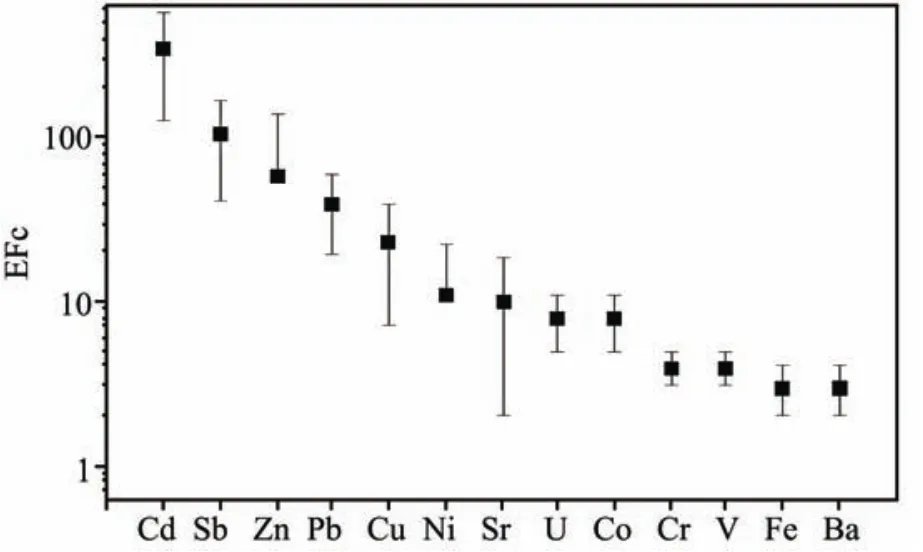
Figure 4 EFc values and standard deviation of trace elements in a snow pit from Yuzhu Peak Glacier
3.4. Comparison of trace element concentrations with other regions
In order to clearly understand the level of trace element concentrations in the Yuzhu Glacier snow pit, we compared these concentrations with other regions in central Asia,Greenland and the Antarctic (Table 3). The precondition of comparing these data is that the pretreatment of the samples is similar.
It can be found from Table 3 that the measured trace element concentrations of Yuzhu Glacier snow pit are lower than those in Glacier No.1 of the head water of Urumqi in TianShan and Muztagh Ata Glacier, but higher than those in East Rongbu Glacier of the Himalayas (Duanet al., 2007).For example, the concentrations of Pb, Ba, and Cu are 3.9 times, 12.2 times and 2.6 times respectively higher than those in East Rongbu Glacier. However, compared with data from East Rongbu Glacier reported by Leeet al. (2008), the concentrations of Al, Cr and V are lower in Yuzhu Glacier,while those of other elements are higher. For example, concentrations of Ni, Cu and Co are 12 times higher than those in East Rongbu Glacier, and the concentrations of Pb, Zn, Sr,Cd and Sb are 3.3, 2.9, 25, 12 and 8 times, respectively.Compared with related data from Fedchenko Glacier, Pamir(Aizenet al., 2009), the concentrations of Sr and Cd are 1.8 and 1.9 times higher, respectively, those of Al, Pb, Cr, V, U and Sb are lower, while those of Fe, Ba and Co are similar.Furthmore, it can be found that all concentrations of trace elements in Yuzhu Glacier are higher than in Greenland snow ice. For example, Al and Zn are 5 and 16.2 times respectively, higher than those in Greenland. The concentrations of U, Pb and Ba are 262.1, 64.5 and 371 times higher respectively than in the Antarctic.
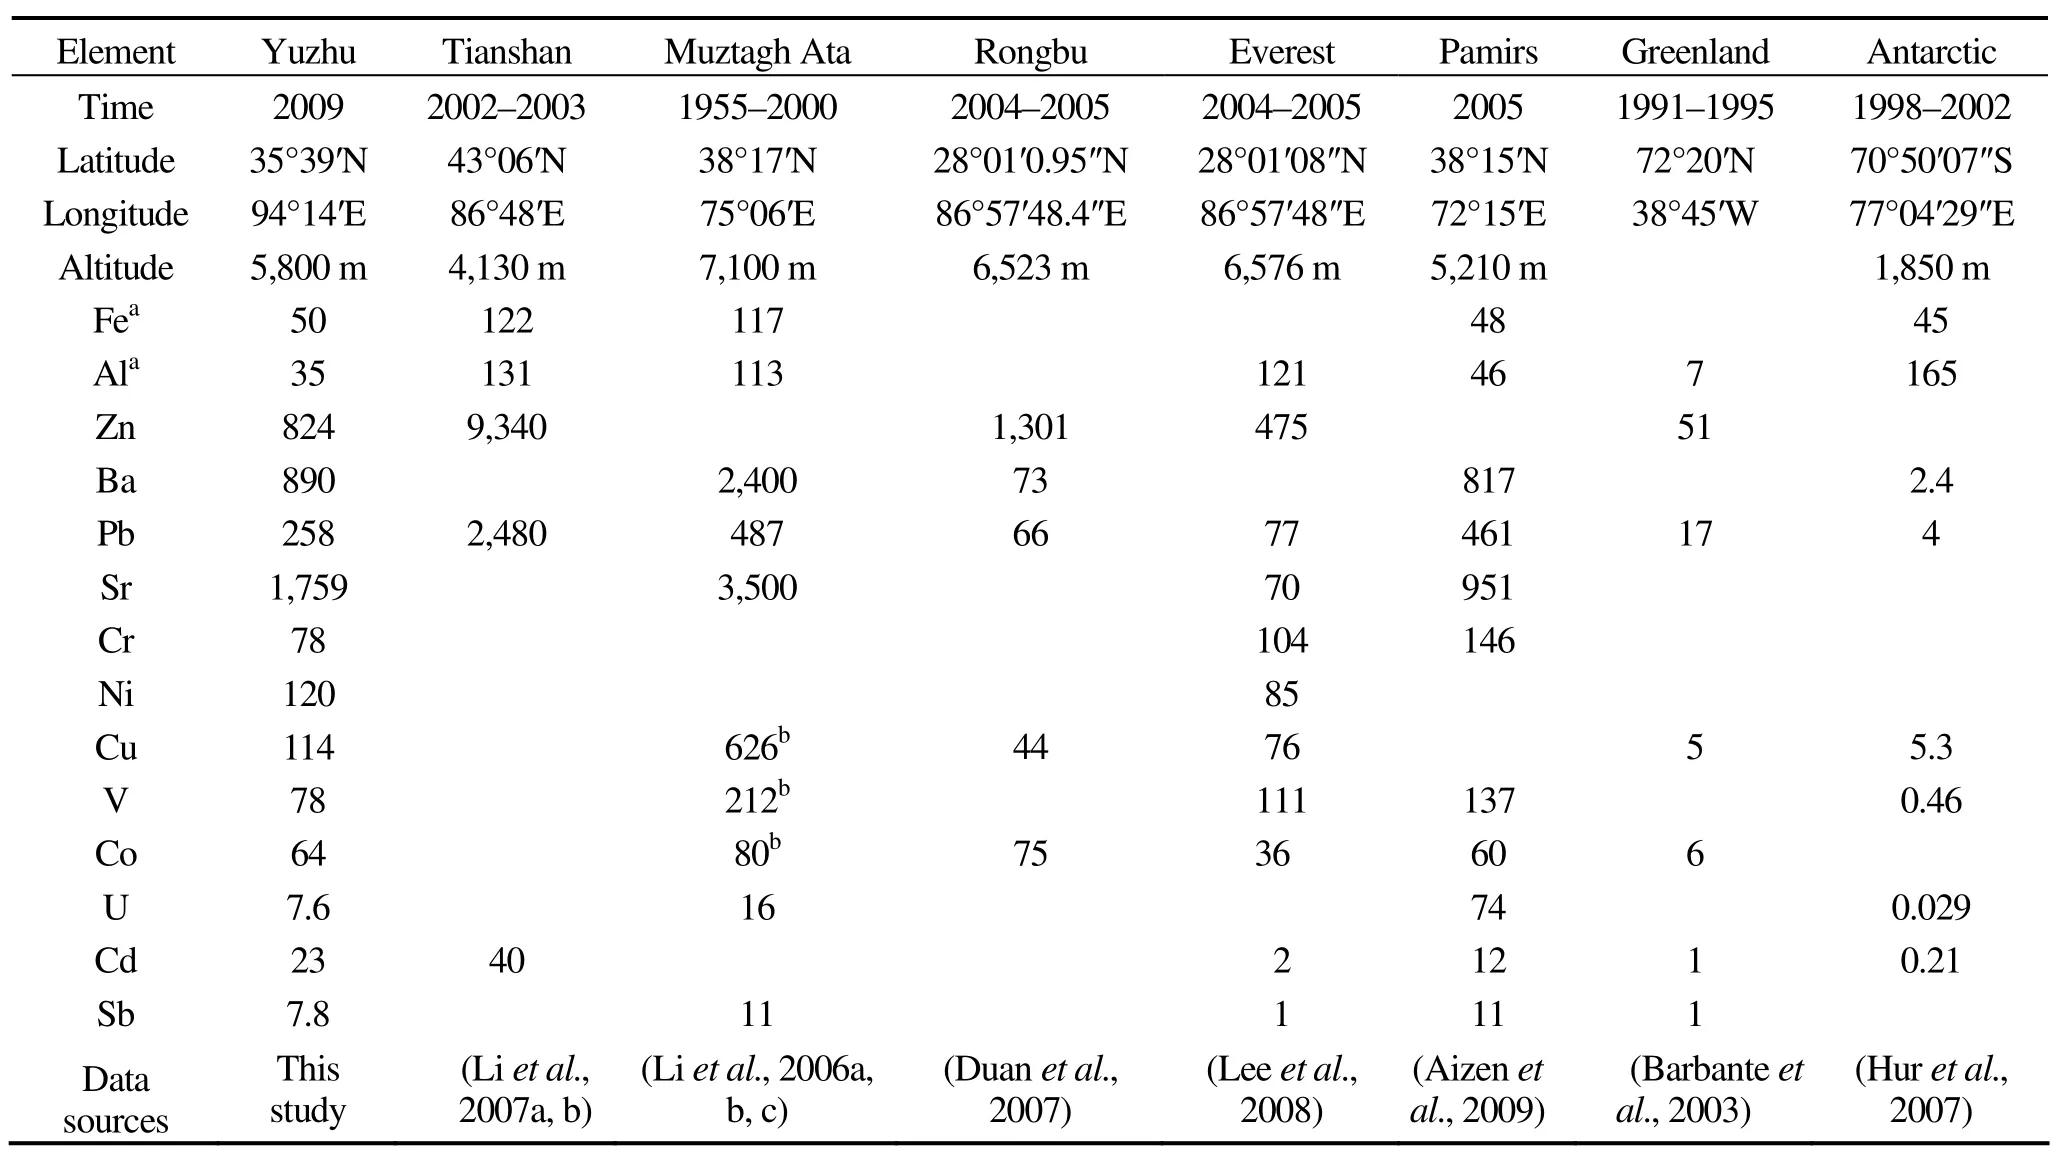
Table 3 Comparison of averaged trace element concentrations in snow pit samples from Yuzhu Peak Glacier and other sites
4. Conclusion
This study indicates that concentrations of the 15 trace elements vary by orders of magnitude from one element to another and the values of Max/Min range from 7 pg/g (Sb) to 358 pg/g (Li). EFc values of measured trace elements show that there are other important sources except dust for Cd, Sb,Zn, Pb and Cu. In addition, compared with other glaciers in Central Asia, the concentrations of some measured trace elements in the Yuzhu Glacier snow pit are lower, while concentrations of all the measured trace elements are higher than those in Greenland and the Antarctic. In summary, it may be attributed to potential pollution from anthropogenic activity for some trace elements in the local atmosphere over Yuzhu Glacier.
We would like to thank all field personnel for sampling during the 2009 field season for Yuzhu Peak Glacier. This study is supported by the National Natural Science Foundation of China (40771046, 40930526), and the National Major Scientific Research Programs (2010CB951404).
Aizen VB, Mayewski PA, Aizen EM, Joswiak DR, Surazakov AB, Kaspari S, Grigholm B, Krachler M, Handley M, Finaev A, 2009. Stable-isotope and trace element time series from Fedchenko glacier (Pamirs) snow/firn cores. Journal of Glaciology, 55(17): 275–291.
Barbante C, Boutron C, Morel C, Ferrari C, Jaffrezo JL, Cozzi G, Gaspari V,Cescon P, 2003. Seasonal variations of heavy metals in central Greenland snow deposited from 1991 to 1995. Journal of Environmental Monitoring, 5: 328–335.
Boutron CF, Candelone JP, Hong SM, 1995. Greenland snow and ice cores:unique archives of large-scale pollution of the troposphere of the Northern Hemisphere by lead and other heavy metals. The Science of the Total Environment, 160/161: 233–241.
Boutron CF, G?rlach U, Candelone JP, Bolshov MA, Delmas RJ, 1991.Decrease in anthropogenic lead, cadmium and zinc in Greenland snows since the late 1960s. Nature, 353: 153–156.
Candelone JP, Hong SM, Pellone C, Boutron CF, 1995. Post-industrial revolution changes in large-scale atmospheric pollution of the northern hemisphere by heavy metals as documented in central Greenland snow and ice. Journal of Geophysical Research, 100: 16605–16616.
Duan JP, Ren JW, Qin X, Li YF, 2007. Heavy metals concentrations and seasonal variations in snow of Mount Qomolangma region. Acta Geographica Sinica, 62(1): 22–29.
Edwards R, Sedwick P, 2001. Iron in East Antarctic snow: Implications for atmospheric iron deposition and algal production in Antarctic waters.Geophys Res. Lett., 28(20): 3907–3910.
Hong SM, Candelone JP, Patterson CC, Boutron CF, 1994. Greenland ice evidence of hemispheric lead pollution two millennia ago by Greek and Roman civilizations. Science, 265: 1841–1843.
Hong SM, Candelone JP, Patterson CC, Boutron CF, 1996. History of ancient copper smelting pollution during Roman and Medieval times recorded in Greenland ice. Science, 272: 246–249.
Hong SM, Lee K, Hou SG, Hur SD, Ren JW, Burn LJ, Rosman KJR, Barbante C, Boutron C, 2009. An 800-year record of atmospheric As, Mo,Sn, and Sb in Central Asia in High-Altitude Ice cores from Mt. Qomolangma (Everest), Himalayas. Environmental Science and Technology,43: 8060–8065.
Hur SD, Xiao CD, Hong SM, Barbante C, Gabrielli P, Lee K, Boutron CF,Yan M, 2007. Seasonal patterns of heavy metal deposition to the snow on lambert Glacier basin, East Antarctic. Atmospheric Environment, 41:8567–8578.
Kaspari S, Mayewski PA, Handley M, Osterberg E, Kang SC, Sneed S, Hou SG, Qin DH, 2009. Recent increases in atmospheric concentrations of Bi,U, Cs, S and Ca from a 350-year Mount Everest ice core record. Journal of Geophysical Research, 114(D0432). doi: 10.1029/2008JD011088.
Krachler M, Zheng J, Koerner R, Zdanowicz C, Fisher D, Shotyk W, 2005.Increasing atmospheric antimony contamination in the northern hemisphere: snow and ice evidence from Devon Island, Arctic Canada. Journal of Environmental Monitoring, 7: 1169–1176.
Lee K, Hur SD, Hou SG, Hong SM, Qin X, Ren JW, Liu YP, Rosman KJR,Barbante C, Boutron CF, 2008. Atmospheric pollution for trace elements in the remote high-altitude atmosphere in Central Asia as recorded in snow from Mt. Qomolangma (Everest) of the Himalayas. Science of the total environment, 404: 171–181.
Li CJ, Li ZQ, Li YF, Wang FT, 2007a. The seasonal variations and environmental significance of trace metals in Urumqi glacier No.1, Tianshan.Chinese Science Bulletin, 37(5): 676–681.
Li CL, Kang SC, Zhang QG, 2009. Elemental composition of Tibetan Plateau top soils and its effect on evaluating atmospheric pollution transport.Environmental Pollution, 157: 2261–2265.
Li YF, Yao TD, Li ZQ, Li Z, Liu YP, Duan JP, 2007c. Determination of trace elements in snow and ice by double focusing inductively coupled plasma-mass spectrometry. Chinese Journal of Analytical Chemistry,35(1): 37–42.
Li YF, Yao TD, Wang NL, Li Z, Tian LD, Xu BQ, Wu GJ, 2006a. Recent changes of atmospheric heavy metals in a high elevation ice core from Muztagh Ata, east Pamirs: initial results. Annals of Glaciology, 43:154–159.
Li YF, Yao TD, Wang NL, Li Z, Tian LD, Xu BQ, 2008. Human activities in the Central Asia revealed by Sb in the Muztagh Ata Ice Core, Eastern Pamirs. Journal of Glaciology and Geocryology, 30(3): 359–364.
Li ZQ, Li CJ, Li YF, Wang FT, Li HL, 2007b. Preliminary results from measurements of selected trace metals in the snow-firn pack on ürümqi Glacier No.1, eastern Tianshan, China. Journal of Glaciology, 53(182):368–373.
Li Z, Yao TD, Tian LD, Xu BQ, Li YF, 2006c. Muztagh Ata ice recorded the variations of atmospheric lead during the near 50 years. Chinese Science Bulletin, 51(15): 1833–1836.
Li Z, Yao TD, Tian LD, Xu BQ, Li YF, 2006b. Atmospheric Pb variations in Central Asia since 1955 from Muztagata ice core record, eastern Pamirs.Chinese Science Bulletin, 51(16): 1996–2000.
Nriagu JO, 1989. A global assessment of natural sources of atmospheric trace metals. Nature, 338: 47–49.
Nriagu JO, Pacyna JM, 1988. Quantitative assessment of worldwide contamination of air, water and soils by trace metals. Nature, 333: 134–139.Pacyna JM, Pacyna EG, 2001. An assessment of global and regional emissions of trace metals to the atmosphere from anthropogenic sources worldwide. Environmental Reviews, 9: 269–298.
Pu JC, 1994. Glacier Inventory of China VII, The Changjiang River Drainage Basin. Lanzhou: Gansu Culture Press.
Wedepohl KH, 1995. The composition of the continental crust. Geochimica ET Cosmochimica Acta, 59(7): 1217–1232.
Zhang QG, Kang SC, Cong ZY, Hou SG, Liu YQ, 2008. Elemental composition in surface snow from the ultra-high elevation area of Mt. Qomolangma (Everest). Chinese Science Bulletin, 53(2): 289–294.
Zhang XP, Yao TD, Tian LD, Liu JM, 2003. Stable oxygen isotope in water mediums in Urumqi River basin. Advances in Water Science, 14(1):50–56.
10.3724/SP.J.1226.2011.00216
*Correspondence to: YueFang Li, State Key Laboratory of Cryospheric Science, Cold and Arid Regions Environmental and Engineering Research Institute, Chinese Academy of Sciences. No.320 West Donggang Road, Lanzhou, Gansu 730000,China. Tel: +86-0931-4967367; Email: liyf@lzb.ac.cn
14 December 2010 Accepted: 12 March 2011
 Sciences in Cold and Arid Regions2011年3期
- Sciences in Cold and Arid Regions的其它文章
- Will Glacier No.1 Tianshan exist in the 22nd century?
- Sensitivity of mountain runoff to climate change for Urumqi and Kaidu rivers originating from the Tianshan Mountains
- The research of sea-land breeze (SLB) on the west coast of Bohai Bay based on field observation
- Effects of grazing and climate change on sandy grassland ecosystems in Inner Mongolia
- Temporal variations in aerosol composition at Lanzhou City, Northwestern China
- Hydrological and climatological glaciers observation 20 years on Tanggula Pass of Tibetan Plateau: its significance and contribution